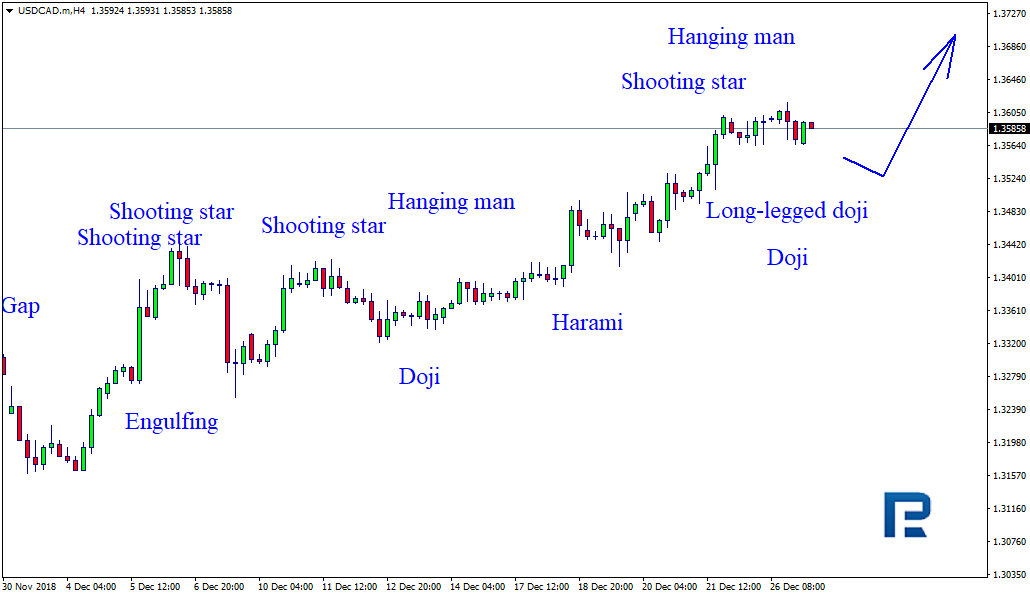
As we can see in the H4 chart, USDCAD is still trading close to the resistance level and forming Shooting Star, Doji, Long-Legged Doji, and Hanging Man reversal patterns. Judging by the previous movements, at the moment it may be assumed that right now the instrument may form another correction and then resume its ascending movement.
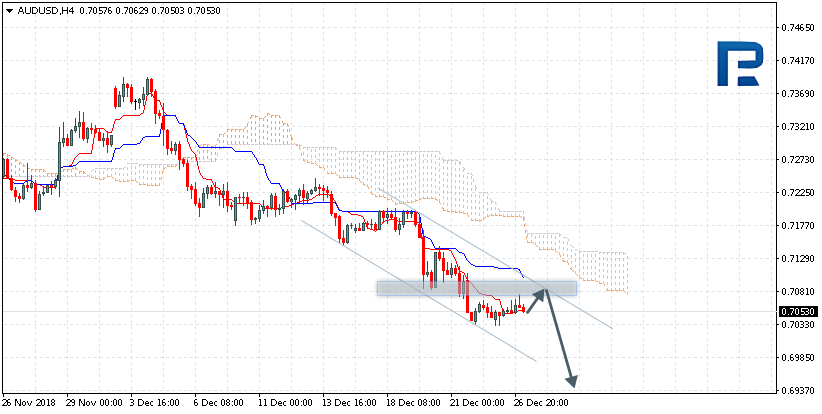
AUDUSD, “Australian Dollar vs US Dollar”
As we can see in the H4 chart, AUDUSD is still trading close to the support level and forming Hammer, Harami, Doji, and Inverted Hammer reversal patterns. Judging by the previous movements, it may be assumed that after finishing the correction the instrument may continue the downtrend.
Attention! Forecasts presented in this section only reflect the author’s private opinion and should not be considered as guidance for trading. RoboForex LP bears no responsibility for trading results based on trading recommendations described in these analytical reviews.
AUDUSD is trading at 0.7053; the instrument is moving below Ichimoku Cloud, thus indicating a descending tendency. The markets could indicate that the price may test Tenkan-Sen and Kijun-Sen at 0.7080 and then resume moving downwards to reach 0.6940. Another signal to confirm further descending movement is the price’s rebounding from the channel’s upside border. However, the scenario that Implies further decline may be cancelled if the price breaks the upside border of the cloud and fixes above 0.7130. In this case, the pair may continue growing towards 0.7205. After breaking the support level and fixing below 0.7020, the price may continue moving downwards.
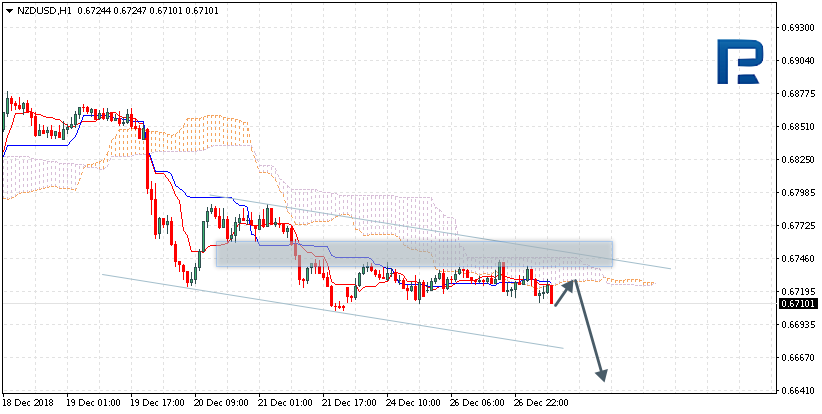
NZDUSD, “New Zealand Dollar vs US Dollar”
NZDUSD is trading at 0.6710; the instrument is moving below Ichimoku Cloud, thus indicating a descending tendency. The markets could indicate that the price may test the downside border of the cloud at 0.6725 and then resume moving downwards to reach 0.6655. Another signal to confirm further descending movement is the price’s rebounding from the resistance level. However, the scenario that Implies further decline may be cancelled if the price breaks the upside border of the cloud and fixes above 0.6755. In this case, the pair may continue growing towards 0.6875. After breaking the support level and fixing below 0.6700, the price may continue moving downwards.
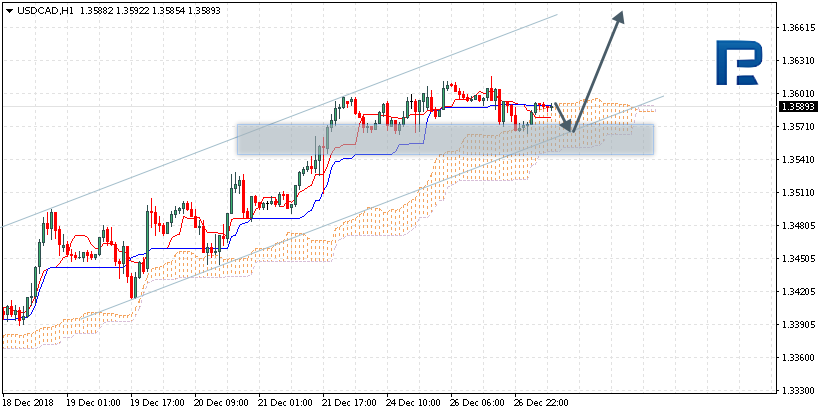
USDCAD, “US Dollar vs Canadian Dollar”
USDCAD is trading at 1.3589; the instrument is moving above Ichimoku Cloud, thus indicating an ascending tendency. The markets could indicate that the price may test Tenkan-Sen and Kijun-Sen at 1.3570 and then resume moving upwards to reach 1.3695. Another signal to confirm further ascending movement is the price’s rebounding from the channel’s downside border. However, the scenario that implies further growth may be cancelled if the price breaks the downside border of the cloud and fixes below 1.3535. In this case, the pair may continue falling towards 1.3425.
Attention! Forecasts presented in this section only reflect the author’s private opinion and should not be considered as guidance for trading. RoboForex LP bears no responsibility for trading results based on trading recommendations described in these analytical reviews.
The EUR/USD technical picture remains ambiguous. The quotes are consolidating, the EUR is testing the local support and resistance levels 1.13700 and 1.14000. The financial market participants are waiting for important stats from the US.
The Economic News Feed for 27.12.2018:
– Customer Trust Index (US) – 17:00 (GMT+2:00);
– New Real Estate Sales (US) – 17:00 (GMT+2:00).
The indicators do not provide precise signals, the price has crossed 50 MA and 200 MA.
The MACD histogram is located close to 0.
The Stochastic Oscillator is in the neutral zone, the %K line is below the %D line, which points toward a bearish sentiment.
Trading recommendations
Support levels: 1.13700, 1.13300, 1.13000
Resistance levels: 1.14000, 1.14350, 1.14750
If the price fixes above the round 1.14000, expect the EUR/USD quotes to grow toward 1.14350-1.14700.
Alternatively the quotes can descend toward 1.13400-1.13200.
The GBP/USD currency pair
Technical indicators of the currency pair:
Prev Open: 1.26602
Open: 1.26311
% chg. over the last day: -0.32
Day’s range: 1.26284 – 1.26665
52 wk range: 1.2477 – 1.4378
The GBP/USD is still being traded in a long flat. There is no single defined trend. The key support and resistance levels are 1.26300 and 1.26750. Positions should be opened from these levels. You should keep an eye on the US news feed.
The Economic News Feed for 27.12.2018 is calm.
The indicators do not provide precise signals, the price fixed between 50 MA and 200 MA.
The MACD histogram is in the negative zone but above the signal line, which gives a weak signal to sell GBP/USD.
The Stochastic Oscillator is in the neutral zone, the %K line is crossing the %D line. There are no signals yet.
Trading recommendations
Support levels: 1.26300, 1.26000, 1.25750
Resistance levels: 1.26750, 1.27000, 1.27350
If the price fixes above 1.26750, consider buying GBP/USD. The movement will tend toward 1.27000-1.27350.
Alternatively the quotes can descend toward 1.26000-1.25750.
The USD/CAD currency pair
Technical indicators of the currency pair:
Prev Open: 1.35782
Open: 1.35679
% chg. over the last day: -0.11
Day’s range: 1.35662 – 1.36110
52 wk range: 1.2248 – 1.4132
USD/CAD is consolidating after a long rally. There is no singular trend. Luni is testing the key support and resistance levels of 1.32650 and 1.36150. A technical correction is possible soon. Keep an eye on the oil quotes dynamic and open positions from the key levels.
The Economic News Feed for 27.12.2018 is calm.
The indicators do not provide precise signals, the price is testing 50 MA.
The MACD histogram is close to 0.
The Stochastic Oscillator is near the overbought zone, the %K line is crossing the %D line. There are no signals at the moment.
Trading recommendations
Support levels: 1.35650, 1.35250, 1.34900
Resistance levels: 1.36150, 1.36500
If the price fixes above the resistance level of 1.36150, expect further growth of the USD/CAD quotes. The movement will tend toward 1.36500-1.36700.
Alternatively the quotes fix below 1.35650 and you should expect a corrective trend toward 1.35300-1.35000.
The USD/JPY currency pair
Technical indicators of the currency pair:
Prev Open: 110.230
Open: 111.301
% chg. over the last day: +0.85
Day’s range: 110.809 – 111.340
52 wk range: 104.56 – 114.56
USD/JPY started to grow after a long descend. Yesterday the quotes grew by 100 points and updated the local maximums. Right now the safe haven currency is consolidating and has good prospects for growth. Positions should be opened from the key levels.
The Economic News Feed for 27.12.2018 is calm.
The indicators do not provide precise signals, the price has fixed between 50 MA and 200 MA.
The MACD histogram is in the positive zone but below the signal line, which gives a weak signal to buy USD/JPY.
The Stochastic Oscillator is in the neutral zone, the %K line is crossing the %D line. There are no signals at the moment.
Trading recommendations
Support levels: 110.750, 110.150
Resistance levels: 111.400, 111.900, 112.250
If the price fixes above the resistance level of 111.400, expect further growth of the USD/JPY quotes toward 111.900-112.250.
Alternatively the quotes can descend toward 110.250-110.100.
The US dollar strengthened against a basket of major currencies during yesterday’s trading. American currency was supported by the news that the US government delegation would go to Beijing for talks, which, according to preliminary data, would take place on January 7. It should be recalled that in early December, Chinese President, Xi Jinping, and the US President, Donald Trump, met at the G20 summit and agreed to freeze the introduction of 25% duties on Chinese goods for 90 days. The dollar index (#DX) closed yesterday in the positive zone (+0.60%).
Yesterday, the news feed was rather calm, as the financial markets of most countries were closed due to the Boxing Day. Today we expect important economic statistics from the United States.
The “black gold” prices have been recovering. At the moment, futures for the WTI crude oil are testing the mark of $45.65 per barrel. At 23:30 (GMT+2:00), a report on the API weekly crude oil stock will be published.
Market Indicators
Yesterday, aggressive purchases were observed on the US stock market: #SPY (+5.05%), #DIA (+4.86%), #QQQ (+6.24%).
The 10-year US government bonds yield has begun to recover. Currently, the indicator is at the level of 2.76-2.77%.
The news feed on 27.12.2018:
– CB consumer confidence index in the US at 17:00 (GMT+2:00); – New home sales at 17:00 (GMT+2:00).
Since its development in 2009, cryptocurrency has been in the financial space as both a threat and an innovation to the business and economic scene. Budget investors have been swayed by the virtual monetary device that offers anonymity, easy international transactions, and feasibility as an investment instrument.
Its familiarity has bred numerous investors in the market. Their rising number has now been converted to the increased value of crypto coins and the addition of shops that credit virtual currency as payment.
Top Cryptocurrencies
Websites such as CoinMarketCap track cryptocurrencies that are hitting the market and show their current value in dollars. Among the top cryptocurrencies are Bitcoin, Ethereum, and Litecoin.
Bitcoin (BTC). It remains to be the most popular form of cryptocurrencies. Bitcoin price is at $6,573.69 per coin. Bitcoin’s decentralized nature paved the way for more cryptocurrencies to enter the market. It continues to be on top of the list of the best cryptocurrencies, not only because of its pioneer identity but also because of its increasing market cap in the virtual financial world.
Ethereum (ETC). Bitcoin’s second closest cryptocurrency competitor, Ethereum, lingers at $506.94 per coin and it prides itself in the processing of smart contracts. This cryptocurrency started out as a tool to monetize applications in the Ethereum network. Budget investors are urged to look into its ability to allow the creation of distributed applications without interference from another party. The ETC is also popular among initial coin offerings (ICOs), an aid for startup crypto junkies.
Litecoin (LTC). Often considered as Bitcoin’s clone, Litecoin is at $98.07 per coin. Familiarity is one of the assets that Litecoin has to offer to its investors since it is one of the oldest cryptocurrencies in the market. Since 2011, its fast transaction speed and close connection to Bitcoin continue to be its premium quality.
Cheapest Cryptocurrencies
For budget investors, here are a few of the cheapest cryptocurrencies in the market now:
Bitshare (BTS), currently trading at $0.086510, with an all-time high of $0.40.
Lykke (LKK), trading at $0.36, with an expected price of $1.50 to $2.3.
Verge (XVG), recommended for long-term portfolio addition as it trades at $0.006560.
Digibyte (DGB), trading at $0.008941 with its highest point being $0.06
Investors themselves must also take necessary precautions before investing in cryptocurrency. For starters, investors should research the concept of the blockchain, which serves as the facilitator for the financial transactions involving cryptocurrency. Transactions could revolve around financial contracts, real estate deeds, personal identification, bank transfers, and also insurance. After doing the necessary research on the blockchain, investors should also be mindful of ICOs. This type of networked funding, which is usually done to gather capital for startup companies, often turns out as fraudulent. Investors should take the time to know where they put their coins as one of the cryptocurrency’s disadvantages is its confusing nature. Its popularity often sways newbies into thinking that unrealistic amounts of money can be obtained in just a short investment span.
None of the content on Hoganinjury.com is legal advice nor is it a replacement for advice from a certified lawyer. Please consult a legal professional for further information.
After the market opening, EURUSD is forming another descending structure to reach 1.1350. After that, the instrument may be corrected to return to 1.1414 and then resume trading inside the downtrend with the short-term target at 1.1250.
GBPUSD, “Great Britain Pound vs US Dollar”
GBPUSD is trading downwards to reach 1.2685. Later, the market may form one more ascending structure with the short-term target at 1.2750.
USDCHF, “US Dollar vs Swiss Franc”
USDCHF is consolidating close to the downside border of the range. Possibly, today the pair may grow to break 0.9977 and then continue trading inside the uptrend with the target at 1.0070. According to the main scenario, the price is expected to continue this ascending wave.
USDJPY, “US Dollar vs Japanese Yen”
USDJPY has broken 110.90 downwards and expanded the range. Possibly, the pair may grow to test 110.90 from below and then resume falling towards 109.77. After that, the instrument may continue forming the third wave with the target at 107.50.
AUDUSD, “Australian Dollar vs US Dollar”
AUDUSD has formed another consolidation range around 0.7044. If later the instrument breaks this range to the upside, the pair may be corrected with the target at 0.7090; if to the downside – resume trading inside the downtrend towards 0.7000. Later, the market may form a reversal pattern and start a new correction to reach 0.7200.
USDRUB, “US Dollar vs Russian Ruble”
USDRUB is still trading upwards with the target at 68.98. After that, the instrument may start a new correction towards 67.20 and then form one more ascending structure to reach 69.40. Later, the market may resume trading inside the downtrend.
XAUUSD, “Gold vs US Dollar”
Gold is trading upwards. Today, the pair may reach 1274.74 to extend the correction. Possibly, the price may form another consolidation range with a reversal pattern close to the highs. After that, the instrument may start a new correction with the first target at 1230.33.
BRENT
Brent has almost reached its downside target at 50.00. Possibly, the pair may form another consolidation range with a reversal pattern near the lows and start a new ascending structure with the first target at 63.30.
Attention! Forecasts presented in this section only reflect the author’s private opinion and should not be considered as guidance for trading. RoboForex LP bears no responsibility for trading results based on trading recommendations described in these analytical reviews.
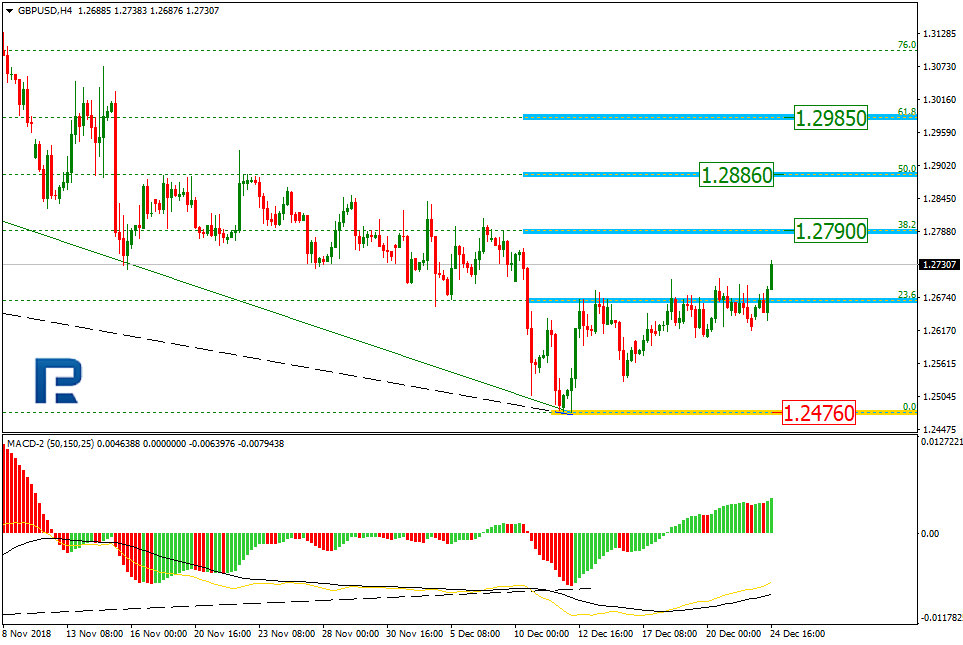
As we can see in the H4 chart, there was a convergence on MACD, which made GBPUSD start a new correctional uptrend towards the retracement of 38.2% at 1.2790. In the future, the correction may continue towards the retracements of 50.0% and 61.8% at 1.2886 and 1.2985 respectively. The support is the low at 1.2476.
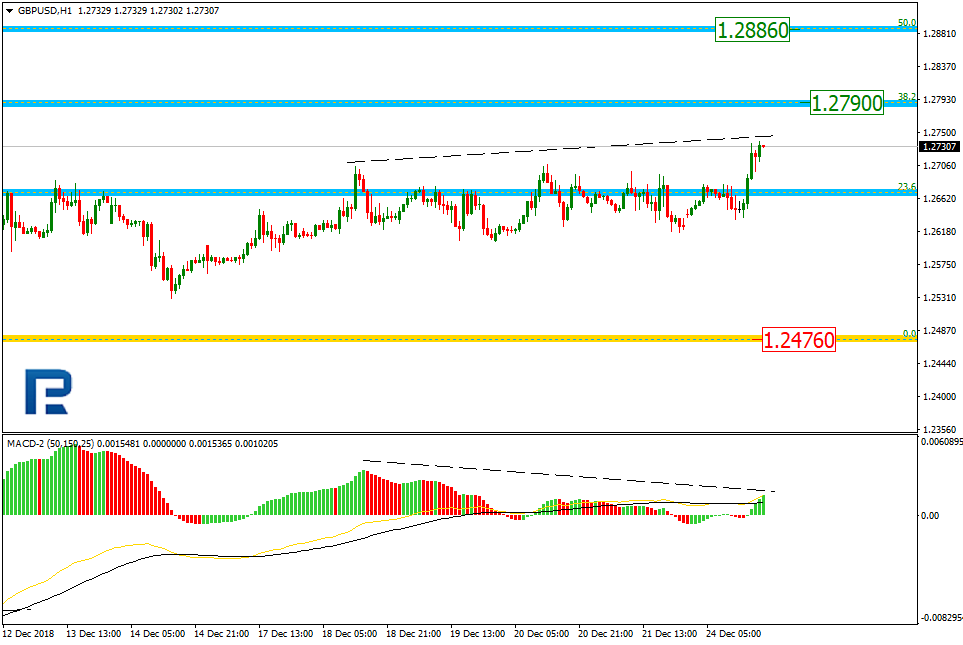
The H1 chart shows more detailed structure of the current rising tendency. There is a divergence on MACD, which means that the price may start a new pullback after reaching the target.
EURJPY, “Euro vs. Japanese Yen”
As we can see in the H4 chart, EURJPY has broken the previous low and right now is still trading downwards to reach towards the post-correctional extension area between the retracements of 138.2% and 161.8% at 125.30 and 124.46 respectively. The resistance is at 126.63.
In the H1 chart, there is a divergence on MACD, which may indicate a new correction after the instrument reaches the post-correctional extension retracement of 138.2% at 125.30.
Attention! Forecasts presented in this section only reflect the author’s private opinion and should not be considered as guidance for trading. RoboForex LP bears no responsibility for trading results based on trading recommendations described in these analytical reviews.
The trading activity and volatility on the major currencies have lowered due to the holidays. The USD is under pressure due to the political instability in the White House. The EUR is consolidating, the local support and resistance are 1.13700 and 1.14150. Positions should be opened from these levels.
The Economic News Feed for 26.12.2018 is calm.
The indicators do not provide precise signals, the price has crossed 50 MA and 200 MA.
The MACD histogram is near the 0 mark.
The Stochastic Oscillator is in the neutral zone, the %K line is below the %D line, which points toward a bearish mood.
Trading recommendations
Support levels: 1.13700, 1.13300, 1.13000
Resistance levels: 1.14150, 1.14400, 1.14800
If the price fixes above the resistance level 1.14150, expect further growth of the EUR/USD quotes. The movement will tend toward 1.14400-1.14700.
Alternatively the quotes can descend toward 1.13400-1.13200.
The GBP/USD currency pair
Technical indicators of the currency pair:
Prev Open: 1.26414
Open: 1.26602
% chg. over the last day: +0.29
Day’s range: 1.26542 – 1.27186
52 wk range: 1.2477 – 1.4378
GBP remains in a long flat. The technical picture is still ambiguous. The local support and resistance levels are 1.26700 and 1.27100. The financial market participants are waiting for additional drivers. You should open positions from these levels.
The Economic News Feed for 26.12.2018 is calm.
The price fixed above 50 MA and 200 MA which points toward the power of the buyers.
The MACD histogram is in the positive zone, which also signalizes a bullish mood.
The Stochastic Oscillator is in the neutral zone, the %K line crosses the %D line. There are no signals at the moment.
Trading recommendations
Support levels: 1.26700, 1.26250, 1.26000
Resistance levels: 1.27100, 1.27350
If the price fixes above the 1.27100 you should consider buying GBP/USD. The movement will tend toward 1.27400-1.27600.
Alternatively the quotes can descend to 1.26500-1.26250.
The USD/CAD currency pair
Technical indicators of the currency pair:
Prev Open: 1.35939
Open: 1.35782
% chg. over the last day: -0.12
Day’s range: 1.35782 – 1.36135
52 wk range: 1.2248 – 1.4132
The USD/CAD currency pair shows a strong ascending trend. The CAD has weakened against the US by 350 pips since the beginning of the month. The USD/CAD currency pair is consolidating between 1.35650-1.36150. Positions should be opened from these levels. A technical correction is possible soon.
The Economic News Feed for 26.12.2018 is calm.
The price fixed above 50 MA and 200 MA, which indicates the power of the buyers.
The MACD histogram is in the positive zone but below the signal line, which gives a weak signal for buying USD/CAD.
The Stochastic Oscillator is in the neutral zone, the %K line is below the %D line, which indicates a bearish mood.
Trading recommendations
Support levels: 1.35650, 1.35250, 1.34900
Resistance levels: 1.36150, 1.36500
If the price fixes above the resistance level 1.36150 expect further growth of the USD/CAD quotes. The movement will tend to 1.36500-1.36700.
Alternatively, the price will fix below 1.35650, and you should look for the market entry points to open short positions. The movement will tend toward 1.35300-1.35000.
The USD/JPY currency pair
Technical indicators of the currency pair:
Prev Open: 110.942
Open: 110.230
% chg. over the last day: -0.56
Day’s range: 110.138 – 110.673
52 wk range: 104.56 – 114.56
The USD/JPY currency shows a strong descending trend. The quote is consolidating around the monthly minimums. The key range is 110.200-110.700. A technical correction is possible soon. You should keep an eye on the US treasury bonds.
The Economic News Feed for 26.12.2018 is calm.
The indicators point toward the power of the buyers, the price fixed below 50 MA and 200 MA.
The MACD histogram is in the negative zone but above the signal line, which gives a weak signal to sell USD/JPY.
The Stochastic Oscillator is in the neutral zone, the %K line is above the %D line, which points toward a recovery of USD/JPY.
Trading recommendations
Support levels: 110.200, 110.000
Resistance levels: 110.700, 111.000, 111.450
If the price fixes below 110.200 expect further descend of the USD/JPY quotes toward 110.000-109.800.
Alternatively the quotes can recover toward 111.000-111.400.
Before you start investing in cryptocurrency, there is a lot that you need to know. We have discovered guidelines on how to use our finances and money. But digital currency is generally a new concept with which many people are not familiar. Because cryptocurrency is an exciting and lucrative new opportunity to invest, some young people may be tempted to jump in blindly. This is why we have decided to prepare a list of ten things that you must know about cryptocurrency. Therefore, this article is for entrepreneurs, young investors and the general public who have an interest in buying and selling cryptocurrencies.
Blockchain Technology Did you know that all cryptocurrencies operate on blockchain technology? Understanding how this works may be the toughest part of dealing with blockchain, but once it is clear, then you are good to go. During the buying and selling of cryptocurrency, a new chain is introduced. Additionally, the blockchain is updated when new coins are released. The coins that you own are also recorded somewhere on a certain chain. The blockchain must not be broken for a transaction to take place.
Cryptocurrency Mining Mining is a process that creates cryptocurrency. If you do not want to invest in cryptocurrency, you can become a miner and enjoy earning as a result of creating new cryptocurrency. Miners perform various tasks and are rewarded through profit on the cryptocurrency that they mine. Miners use powerful computers to create more cryptocurrency.
Few Hurdles to Entry There are only a few hurdles that are required to partake in this kind of investment. Also, you can buy a few coins to start your journey. Perhaps, all you need is a device that can access the internet. There is nothing much required for you to become a miner except for having the knowledge to do it and the necessary tools.
Buy and Sell Anywhere Cryptocurrencies can be bought and sold anywhere. The marketplace is online and can be accessed globally. Since cryptocurrency is a digital currency, you can conduct transactions with people from any corner of the world. The miners are located in different parts of the world as well. To become a cryptocurrency investor, location is not part of the qualifications. You also have the freedom to trade from any location, which makes it a lucrative opportunity for people who travel frequently.
No Centralized Control All cryptocurrencies are unregulated, and this has facilitated their global acceptance. Major investors continue buying these digital coins in large numbers with the hope that no one will regulate what they do with them. No one can question the transactions completed at any one given time. In fact, the origin of these digital coins is not evident in any way. Cryptocurrencies have also gained significant acceptance on the dark web because of this quality.
Finite Number of Coins Unlike real money that can be printed after a decision by the economic leaders of a country, cryptocurrencies are finite. Perhaps, this is the main reason why they have maintained a high degree of stability all this while. For instance, no more than 21 million Bitcoins can ever be created, and the blockchains will not generate any more after that. Most people do not know what will happen when the maximum Bitcoin limit is reached.
Lost Wallet Means Lost Money According to the experts at https://trybe.one/, protecting your cryptocurrency wallet is essential. It can be stolen by malicious hackers who gain access to your computer or phone. Also, someone may accidentally delete the digital wallet. Once you cannot access it for some reason, it is time to acknowledge that your money is gone for good. The first step of protection is to lock the device so that people cannot access it. Better still, using lockable folders will create one more protection for your money.
Understand ICOs Initial coin offerings are now common as new cryptocurrencies join the market. The companies create so much hope that their coins are going to be the best and soon surpass the giants like Ethereum and Bitcoin. But what matters is whether or not you are going to invest all your money into this new commodity on the market. Experienced investors either wait or buy a small number on a trial basis. Now that you understand what the ICOs are, it is easy to make a decision once you encounter them.
Fluctuation in Value Most of the cryptocurrencies have shown consistent growth in their value with Bitcoin leading. But theoretically, there could be fluctuations in value with either less expensive or more expensive digital coins. Cryptocurrencies are expected to behave like a normal currency although economic factors are not likely to affect their operations. As international currencies that are digital and unregulated, cryptocurrencies have an edge over regular money.
Resistance to Cryptocurrency Even though we have already mentioned cryptocurrencies are not regulated by anyone, they still encounter resistance from various governments who could ban them if it were possible. Such resistance is a big hurdle that prohibits their circulation for the buying of goods, paying of taxes and many other uses. People can only use them on their computers and devices. Bear this in mind before you start investing. With all these insights about cryptocurrencies, you can avoid mistakes. It is time to begin investing in cryptocurrency, keeping in mind that it is a lucrative business that has prospered over the years and allowed many people to achieve their investment dreams.
The US dollar is falling against a basket of major currencies due to news from the White House. The US government partially suspended its work on the weekend after Donald Trump demanded funds for the construction of the wall on the border with Mexico. Yesterday, the US President announced that he would not resume the work of the government until the demand was fulfilled. The dollar index (#DX) updated monthly lows and closed on Monday in the negative zone (-0.46%).
Also, Donald Trump’s dissatisfaction with the next increase in interest rates put pressure on the US dollar. The US President believes that the Fed is the biggest problem of the American economy and may soon demand the Fed’s Chairman Jerome Powell to resign. Yesterday, the news feed was calm due to Catholic Christmas and financial markets were closed. Today, the financial markets of most countries are also closed due to the Boxing Day.
The “black gold” prices are recovering after a sharp collapse the day before. At the moment, futures for the WTI crude oil are testing the mark of $43.00 per barrel.
Market Indicators
On Monday, aggressive sales were observed in the US stock market: #SPY (-2.64%), #DIA (-2.67%), #QQQ (-2.76%).
The 10-year US government bonds yield has continued to decline. At the moment, the indicator is at the level of 2.72-2.73%.
The news feed on 26.12.2018:
Today, the publication of important economic news is not expected