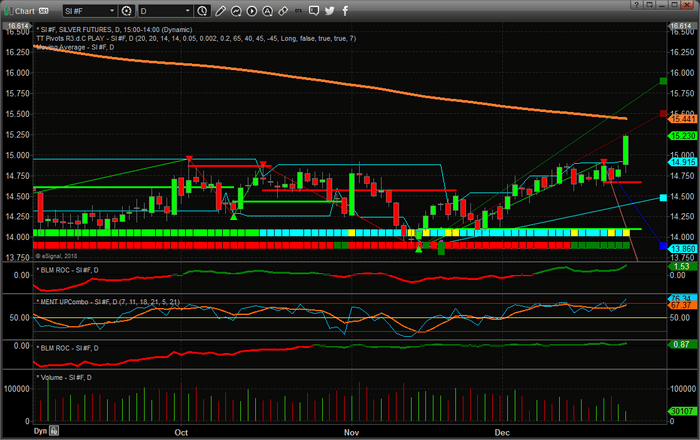
Watch Silver, folks. This quiet shiny metal is starting a move that could be very foretelling of global market concerns and risks. Early on December 26, 2018, Silver broke through recent resistance, to the upside, with a relatively large 2.8%+ upside move. Why is this so important to traders? Because Silver is the “sleeper metal” that is typically the last to react to global economic concerns. Once Silver starts to move to the upside with a renewed bullish trend, we believe this move would indicate that bigger players are starting to accumulate Silver as a safe haven for future economic concerns/crisis events.
This Daily chart of Silver shows the December 26 upside breakout move. We can clearly see the breakout above $15.00 and the historical resistance just below $15.00. This move is extremely important in the context of the total risk play that has recently played out through the past two months. Take a look as how quiet the Silver market has been over the past few months. Take a look at how Silver reacted only moderately to the recent market selloff and Fed statements. There was no real “fear” exhibited in the metals markets or in Silver over the past 60+ days. Yet, today, there is some real fear that is playing out in the price of Silver.
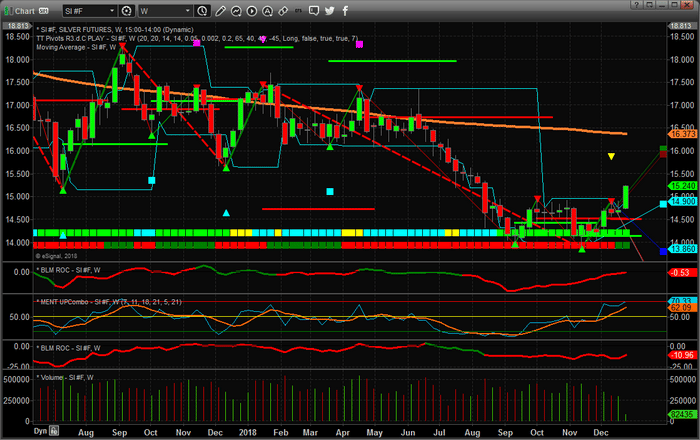
This next Weekly Silver chart helps us to understand the total scope of this move and what we could expect to see as an immediate upside price target. Our Adaptive Fibonacci Price modeling system is suggesting that $16.00 is an immediate upside price target and is showing us the current trend is bullish and that price volatility is increasing. Overall, we could see a move well above $17.00 on an extended run in the metals.
Watch how this “sleeper metal” plays out over the next few weeks and months. This upside breakout is very important to investors for the simple reason that it indicates a renewed level of “fear” is entering the markets and we could be starting a very big upside move in the metals markets again. The last time Silver entered a massive bullish phase it shot up over 400%. If a similar move happens again in the near future, Silver could reach a price level near $60~65 per ounce.
Want to know how to position your investments to take advantage of these types of moves and learn how to capture greater opportunities in the markets? 2019 is setting up to be an incredible year for traders with the skills and insight to find and execute these types of trades. We have already been positioning our members for this move and we believe 2019 will provide incredible opportunities for all skilled traders. Take a minute to visit TheTechnicalTraders.com to learn how we can help you in 2019 and join our other members in finding greater success.
As China’s growth seems to be slowing, some observers see the country amid a “severe downturn.” As they mistake China’s secular deceleration with cyclical fluctuations, they miss the rapid increase in Chinese living standards.
Amid the Christmas meltdown, the Dow Jones plunged to less than 22,000, the lowest since September 2017. Thereafter, it soared over 1,000 points; the biggest single-day point gain ever. Nevertheless, it has declined 4,000 points in two months.
It is this historical market volatility associated with the Trump administration that now overshadows world economy and China. In recent weeks, the U.S. economy has become increasingly exposed to policy mistakes and drastic market fluctuations.
In 2019, Chinese economy will have to cope with great international uncertainty and even more extraordinary market volatility.
Short-term fluctuations versus longer-term trends
Recently, New York Times reported that China was amid “a steep downturn.” Indeed, since the U.S. trade wars last spring, there has been much chatter in the West about the “China’s economic slowdown.”
Once again, the not-so-informed observers have focused on quarterly growth, at the expense of annualized growth. In this regard, 2018 was an exceptional year in China and elsewhere. In the first half, global recovery was still gaining ground. In the second half, Trump’s trade wars caused substantial collateral damage that will be felt even more in 2019, in the absence of a constructive reconciliation.
Yet, China’s growth forecast for 2018 remains 6.5- 6.6%, after a strong first half. Moderation will ensue in the second half and especially in 2019, depending on U.S. tariffs and slower demand worldwide.
For 2019, Chinese GDP growth could eventually achieve around 6.2% in full-year growth, assuming policymakers succeed in the challenging balancing act to sustain higher-quality growth while suppressing faster debt accumulation.
The government’s GDP growth target, which may be formally announced only next March, is likely to reflect steady deceleration, due to international headwinds, particularly the trade wars, and more secular pressures, such as demographics, slowing cyclical growth, and other environmental, debt and real estate market issues
Overall, such deceleration is normal after years of rapid industrialization and growth acceleration, however.
Decelerating growth, but rising incomes
If Chinese government would ignore its commitment to poverty eradication, higher living standards and sustainability, it could achieve more rapid growth, but only at the cost of people’s livelihood, living standards and environment.
On the other hand, policymakers cannot accept too much deceleration either. While the country’s economic growth is decelerating, Chinese living standards should continue to rise. The effort to double average incomes – as measured by GDP per capita, with purchasing power parity – between 2010 and 2020 requires growth to remain around 6.1% in 2019-2020.
In international comparison, Chinese growth rate is currently positioned to decelerate from 9.6% to 5.6% between 2008 and 2023. Despite this deceleration, living standards will almost double. In 2008, Chinese GDP per capita was less than $7,900. By 2023, it could increase to more than $21,200. That would indicate that Chinese living standards would almost double in 2010-20 (Figure).
Figure China’s Growth Deceleration, Rising Per Capita Incomes, 2008-E2023
Growth rate: GDP, constant prices, percent change. Per capita income: GDP per capita, constant prices (purchasing power parity; 2011 international dollars)
Source: IMF/WEO Database; Difference Group
Furthermore, since current growth is around 6.5%, policy authorities are likely to prefer gradual deceleration, which fosters stability, over more abrupt slowing growth, which is perceived as disruptive.
Finally, China’s potential growth continues to indicate that a growth rate that exceeds 6.0% is achievable and viable, though certainly not an easy task in the current international environment.
Fiscal, monetary accommodation, and rebalancing
The government is likely to prefer supportive fiscal policy as the primary tool to ensure stable growth. In this quest, fixed investment, particularly infrastructure, is expected to play a key role as consumption and export growth are likely to slow – the former due to increasing consumer caution, the latter due to the trade wars.
China’s monetary stance is likely to remain accommodative, which implies mild, but manageable rise in inflation (closer to 2.5% rather than 2.2% in 2018). Consequently, Chinese yuan is likely to soften against the U.S. dollar up to 7.0, as long as the current tensions overshadow the bilateral U.S.-Sino relations.
While Washington is pushing for abrupt changes in Chinese economic policies, Beijing will stay the course, as President Xi Jinping said in the recent 40-year anniversary of Chinese economic reforms.
In practice, policy focus will continue to shift from cyclical stimulus and debt-fueled growth toward structural reforms, higher-quality growth and the rebalancing of Chinese economy from investment and exports toward consumption and innovation by 2030.
Elusive international headwinds
If, in the course of 2019, U.S. trade wars broaden disruptively from exports to investment and intellectual property, international environment may require substantial downgrading of economic prospects in many major economies.
Even in a benign scenario, the global recovery that began in the advanced West in the aftermath of the global crisis of 2008, thanks in great part to China’s dramatic growth through those years, is set to slow down in 2019-20.
The major advanced economies are heading toward a complicated, economically challenging and politically divisive stagnation. Unfortunately, much of these downside risks remain under-valued in the West.
The greater the gap between misguided perceptions and economic realities, the more challenging will be the awakening.
About the Author:
Dr Steinbock is an internationally recognized expert of the multipolar world economy, founder of Difference Group Ltd and has served at the India, China, and America Institute (US), Shanghai Institutes for International Studies (China) and the EU Center (Singapore). For more information, see http://www.differencegroup.net/
The original briefing was published by Chinaorg – China’s official government portal – on December 28, 2018.
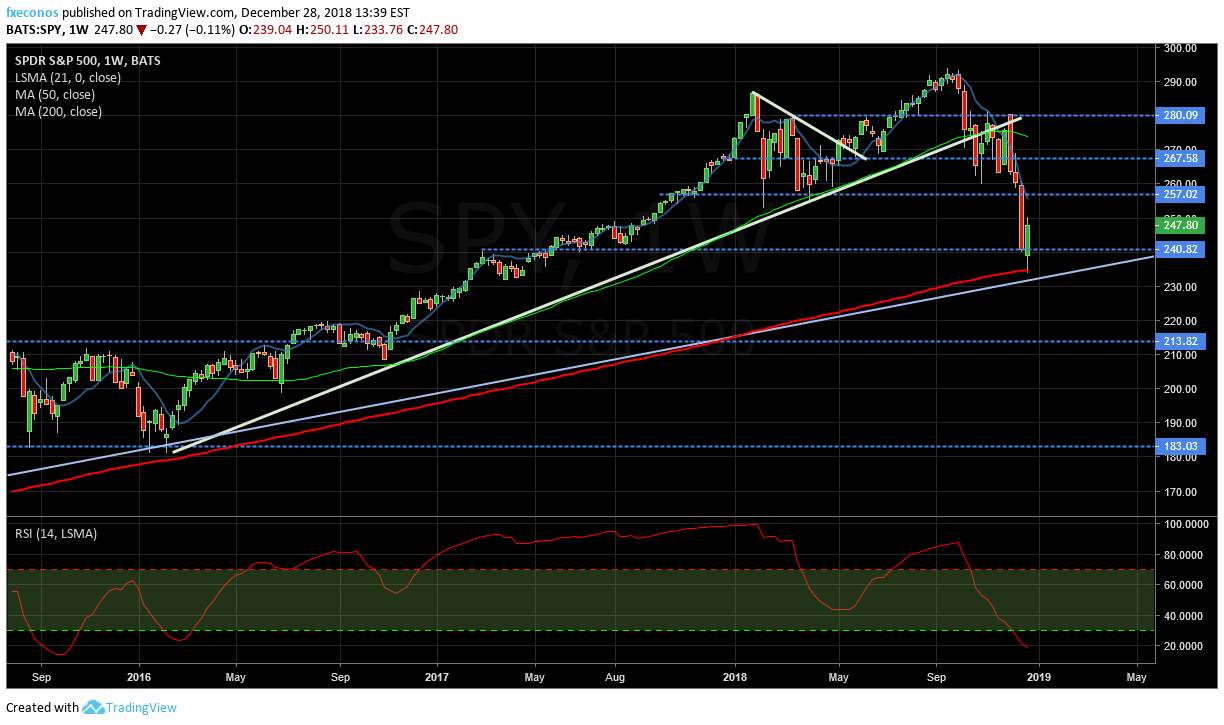
SPY ETF is currently up for the week after a dramatic fall over the last ten days. The SPY has dipped into our oversold territory for the first time since February 2016 but found support this week at the 200-Week Moving Average (red line above). #stocks #spy #investing #stockmarket #sp500 #invest
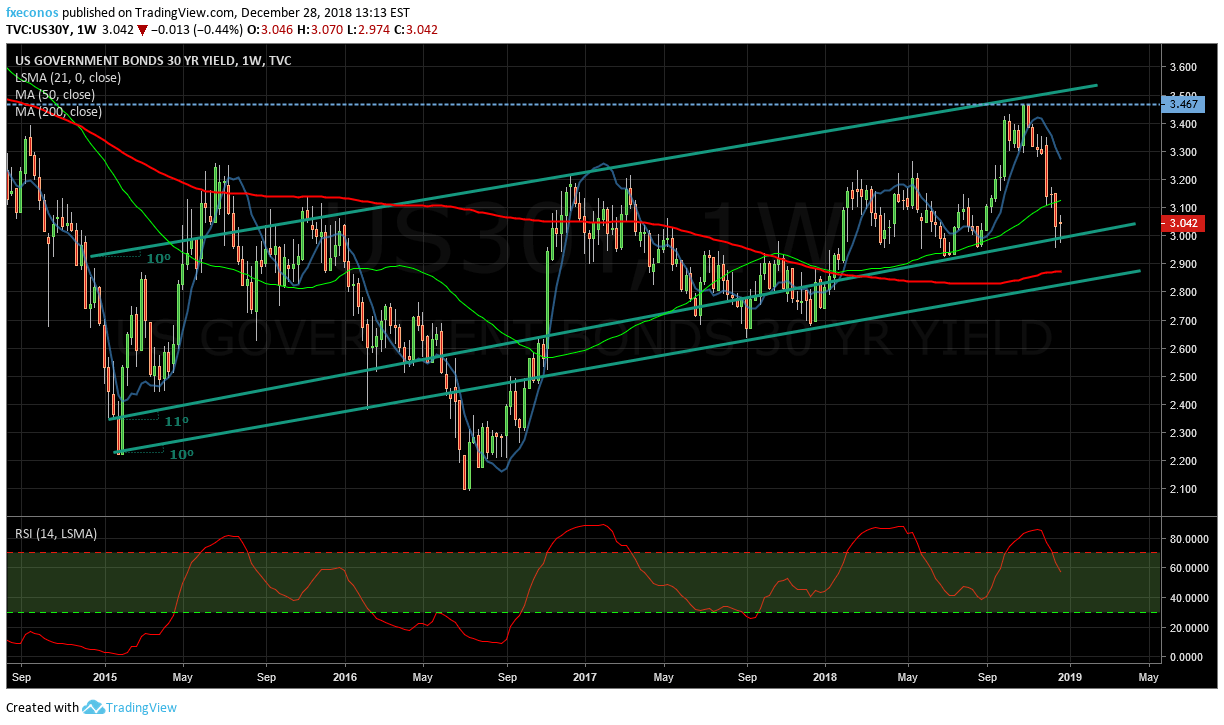
The 30-Year Bond yield has fallen over 12% or approximately 340+ basis points since reaching a multi-year high in late October. That level at 3.46% was the highest yield since June 2014. #30-year-bond #bonds #countingpips #macro #investing
As we can see in the H4 chart, the correctional uptrend has failed to reach the retracement of 38.2% at 4427.00; there was a divergence on MACD and it made BTCUSD start a new decline, which may be considered as an internal correction. After finishing it, the price may form another ascending wave towards the retracement of 50.0% at 4835.00. At the same time, the current descending impulse may be one more wave inside the long-term downtrend. If the pair breaks the low at 3121.90, the instrument may fall towards the post-correctional extension area between the retracements of 138.2% and 161.8% at 2700.00 and 2435.00 respectively.
In the H1 chart, the pair is falling towards the retracements of 61.8% and 76.0% at 3547.00 and 3390.00 respectively.
ETHUSD, “Ethereum vs. US Dollar”
As we can see in the H4 chart, after being corrected to the upside by 50.0%, ETHUSD has started a new descending movement. In case this movement transforms into a stable downtrend, the price is expected to break the low at 80.86 and then fall to reach the post-correctional extension area between the retracements of 138.2% and 161.8% at 51.00 and 32.38 respectively.
In the H1 chart, the instrument is falling towards the retracements of 61.8% and 76.0% at 110.88 and 99.83 respectively.
Attention! Forecasts presented in this section only reflect the author’s private opinion and should not be considered as guidance for trading. RoboForex LP bears no responsibility for trading results based on trading recommendations described in these analytical reviews.
EURUSD has reached its upside target at 1.1414; it has formed another consolidation range around this level and broken it upwards. Possibly, the pair may grow with the short-term target at 1.1460. Today, the pair may fall to test 1.1414 from above and then start one more ascending structure to reach 1.1486, thus forming the Double Top pattern.
GBPUSD, “Great Britain Pound vs US Dollar”
GBPUSD is still consolidating around 1.2640 without any particular direction. Possibly, today the pair may trade downwards to reach 1.2590 and then expand the range towards 1.2750. Later, the market may form a new descending structure with the target at 1.2640.
USDCHF, “US Dollar vs Swiss Franc”
USDCHF hasn’t been able to fix above 0.9900; right now, it is moving downwards and has already reached the short-term target at 0.9840. Possibly, today the pair may grow to test 0.9900 from below and then form a new descending structure towards 0.9828. After that, the instrument may continue trading inside the uptrend to return to 0.9900.
USDJPY, “US Dollar vs Japanese Yen”
USDJPY is consolidating around 110.84. Today, the pair may fall towards 110.31 and then grow to reach 110.84. If later the instrument breaks this range to the downside, the pair may resume trading inside the downtrend with the target at 107.70; if to the upside – start a new correction towards 112.12.
AUDUSD, “Australian Dollar vs US Dollar”
AUDUSD has expanded the consolidation range downwards, but right now it is trading in its center. If later the instrument breaks this range to the upside, the pair may be corrected with the target at 0.7200; if to the downside – resume trading inside the downtrend towards 0.7000.
USDRUB, “US Dollar vs Russian Ruble”
USDRUB is still trading upwards. Possibly, the pair may expand the range towards 69.80. Later, the market may fall to break 68.50 and then continue the correction with the target at 67.20.
XAUUSD, “Gold vs US Dollar”
Gold is consolidating at the top; it has been supported by 1271.71 and may continue growing towards 1281.00. After that, the instrument may resume falling to return to 1271.71. If the price breaks this level downwards, the market may continue falling with the first target at 1255.00.
BRENT
Brent has completed another descending structure at 52.80. Possibly, today the pair may form one more ascending structure with the first target at 55.65 and then start a new correction towards 52.85. After that, the instrument may resume growing with the short-term target at 61.00.
Attention! Forecasts presented in this section only reflect the author’s private opinion and should not be considered as guidance for trading. RoboForex LP bears no responsibility for trading results based on trading recommendations described in these analytical reviews.
During the last two days of trading, the USD weakened against the basket of major currencies. The EUR/USD quotes grew by 100 points. The currency is under pressure due to renewed trading disputes between the US and China, a political ambiguousness in the White House and weak economic reports. The Consumer Trust Index for December lowered to 128.1 instead of expected 133.7. The positions should be opened from the key levels of 1.14300 and 1.14650. The trading instrument has a potential for further growth.
The Economic News Feed for 28.12.2018:
– Unfinished Real Estate Sales Index (US) – 17:00 (GMT+2:00);
The price has fixed above 50 MA and 200 MA which points toward the power of the buyers.
The MACD histogram is in the positive zone and above the signal line, which gives a strong signal towards the purchase of EUR/USD.
The Stochastic Oscillator is in the neutral zone, the %K line is crossing the %D line. There are no signals at the moment.
Trading recommendations
Support levels: 1.14300, 1.14000, 1.13600
Resistance levels: 1.14650, 1.14850, 1.15000
If the price fixes above the resistance level of 1.14650 expect further growth of the EUR/USD toward 1.14850-1.15000.
Alternatively the quotes can descend toward 1.14200-1.14000.
The GBP/USD currency pair
Technical indicators of the currency pair:
Prev Open: 1.26311
Open: 1.26425
% chg. over the last day: +0.09
Day’s range: 1.26390 – 1.26721
52 wk range: 1.2477 – 1.4378
The GBP remains in a long flat. There is no single defined trend. The financial market participants are waiting for additional drivers. You should open positions from the key levels of 1.26300 and 1.26700, as well as keep an eye on the real estate market in the US.
The Economic News Feed for 28.12.2018 is calm.
The indicators do not provide precise signals, the price has crossed 50 MA and 200 MA.
The MACD histogram is close to 0.
The Stochastic Oscillator is near the neutral zone, the %K line is below the %D line, which points toward a bearish mood.
Trading recommendations
Support levels: 1.26300, 1.26000, 1.25700
Resistance levels: 1.26700, 1.27000, 1.27350
If the price fixes above 1.26700 consider buying GBP/USD. The movement will tend toward 1.27000-1.27350.
Alternatively the quotes can descend toward 1.26000-1.25750.
The USD/CAD currency pair
Technical indicators of the currency pair:
Prev Open: 1.35679
Open: 1.36129
% chg. over the last day: +0.37
Day’s range: 1.36030 – 1.36255
52 wk range: 1.2248 – 1.4132
CAD keeps consolidating, there is no single trend. There is a possibility of a technical correction after a long rally. The key support and resistance levels are 1.35700 and 1.36250. Positions should be opened from these levels. You should keep an eye on the oil quotes dynamic.
The Economic News Feed for 28.12.2018 is calm.
The indicators do not provide precise signals, the price has crossed 50 MA.
The MACD histogram is located close to 0.
The Stochastic Oscillator is in the neutral zone, the %K line is crossing the %D line. There are no signals at the moment.
Trading recommendations
Support levels: 1.35700, 1.35250, 1.34900
Resistance levels: 1.36250, 1.36600
If the price fixes above the resistance level of 1.36250 expect further growth of the USD/CAD quotes. The movement will tend toward 1.36600-1.36800.
Alternatively the quotes can correct toward 1.35600-1.35300.
The USD/JPY currency pair
Technical indicators of the currency pair:
Prev Open: 111.301
Open: 110.983
% chg. over the last day: -0.47
Day’s range: 110.350 – 111.011
52 wk range: 104.56 – 114.56
The USD/JPY is showing an ambiguous technical picture. The trading instrument is moving sidewards as the demand for the safe have currencies growth. The key support and resistance levels are 110.200 and 110.700. You should keep an eye on the US economic news feed and open positions form the key levels.
During the Asian trading session Japan published some ambiguous economic reports.
The price fixed below 50 MA and 200 MA which points toward the power of the sellers.
The MACD histogram moved to the negative zone which points toward the bearish mood.
The Stochastic Oscillator is in the oversold zone, the %K line crosses the %D line. There are no signals at the moment.
Trading recommendations
Support levels: 110.200, 110.000
Resistance levels: 110.700, 111.000, 111.450
If the price fixes above the resistance level of 110.700 expect the quotes to grow toward USD/JPY. The movement will tend toward 111.000-111.400.
Alternatively the quotes can descend toward 110.000-109.800.
The US dollar weakened significantly against a basket of major currencies during yesterday’s trading. It became known that the US President Trump may impose a ban on the use of equipment made by Chinese companies Huawei and ZTE for US companies. Such actions may again escalate trade relations between the United States and China. In light of these events, the demand for safe assets has increased significantly. The dollar index (#DX) closed yesterday in the negative zone (-0.59%).
Weak economic statistics put pressure on the US currency. CB consumer confidence index in December counted to 128.1 and was worse than the expected value of 133.7. Today we recommend paying attention to statistics on the real estate market in the United States.
The “black gold” prices have been recovering. At the moment, futures for the WTI crude oil are close to $46.00 per barrel. At 18:00 (GMT+2:00), a report on crude oil inventories will be published in the United States.
Market Indicators
Yesterday, the bullish sentiment was observed in the US stock market: #SPY (+0.77%), #DIA (+1.11%), #QQQ (+0.39%).
At the moment, the 10-year US government bonds yield is at the level of 2.77-2.78%.
The news feed on 28.12.2018:
– Pending home sales index in the US at 17:00 (GMT+2:00).
RoboForex, an international broker that provides online trading services on different financial markets, has announced a new bonus program, Profit Share Bonus, along with an increased leverage value, up to 1:2000.
Starting today, RoboForex clients will have an opportunity to take advantage of the new bonus called Profit Share when they deposit funds to their accounts. The bonus allows to receive additional 50% of the deposited amount. The distinctive feature of this bonus is proportional distribution of trading results between the Company and clients in case they cancel the bonus during drawdown.
“Profit Share is another step forward to meet our clients’ interests. The new program changes the conditions of how the bonus funds are written off from accounts during drawdown. According to our new scheme, only the bonus amount that is left on the account is written off proportionally, but not the full amount like it was done before. As a result, when clients are in drawdown and cancel the bonus, their own funds are not used to cover the entire bonus amount”, says Denis Golomedov, Chief Marketing Officer at RoboForex, about the new program.
Along with the introduction of the new bonus program, RoboForex has changed the conditions of providing the leverage for its cent and standard accounts. From now on, clients have an opportunity to benefit from the increased leverage value up to 1:2000 for performing trading operations through MetaTrader 4 and MetaTrader 5 platforms.
Denis Golomedov is commenting: “First of all, the increased leverage helps to reduce margin requirements and gives a chance to trade bigger volumes. However, it’s very important to understand that using the increased leverage also involves higher risks, that’s why having excellent skills in risk management is crucially significant”.
About RoboForex
RoboForex Ltd is a company, which delivers brokerage services on a world-wide basis. The broker provides traders, who work on financial markets, with access to its proprietary trading platforms. RoboForex Ltd has the brokerage license IFSC/60/271/TS.
Bitcoin is a cryptocurrency, a type of electronic cash that was formed in 2008. In 2009, Satoshi Nakamoto wrote a paper title Bitcoin: A peer-to-Peer Electronic Cash System. In 2009, Nakamoto mined the first Bitcoin blockchain, the genesis block. Thus, started the wild ride that is Bitcoin. The volatility of Bitcoin is well-known to investors. Despite its volatility, more and more people have been using and investing in Bitcoin. And a few opportunistic scammers have taken advantage of this.
Scammers love Bitcoin because it is largely unregulated. Not a lot of people truly understand Bitcoin. It is also quite anonymous. Bitcoin has reportedly also been used in the black market because of these reasons.
Due to the prevalence of scams in Bitcoin, a lot of people have lost tens, or hundreds of thousands of dollars. Some even lost millions to these scams. Below are a few of the more prevalent, recent Bitcoin schemes along with some tips on how to avoid them.
Ponzi Schemes
One good example that comes to mind when talking about Ponzi schemes in Bitcoin is MiningMax. MiningMax managed to con its investors out of $200 million before its affiliates reported their scam which led to the arrest of 14 fraudsters. They applied the pyramid scheme by asking people to invest $3,200 in return for promised daily ROIs and a $200 referral commission for every personally recruited investor.
How to avoid:
If it seems like it’s too good to be true, it probably is. Research about the company and its promises. And always check if the company is a registered corporation.
Fake Cryptocurrencies
Scammers like presenting a new cryptocurrency as Bitcoin alternatives. The most common line of thinking that they push on their victims is that it’s too late to get your money’s worth if you invest in Bitcoin. So why not invest in a new cryptocurrency. In early 2018, My Big Coin conned $6 million out of their investors and used the money to line their own personal bank accounts.
How to avoid:
If you’re not familiar with the new cryptocurrency, might as well avoid it. Remember that Bitcoin is unregulated, meaning there is no government or asset that backs its value. A Bitcoin is only worth what other people are willing to pay for it. If you really feel like you want to try out a new, lesser known and less expensive type of cryptocurrency, never invest more that you are willing to lose.
Malware
A hacker’s favorite tool can now be used to hack into your Bitcoin wallet. Hackers can use malware to gain access to your wallet and drain your money. These insidious programs can be attached to an email message, or on websites, and social media.
How to avoid:
Do not open suspicious looking emails. Do not download programs that promise to let you mine bitcoins after the programs have been downloaded. Use “cold” wallets or offline wallets.
Fake ICOs
ICO (initial coin offerings) have been used by scammers to con people out of their investments. ICOs have been used as a way for companies to raise capital. With the rise of the number of companies entering the market, ICO has proved useful for investors in choosing and backing their favorite companies. However, scammers and fraudsters have been known to use fake websites that resemble ICOs, asking their investors to deposit coins in faulty wallets. One example is Centra Tech, a blockchain company that was backed by celebrities like DJ Khaled. Centra Tech was sued for misleading investors and lying about their products.
How to avoid:
Do your research. Dig into the blockchain company you are planning to back. Do not let celebrity endorsements sway you. If you really want to invest in Bitcoin, go with the bigger, more trusted companies instead.
There is no one sure fire way to avoid Bitcoin scams. However, a good rule of thumb is to always do your research: red flags to look out for, recent scams, market trends.
None of the content onHoganinjury.comis legal advice nor is it a replacement for advice from a certified lawyer. Please consult a legal professional for further information.