EUR has recovered the majority of the losses after a sharp descend on Wednesday. At the moment the quotes are consolidating at 1.13800-1.14100, you should open positions from these levels. The investors are waiting for the US labour report for December. Keep in mind that the forecasted and real values can be different.
The Economic News Feed for 04.01.2019:
– Labour Market Report (GER) – 10:55 (GMT+2:00);
– Consumer Price Index (EU) – 12:00 (GMT+2:00);
– Labour Market Report (US) – 15:30 (GMT+2:00);
You should also keep an eye on the statements by the head of Federal Reserve.
Indicators do not provide precise signals, the price has crossed 50 MA and 200 MA.
The MACD histogram is in the positive zone, but below the signal line, which gives a weak signal to buy EUR/USD.
The Stochastic Oscillator is in the neutral zone, the %K line is crossing the %D line. There are no signals at the moment.
Trading recommendations
Support levels: 1.13800, 1.13450, 1.13100
Resistance levels: 1.14100, 1.14350, 1.14650
If the price fixes below the mirror support of 1.13800, expect the quotes to fall toward 1.13500-1.13200
Alternatively the quotes can correct toward 1.14500-1.14700.
The GBP/USD currency pair
Technical indicators of the currency pair:
Prev Open: 1.25984
Open: 1.26211
% chg. over the last day: +0.89
Day’s range: 1.26156 – 1.26572
52 wk range: 1.2438 – 1.4378
The pound has started to recover after a sharp downfall before. The financial market participants are waiting for fresh news regarding Brexit. The GBP/USD quotes are consolidating. The key trading range is 1.26000-1.26500, you should open positions from these levels. Keep an eye on the US Labour Market report.
At 11:30 (GMT+2:00) the UK will publish the Service PMI.
The indicators do not provide precise signals, the price has crossed 50 MA and 200 MA.
The MACD histogram is in the positive zone and keeps rising, which points toward a bullish sentiment.
The Stochastic Oscillator is in the neutral zone, the %K line is crossing the %D line. There are no precise signals.
Trading recommendations
Support levels: 1.26000, 1.25400, 1.25000
Resistance levels: 1.26500, 1.27000, 1.27350
If the price fixes above 1.26500, expect the further correction of the GBP/USD toward 1.27000-1.27400.
Alternatively the quotes can correct toward 1.25500-1.25000.
The USD/CAD currency pair
Technical indicators of the currency pair:
Prev Open: 1.35840
Open: 1.34850
% chg. over the last day: -1.14
Day’s range: 1.34449 – 1.34956
52 wk range: 1.2248 – 1.3664
USD/CAD is showing an aggressive sell-off. During the last two days, the quotes have fallen by 130 points. The CAD has updated the local minimums despite being supported by the positive oil quotes trend. The key range is 1.34450-1.34850, you should open the positions from these levels. The currency pair has prospects for further descend, based on the Labour Market reports for US and Canada.
At 15:30 (GMT+2:00) Canada will publish the Labour Market report.
The price fixed below 50 MA and 200 MA which indicates the power of the sellers.
The MACD histogram is in the negative zone, but above the signal line, which gives a weak signal to sell USD/CAD.
The Stochastic Oscillator is around the oversold zone, the %K line is below the %D line, which also indicates a bearish sentiment.
Trading recommendations
Support levels: 1.34450, 1.34000
Resistance levels: 1.34850, 1.35250, 1.35700
If the price fixes below 1.34450, expect the quotes to fall further toward 1.34000.
Alternatively the quotes can rise toward 1.35000-1.35250.
The USD/JPY currency pair
Technical indicators of the currency pair:
Prev Open: 108.863
Open: 107.649
% chg. over the last day: +0.38
Day’s range: 107.512 – 108.445
52 wk range: 104.56 – 114.56
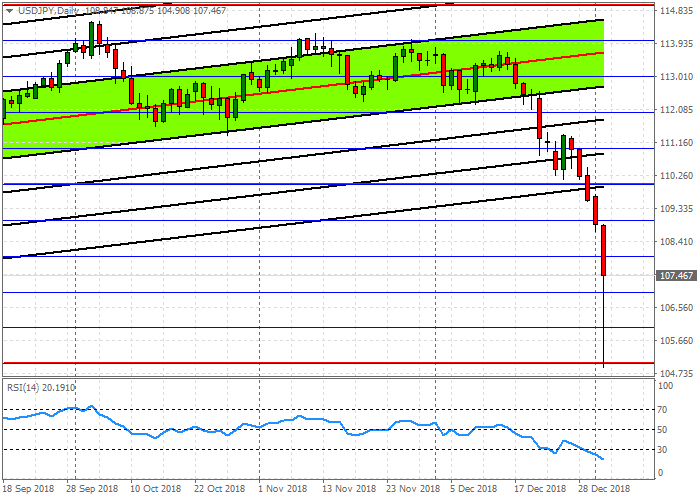
The USD/JPY currency pair is consolidating after a long fall. There is no defined trend. The key support and resistance levels are 107.400-108.400. A tecnical correction is possible soon. The US labour market report is in the spotlight.
The Economic News Feed for 04.01.2019 is calm.
The indicators do not provide precise signals, the price has crossed 50 MA.
The MACD histogram is close to 0.
The Stochastic Oscillator is in the neutral zone, the %K line is below the %D line, which points toward the fall of the USD/JPY quotes.
Trading recommendations
Support levels: 107.400, 106.500, 106.00
Resistance levels: 108.400, 109.000, 109.500
If the price fixes above 108.400, expect the quotes to correct toward 109.000-109.500.
Alternatively, the quotes can fall toward 107.000-106.500.
Oil prices regained more ground on Wednesday, pushed higher after equity markets rebounded from an initial selloff at the start of 2019 trading.
The price gains are not entirely convincing. WTI and Brent posted strong gains, each up more than 3 percent by midday in New York, but come largely after U.S. equity markets shook off an earlier bout of pessimism.
In fact, the trajectory and health of the global economy has moved to the top of the list in terms of variables exerting influence on oil prices. On any given day, stock prices offer a clue into investor sentiment in this regard. “Energy markets are following lockstep with what the equity markets are doing here, and I think that’s going to continue to be the case,” Brian LaRose at ICAP Technical Analysis, told Reuters.
There were not a ton of new indicators to offer further insight into what to expect in early 2019. The most recent piece of data came from China’s factory activity, which showed a contraction in December for the first time in two years – not exactly a positive signal.
“The manufacturing survey data out of China this week is particularly negative for crude oil, as it goes to the heart of the key demand center for the market,” said John Kilduff, a partner at Again Capital Management, according to Reuters.
On the other hand, just a few days ago, President Trump and Chinese President Xi Jingping apparently had a lengthy phone conversation in which they made progress on the trade front. Xi told Trump in a that he had “hopes that both teams can meet each other halfway and reach an agreement beneficial to both countries and the world as early as possible,” according to Xinhua. Trump followed that up in a tweet, stating that a “deal is moving along very well,” one that covers all subjects. “Big progress being made!” Trump said.
A thaw in the trade war could relieve one of the global economy’s major headwinds for 2019.
Oil traders also took heart in news that Saudi Arabia is following through on major oil export reductions. In December, Saudi Arabia slashed oil exports by roughly 500,000 bpd, according to Bloomberg. However, it could be some time before these cuts show up in the inventory data.
“Inventory draws as a result of cuts by OPEC+ may not be so easily visible for a while but avoiding a steep inventory increase in H1 2019 is what the market needs to see,” Bjarne Schieldrop, chief commodities analyst at SEB, said in a statement. There will be a several-month lag before the OPEC+ cuts start to be felt by the market. Oil producers have to first lower output, then there will be a corresponding effect on inventories.
However, the cuts may not be large enough to induce large reductions in storage levels. Instead, inventories may merely “stabilise,” Schieldrop said. On top of that, the IEA reports OECD inventory data on a two-month lag, so data for January won’t be available until March. However, one month’s worth of data may not tell us much, so the market may have to wait until April or May to get a sense of how the OPEC+ cuts are affecting the global supply balance.
Still, the cuts could put a floor beneath oil prices. “A bottoming for the oil price during Q1 2019 seems like a fair bet with higher oil prices thereafter,” Schieldrop said.
There will also be a lag in terms of a potential shale drilling slowdown in response to lower prices. During the last downturn, the reaction from the rig count data came at least six weeks after major oil price movements. As such, the recent meltdown in oil prices, which began back in October, may only now start to show up in the weekly rig counts.
At the same time, the EIA just released monthly U.S. oil production data, showing a jump in output in October to 11.537 million barrels per day (mb/d), up from 11.458 mb/d a month earlier. It was another solid increase in output, although to be sure, it was a fraction of the monthly increases for much of 2018.
Oil traders are still awaiting more definitive clues about the supply/demand balance, but volatility is likely to stick around for a while. In the short run, oil prices will likely follow global stock markets up or down on any given day until the fundamentals reveal a more discernable pattern.
The US dollar weakened against a basket of major currencies after the publication of ambiguous data. Thus, the ADP nonfarm employment change counted to 217K in December and was better than the forecasted value of 179K, while the previous data were revised downward from 179K to 157K. However, the initial jobless claims rose to 231K, while investors expected 220K. The ISM manufacturing PMI counted to 54.1 in December and was worse than the expected value of 57.7. The dollar index (#DX) closed yesterday in the negative zone (-0.60%).
The British pound recovered a significant part of the losses. At the same time, the UK currency is still under pressure. The economic activity index in the construction sector counted to 52.8 in December and was worse than the forecasted value of 52.9. Also, investors are closely monitoring the situation concerning Brexit. It became known that the European Union did not plan to hold new negotiations or change the agreement on the exit of Great Britain from the EU. The European Commission believes that they have proposed the best and only possible agreement on Brexit.
The “black gold” prices have been growing. At the moment, futures for the WTI crude oil are testing the mark of $47.85 per barrel. At 18:00 (GMT+2:00), a report on the US crude oil inventories will be published.
Market Indicators
Yesterday, aggressive sales were observed in the US stock market: #SPY (-2.39%), #DIA (-2.85%), #QQQ (-3.27%).
The 10-year US government bonds yield continues to show negative dynamics. Currently, the indicator is at the level of 2.57-2.58%.
The news feed on 04.01.2019:
– German unemployment change at 10:55 (GMT+2:00); – The index of economic activity in the UK services sector at 11:30 (GMT+2:00); – The consumer price index in the Eurozone at 12:00 (GMT+2:00); – Data on the US labor market at 15:30 (GMT+2:00); – Data on the labor market in Canada at 15:30 (GMT+2:00).
For anyone who dreams of starting their own business, the fact that 50 percent of new businesses fail in the first few years is a scary thought.
Of course, no one starts hoping to be one of the many that doesn’t work, but the reality is that too many aspiring entrepreneurs have high hopes of the sparkling Silicon Valley office space, world recognition and products that change the world.
You may have thought of a business idea that you believe will make you a lot of money. However, there are several aspects that you need to consider before you can realize your dreams. Starting a business may seem like a very daunting prospect at the start, but you need to break the process into smaller steps to ensure your business idea is successful.
With that in mind, below is a step-by-step guide to follow to manage your small business with guaranteed success.
Market research
Before you really know if there is a long term plan for your business, you need to do market research to ensure that the money spent in your business settings is not in vain. You need to determine if there is a market for your business because many of the best ideas fail in the first few stages because the research aspects are completely ignored.
There are many research strategies you can consider. These include:
Primary: To be carried out yourself
Secondary: Has already been carried out by other people
Quantities: Based on numbers and statistics
Qualitative: Based on opinions
Create a business plan
After your market research is successfully carried out, you need to make a business plan to determine how you will spend your finances and the direction you want for your business. A business plan is a vital requirement for every new entrepreneur. To resolve possible difficulties and how this can be changed before money is invested.
Choose a business name
The name of your business is what basically makes you stand out from a difficult crowd, so producing something truly unique must enable you to become a real competitor in your field to new customers.
Logo design
Logos are often the first aspect that customers see from your brand, so the logo needs to attract attention and look attractive. Before you can create a logo, you must consider your entire brand and what your company represents.
Buy the necessary equipment
No matter what business you want to have, there are always some important tools that you need to make sure your company’s daily operations are as smooth as possible.
Some types of machines may be the difference between a stress free work life and total chaos. For example, every business must have a diesel generator to act if there is a loss of electricity.
Location
There are many aspects that you need to consider when choosing a location that is suitable for your business. Of course, this will all depend on the nature of your business; whether it’s in industry, office work or retail.
So if you want to start a new business while learning how to make more — there’s no better time than now.
The EUR/USD currency pair saw a massive sell-off yesterday. The quotes fell by 100 points. The investors are worried about the slowdown in the world economic growth, as well as the ambiguousness at the financial markets. The EUR is consolidating at 1.13450 and 1.13750 and can descend further.
The Economic News Feed for 03.01.2019:
– ADP’s Preliminary Labour Market Report (US) – 15:15 (GMT+2:00);
– ISM’s Industrial PMI (US) – 17:00 (GMT+2:00);
The indicators do not provide precise signals: 50 MA is crossing 200 MA.
The MACD histogram is in the negative zone but above the signal line, which gives a weak signal towards the EUR/USD sale.
The Stochastic Oscillator is around the overbought zone, the %K line is crossing the %D line. There are no signals at the moment.
Trading recommendations
Support levels: 1.13450, 1.13100
Resistance levels: 1.13750, 1.14000, 1.14250
If the price fixes above 1.13750 expect further correction toward 1.14000-1.14250.
Alternatively, the price can descend further toward 1.13250-1.13000
The GBP/USD currency pair
Technical indicators of the currency pair:
Prev Open: 1.27172
Open: 1.25984
% chg. over the last day: -1.85
Day’s range: 1.24291 – 1.26014
52 wk range: 1.2438 – 1.4378
GBP/USD is in the middle of an aggressive sell-off. The pound updated the key minimums. The market participants are worried about the Brexit ambiguousness. The GBP/USD quotes are consolidating at 1.25300 and 1.25800. Positions should be opened from the key levels.
At 11:30 (GMT +2:00) the UK will publish the Construction PMI.
The price fixed below 50 MA and 200 MA which points toward the power of the buyers.
The MACD histogram is in the negative zone, but above the signal line which gives a weak signal to sell GBP/USD.
The Stochastic Oscillator is in the neutral zone, the %K line is crossing the %D line. There are no signals at the moment.
Trading recommendations
Support levels: 1.25300, 1.24600
Resistance levels: 1.25800, 1.26250, 1.26800
If the price fixes above 1.25800, expect the currency pair to recover toward 1.26250-1.26500.
Alternatively the quotes can fall toward 1.24300-1.24600.
The USD/CAD currency pair
Technical indicators of the currency pair:
Prev Open: 1.36157
Open: 1.35840
% chg. over the last day: -0.15
Day’s range: 1.35764 – 1.36544
52 wk range: 1.2248 – 1.3664
USD/CAD remains in a long flat without a single defined tendency. You should open positions from the key levels of 1.36000 and 1.36400. A technical correction is possible soon. You should keep an eye on the US economic reports.
The Economic News Feed for 03.01.2019 is calm.
There are no precise signals, the price has crossed 50 MA.
The MACD histogram is close to 0.
The Stochastic Oscillator is in the neutral zone, the %K line is below the %D line, which points toward a bearish sentiment.
Trading recommendations
Support levels: 1.36000, 1.35700, 1.35250
Resistance levels: 1.36400, 1.36600, 1.37000
If the price fixes below 1.36000 the currency pair will correct toward 1.35700-1.35500.
Alternatively the quotes can grow toward 1.36500-1.36750.
The USD/JPY currency pair
Technical indicators of the currency pair:
Prev Open: 109.645
Open: 108.863
% chg. over the last day: -2.08
Day’s range: 104.905 – 108.899
52 wk range: 104.56 – 114.56
The demand for the safe-haven currencies keeps growing. The financial market participants are worried about the world economy. During the Asian trading sessions USD/JPY updated the key minimums and is consolidating at 107.000-107.850. Positions should be opened from these levels. A technical correction is possible soon.
The Japanese financial markets are closed due to the holiday season.
The price fixed below 50 MA and 200 MA which points toward the power of the buyers.
The MACD histogram is in the negative zone but above the signal line, which gives a weak signal toward the sale of USD/JPY.
The Stochastic Oscillator is in the neutral zone, the %K line is above the %D line, which points toward the USD/JPY recovery.
Trading recommendations
Support levels: 107.000, 106.500, 105.250
Resistance levels: 107.850, 109.000, 109.500
If the price fixes above the local resistance of 107.850 expect further correction of USD/JPY toward 108.500-108.750.
Alternative ly the quotes can descend further toward 106.500-106.000.
The US dollar strengthened significantly against the euro, the pound and a number of commodity currencies amid low trading volumes during the holidays. The dollar index (#DX) closed yesterday in the positive zone (+0.72%). The demand for safe-haven currency has grown significantly. Financial markets participants are concerned about the slowdown in global economic growth, as well as uncertainty in financial markets.
China published weak data on economic activity in the manufacturing sector of the country. Also, investors expect information on how soon the US government will work again. It should be recalled that the work of the US government was suspended at the insistence of the US President Donald Trump, who demanded to start building a wall on the border with Mexico.
The British pound weakened against the US dollar due to concerns about Brexit. In the British Parliament, there are still disagreements regarding the terms of the Brexit deal on the Irish border. By the end of January, a vote on the bill offered by Theresa May should take place.
The “black gold” prices slightly decreased after a sharp rally the day before. At the moment, futures for the WTI crude oil are testing the mark of $45.75 per barrel.
Market Indicators
Yesterday, major US stock indices closed in the positive zone: #SPY (+0.10%), #DIA (+0.07%), #QQQ (+0.40%).
Currently, the 10-year US government bonds yield is at the level of 2.62-2.63%.
The news feed on 03.01.2019:
– The index of economic activity in the UK construction sector at 11:30 (GMT+2:00); – ADP nonfarm employment change in the US at 15:15 (GMT+2:00); – Initial jobless claims in the US at 15:30 (GMT+2:00); – ISM manufacturing PMI in the US at 17:00 (GMT+2:00).
The Japanese Yen rose extremely sharply in the currency markets today with ‘flash crash’-like movements that brought the USDJPY exchange rate under the 105.00 level. The markets were clearly affected by Apple’s sales warning that revenue would be coming in less than expected and prompted worries about China’s economy.
The news hit risky currencies like the Australian dollar hard while the Japanese yen, usually a beneficiary of demand when the markets become stressed, spiked in strength. The US dollar (USDJPY) fell to the lowest level since March 2018 against the yen while the Euro (EURJPY) dropped to the lowest level since April of 2017 vs the yen.
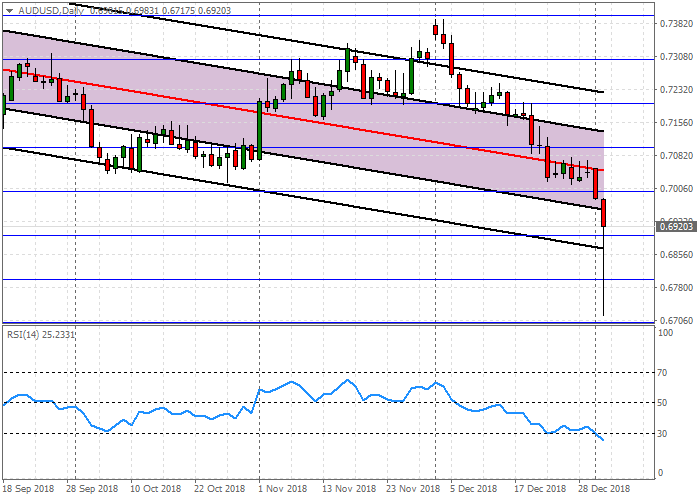
The risk-off moves pulled the Australian dollar down against the US dollar as well.
EUR/USD has a bullish sentiment. The EUR/USD quotes are consolidating around 1.14850-1.15000. 1.14600 acts as a mirror support. EUR has prospects for further growth. Investors are expecting an array of reports regarding the EU. You should open positions from the key levels.
At 10:55 (GMT+2:00) Germany will publish the Industrial PMI.
The price fixed above 50 MA and 200 MA which points toward the power of the buyers.
The MACD hystogram is in the positive zone and above the signal line, which gives a strong signal to purchase EUR/USD.
The Stochastic Oscillator is in the neutral zone, the %K line is above the %D line which also points toward the growth of EUR/USD.
Trading recommendations
Support levels: 1.14600, 1.14250, 1.14000
Resistance levels: 1.14850, 1.15000, 1.15400
If the price fixes above 1.14850, expect further growth of the EUR/USD quotes. The movement will tend toward 1.15250-1.15400.
Alternatively the currency pair can descend toward 1.14300-1.14000.
The GBP/USD currency pair
Technical indicators of the currency pair:
Prev Open: 1.26916
Open: 1.27172
% chg. over the last day: +0.28
Day’s range: 1.27100 – 1.27727
52 wk range: 1.2477 – 1.4378
GBP/USD is consolidating after a sudden growth during the current week. The pound is testing the key support and resistance levels: 1.27350 and 1.27700. The trading instrument has prospects for further recovery. We expect important stats on the UK economy. Positions should be opened from the key levels.
At 11:30 (GMT+2:00) the UK will publish a report on the business activity in the industrial sector.
The price fixed above 50 MA and 200 MA which points toward the power of the buyers.
The MACD hystogram is in the positive zone but below the signal line, which gives a weak signal to purchase EUR/USD.
The Stochastic Oscillator is in the neutral zone, the %K line is crossing the %D line. There are no signals at the moment.
Trading recommendations
Support levels: 1.27350, 1.27000, 1.26700
Resistance levels: 1.27700, 1.28000
If the price fixes above 1.27700, expect further growth of the EUR/USD quotes. The movement will tend toward 1.28000-1.28300.
Alternatively the currency pair can descend toward 1.27000.
The USD/CAD currency pair
Technical indicators of the currency pair:
Prev Open: 1.36380
Open: 1.36157
% chg. over the last day: -0.11
Day’s range: 1.35691 – 1.36559
52 wk range: 1.2248 – 1.3664
USD/CAD started to descend. At the moment CAD is consolidating at 1.35700-1.36200. A technical correction is highly probable. You should open positions from the key levels while keeping an eye on the oil quotes.
The Economic News Feed for 02.01.2019 is calm.
Indicators do not provide precise signals, the price fixes between 50 MA and 200 MA.
The MACD histogram started to descend, which points toward the power of the sellers.
The Stochastic Oscillator is in the neutral zone, the %K line started the cross the %D line. There are no signals at the moment.
Trading recommendations
Support levels: 1.35700, 1.35250, 1.34900
Resistance levels: 1.36200, 1.36600
If the price fixes below the 1.35700 expect the USD/CAD correction toward 1.35300-1.35000.
Alternatively the quotes can grow toward 1.36600.
The USD/JPY currency pair
Technical indicators of the currency pair:
Prev Open: 110.188
Open: 109.645
% chg. over the last day: -0.68
Day’s range: 109.050 – 109.724
52 wk range: 104.56 – 114.56
USD/JPY keeps showing a negative trend. Since the beginning of the week USD/JPY fell by 100 points. The currency pair is close to the round 109.000 with 109.550 acting as the closest resistance. Positions should be opened from the key levels. You should keep an eye on the US Treasury bonds yield dynamics.
Japanese financial markets are closed due to the New Year celebrations.
The price fixed below 50 MA and 200 MA which points toward the power of the sellers.
The MACD histogram is in the negative zone and below the signal line, which gives a strong signal to sell USD/JPY.
The Stochastic Oscillator is near the oversold zone, the %K line started to cross the %D line. There are no signals at the moment.
Trading recommendations
Support levels: 109.000, 108.500
Resistance levels: 109.550, 110.200, 110.700
If the price fixes below 109.000, expect the quotes to fall further toward 108.600-108.400.
Alternatively, the currency pair can correct toward 110.000-110.200.
Trading activity and volatility on currency majors decreased due to the New Year holidays. At the moment, the dollar index (#DX) is declining. A report on the US labor market for December will be the key event in the current trading week. Experts expect improvements in key indicators. We recommend taking into account the difference between the actual and forecasted values.
In December, China Caixin Manufacturing PMI slowed down from 50.2 to 49.7. Economists forecasted growth to 50.3. Today, financial market participants will assess indicators of economic activity in the Eurozone and the UK.
The bearish sentiment still prevails in the “black gold” market. At the moment, futures for the WTI crude oil are testing the mark of $44.85 per barrel.
Market Indicators
Yesterday, the main financial markets were closed due to the New Year holidays.
The 10-year US government bonds yield shows negative dynamics. Currently, the indicator is at the level of 2.69-2.70%.
The economic calendar on 02.01.2019:
– The index of economic activity in the manufacturing sector in Germany at 10:55 (GMT+2:00); – The index of economic activity in the UK manufacturing sector at 11:30 (GMT+2:00).
As we near the end of 2018 and have recently witnessed an incredible price rotation in the US stock market, it is time for traders to take stock of the incredible opportunities that are set up for early 2019 and beyond. Our research team, at www.TheTechnicalTraders.com, has put together some truly incredible longer-term Adaptive Dynamic Learning (ADL) predictive price modeling system charts that will help you understand and identify incredible opportunities that should play out in early 2019. We know you will not find this type of analysis anywhere else on the planet and we know just how valuable these charts are too skilled traders. So, get ready for some incredible moves – as impossible as they may seem.
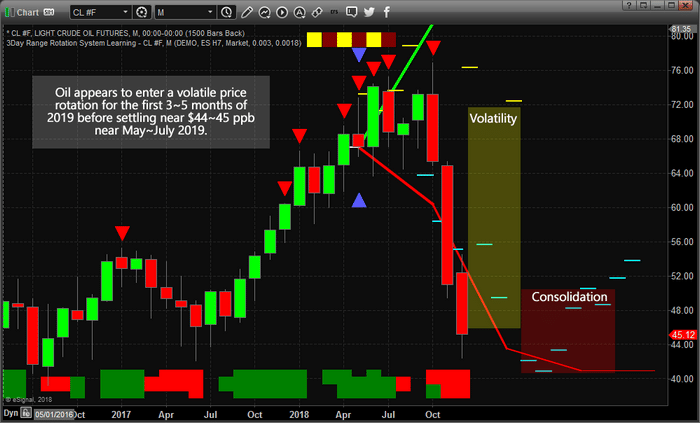
Let’s get started with Crude Oil. This Monthly chart of Crude showing our ADL price modeling system is clearly indicating the first few months of 2019 will include increased price volatility. One thing to pay attention to as we review these charts are the BLUE TRIANGLES, which is where we asked the ADL predictive modeling system for a detailed analysis, and the CYAN, YELLOW, and WHITE DASHED LINES, which is where the ADL system is showing us the highest probability price outcome into the future. On this chart, we can see that the predicted price levels of the past have been relatively close to where the price has closed on each monthly price bar. Going into the future, we can see 3~4 months of price volatility between $50 and $65 (roughly) with rotating higher/lower price objectives. We interpret this as greatly increased price volatility with the potential of supply events disrupting global expectations in oil. These could be intermediate-term price rotations that keep the price within our $50~65 price range, or they could be large range, very dramatic price rotations as a result of massive global supply events.
What we can suggest to you, today, is that early 2019 should provide some very interesting short to intermediate term price triggers in Oil before price settles back below $50 near June or July 2019.
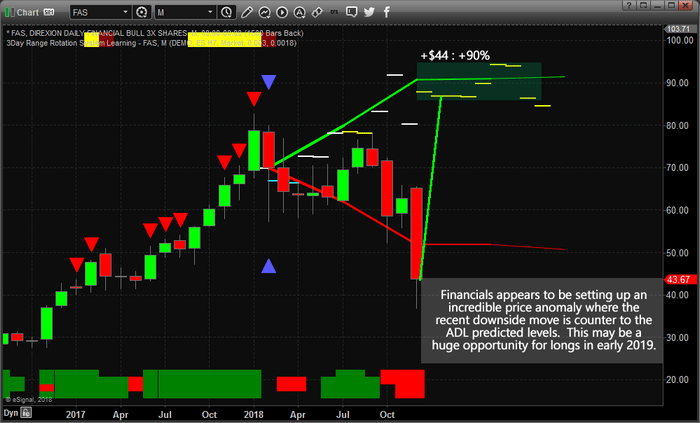
Next, the Financials/Banks appear to be setting up a very deep “price anomaly” pattern that could become one of the biggest price reversals of early 2019. It is not very often that a 90%+ price move sets up in the markets and this could be just such an event. The ADL predictive price modeling system identifies the highest probability price outcomes by mapping and tracking price and technical setups. You can see from this chart we are asking the ADL modeling system to show us what to expect from the February 2018 price bar. This price bar is critical because it was a wide range price rotation setup that should be very unique in the ADL DNA mapping. This bar only had 5 similar DNA markers and projected some of the predicted price level, the ones drawn in WHITE, as 50/50 outcomes. The last few outcomes, drawn in YELLOW, reported as 100% probabilities for these predicted target price levels. Therefore, we consider this a very high probability outcome of a very deep “price anomaly” setup that should result in some incredible upside opportunities for skilled traders.
Additionally, if this analysis is correct, the US stock market may, very quickly, rally to attempt to establish new all-time highs again in early 2019. This move could happen well before May or June 2019. Be prepared for this move because, currently, there are a bunch of shorts that are predicting a 1929 style market crash. Those shorts are going to get crushed in a massive short squeeze if our ADL predictive modeling results are accurate.
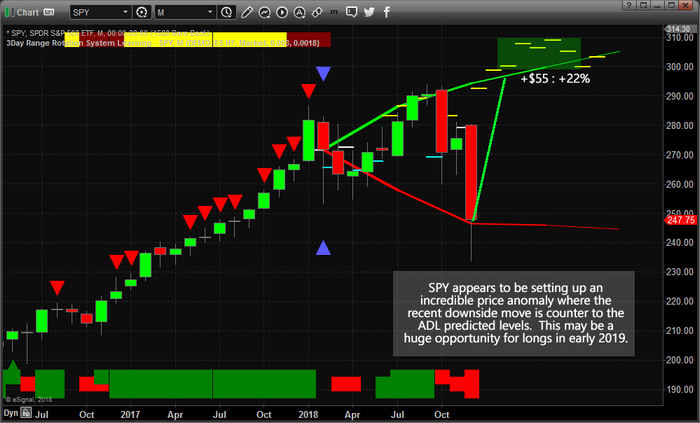
Next, we’ll review the SPY Monthly chart. And, as you can likely see, this chart is similar to the FAS chart above with a very deep price anomaly setup. In fact, you are going to see a few of these types of price anomaly trigger setups in this research post because the very deep downside price move, recently, has prompted these types of price triggers. One thing to consider about price rotation and the recent downside price move is that these types of price swings are very healthy for the overall markets. They act as a method of reconfirming value, support and future expectations by devaluing/deleveraging over-extended price levels and shaking up the markets. We think of these types of moves as a “healthy price rotation” that allows the markets to re-establish value and future expectations vs. a type of crisis event.
In addition to this being a very healthy price rotation, we also believe, fundamentally, very little has changed in the past 4+ months in regards to global market events. Europe and China/Asia are still working through their own issues. Credit cycles and global market valuations have been decreasing since early 2018. Overall, the global markets have decreased in value by over 27% since January 2018. What many traders have failed to understand is that the US markets broke lower on a reaction to the US Fed’s recent rate raises while the rest of the global markets had already experienced a 24% valuation decline. In other words, the US markets broke lower in “capitulation” of expectations that the US Fed may have pushed rates beyond expected boundaries. Now that the US markets have revalued near these recent lows and 2019 is about to start, new expectations are settling into traders minds regarding the current market values and future expectations.
Back to our ADL chart of the SPY, you can see the predicted levels of the ADL system matching with price bars fairly accurately. The current bar, the big red one, is reported as a “neutral probability” (WHITE) target price level which means the ADL system could not determine any viable probability for this price target. The following YELLOW price targets range from 57% probability to 94% probability going out 8+ months. Our interpretation of this is that the current price bar, being a neutral price target near $279.60 reports as a “basis price” in the range of previous price rotation. We believe this level, $279.60, will quickly be recovered in early 2019 before a continued rally pushes prices above $300 sometime near April or May 2019.
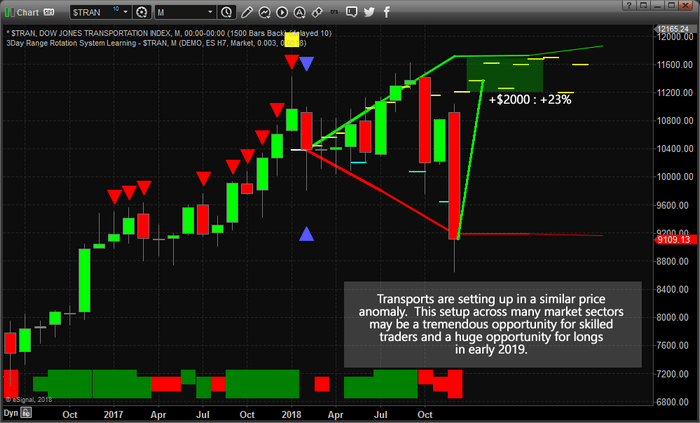
Next, one of our favorite charts to gauge the markets and the future expectations of market sectors, the Transportation Index. And, again, you can see a similar price anomaly setup on this chart. The one thing that is very interesting on this chart is that the current price target level for the December 2018 bar has a relatively high ADL probability (68.373%) and the next targeted price level (Jan 2019, near 11,210) has a very high 88.25% probability. It is our opinion that the Transportation Index will rocket higher in early 2019 and reach levels above 10,800 before the end of March 2019 (possibly much earlier). The ADL predictive modeling system is suggesting that the Transportation Index will stay near 11,500 for much of 2019 and we believe the US stock market and major indexes will reach new all-time highs near the start of Q2 2019 and continue to push a bit higher through the middle of 2019. It is very likely that the US market continues to outperform many other global markets throughout much of 2019 and beyond. We’ve read many expectations that the US markets may fall into some level of “complacency” in 2019, but we are not seeing that in our research. We are seeing the US markets continue to report pricing strength in comparison to other global markets and we believe the US economy will continue to stay strong throughout at least the first 2~3 quarters of 2019 – possibly much longer.
Again, this incredible opportunity for skilled traders is showing a potential +23% upside rally that should start in early 2019. Be prepared for some great trades in 2019.
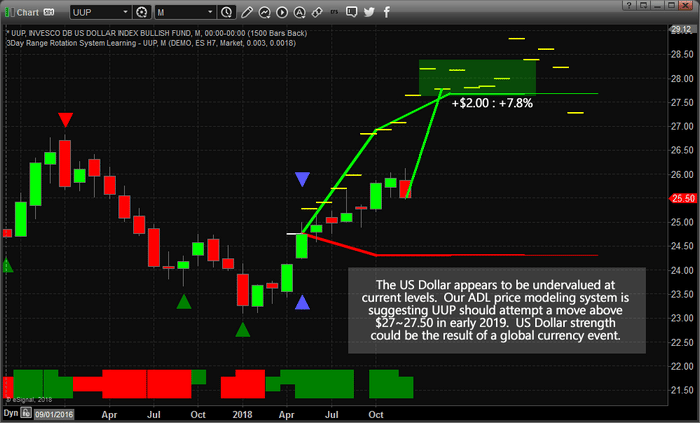
Lastly, the US Dollar. With so many people expecting the US markets to push lower in 2019 and the resulting pressures on the US Dollar (as some analysts expect the Yuan to strengthen while the US Dollar weakens), our ADL predictive modeling systems is suggesting that the US Dollar is currently undervalued by nearly 8%. The early 2019 ADL price targets are near or above $27.50 with the current price being near $25.50. This represents a 7.8% to 8.3% upside price anomaly if our ADL predictive price targets are accurate. This ADL trigger bar, where the BLUE TRIANGLES are on this chart, was a fairly rare price/technical pattern, or DNA marker. It is predicting a 100% probability of these price levels being accurate based on this rare DNA marker. We interpret that outcome as a breakout above $26 in UUP would help to confirm this ADL analysis and the potential that $27.50 to $28.00 is a viable longer-term price objective.
Overall, we don’t see any reason to be bearish the US Dollar at the moment. Our ADL predictive modeling system is suggesting the US Dollar is currently undervalued by about 8% and is predicting early 2019 upside potential which indicates the potential for greater global currency volatility in the Euro, the Yuan, and other widely held currencies. If out ADL predictive pricing levels are accurate, it would indicate that we are going to see global currency pricing pressures hit many global currencies fairly early in 2019. Possibly, this could be related to some geopolitical event or some type of isolated credit market event (Italy, Spain, EU, China, Asia). Again, we don’t know what the event will be, but we can assure you that our ADL predictive modeling system is suggesting the US Dollar will increase in value by about 8% in early 2019.
These incredible setups and opportunities for skilled traders can only be found with our proprietary Adaptive Dynamic Learning (ADL) predictive modeling tool. Call it a New Year’s gift or whatever you want to call it. Within this research article, we’ve shown you what we believe are some of the most incredible trading setups to start 2019 and we’re confident in our model’s ability to accurately find and call these moves. Want to learn what other setups our predictive cycle, Fibonacci and ADL systems are showing us? Want to know what the metals are going to do in 2019? Want to know which sectors are going to move and when? Visit www.TheTechnicalTraders.com to learn how we help our members find and execute better trades. Visit www.TheTechnicalTraders.com/FreeResearch/ to review some of our earlier research posts and to see how we’ve been calling these moves accurately for months.
Want to make 2019 a great year with incredible opportunities for success? Join our other members at www.TheTechnicalTraders.com today and make 2019 an incredibly successful year.