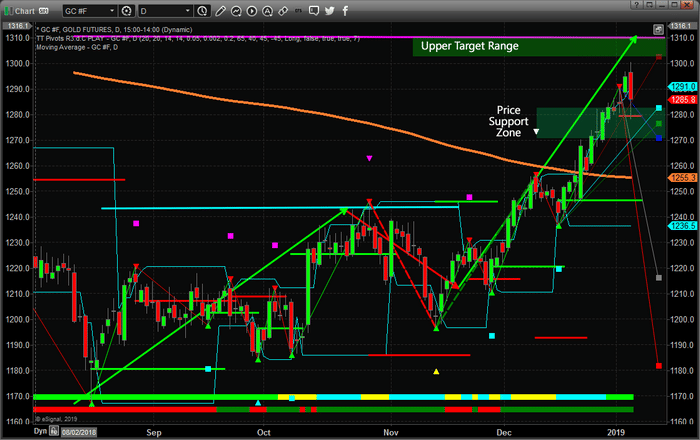
Early trading on January 4, 2019, saw Gold reach just above $1300 per ounce – confirming our price target from our research and posts on November 24, 2018. The importance of this move cannot be under-estimated. Traders and investors need to understand the recent rally in the metals markets are attempting to alert us that FEAR is starting to re-enter the market and that 2019 could start the year off with some extended volatility.
Our research has shown that Gold will likely rotate between $1270~1315 over the next 30~60 days before attempting to begin another rally. Our next upside price target is near $1500. We will continue to post articles to help everyone understand when and how this move will happen. We expect Gold to rotate near the $1300 level for at least another 30 days before attempting another price rally.
Pay attention to the Support Zone on this Daily Gold chart and understand that price rotation is very healthy for the metals markets at this point. A reprieve in this recent Gold rally would allow the start of 2019 to prompt a moderate rally in the US stock market as well as allow a continued capital shift to take place. As capital re-enters the global equities markets, investors will be seeking the best investment opportunities and safest environments for their capital. Our belief is that the US stock market will become the top-tier solution for many of these investments.
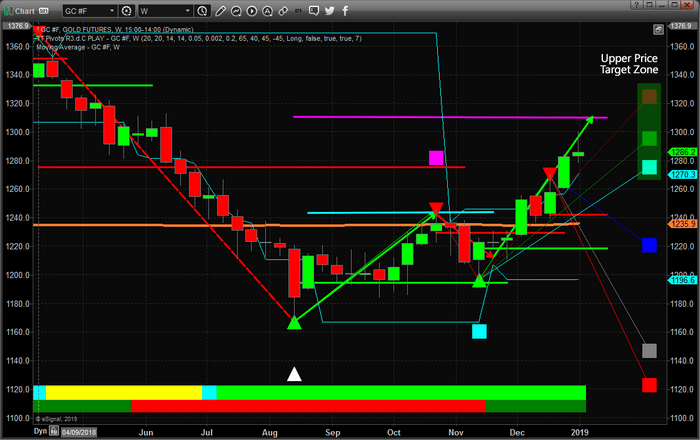
This Weekly Gold chart shows our Adaptive Fibonacci price modeling system and why price rotation is important at this time. The highlighted GREEN Fibonacci price target levels on the right side of this chart are projecting upside price objectives for the move that started near mid-November. We can see that $1325 (or so) is the highest target level and that $1273 to $1288 are the lower levels. This suggests that we have already reached the upper resistance range and a mild price rotation would allow for the price to establish a new fractal low rotation that would establish NEW upside Fibonacci price targets. In other words, we much have some price rotation to support the next leg higher in the Metals markets
If you’ve been following our research and comments on the past 90+ days. You’ll already know that we’ve nailed many of these market moves. The SPY, Natural Gas, Oil, Gold, Small Caps and so many more. We’ve been calling for a massive price bottom in the US stock market since well before the November 6th US Elections. Our proprietary predictive modeling systems called the huge moves in Oil, Natural Gas, Gold/Silver, and many others. If you were not profiting from these moves, then you need to visit www.TheTechnicalTraders.com to learn how we can help you in 2019. Our memberships are very inexpensive and the support we provide you is incredible for skilled traders. Want a team to help you create success in 2019, then visit TheTechnicalTraders.com and get started creating success.
The US dollar weakened against a basket of major currencies after statements by Fed Chairman Jerome Powell. The official said that the US Central Bank would closely monitor the development of the country’s economic situation in the new year and adjust monetary policy by economic statistics. The dollar index (#DX) closed yesterday in the negative zone (-0.51%).
Weak economic reports put additional pressure on the US currency. Thus, the US ISM non-manufacturing PMI counted to 57.6 in December, while experts expected 59.6. Also, two-day negotiations between the US and China have started, which has led to an increase in demand for safe assets. Investors hope that countries will be able to resolve the trade conflict and conclude an agreement.
The “black gold” prices are moderately growing. At the moment, futures for the WTI crude oil are testing the mark of $48.60 a barrel. At 23:30 (GMT+2:00), a report on the API weekly crude oil stock will be published.
Market Indicators
Yesterday, the bullish sentiment was observed in the US stock market: #SPY (+0.79%), #DIA (+0.46%), #QQQ (+1.10%).
The 10-year US government bonds yield is recovering. Currently, the indicator is at the level of 2.69-2.70%.
The news feed on 08.01.2019:
– Statistics on the trade balance in the US at 15:30 (GMT+2:00); – JOLTS job openings in the US at 17:00 (GMT+2:00).
On Monday the 7th of January, trading on the euro closed up. The single currency rose to 1.1483 against the greenback. This was triggered by a general decline on the dollar, which occurred in response to Jerome Powell’s statement that the Fed would halt its rate hike path if it sees the economy slowing down this year.
Trading opened down on Monday. The euro corrected from the 112th to the 45th degree. The pair hit a low of 1.1432 in the Asian session. In my forecast, I expect to see a drop to the trend line at 1.1413.
There’s a lot of economic news coming out today, although as far as I can see, there’s nothing important enough to cause any wild fluctuations on the market. Since the hourly stochastic is in the buy zone, I expect to see the rate recover to 1.1465 before dropping. If we look at the technical picture from the daily timeframe and higher, we can expect the rate to rise to 1.18 by mid-March. If conditions are ideal for buyers, the euro will reach this mark by mid-February.
As global jitters are escalating with economic uncertainty and market volatility, gold looks more attractive. But there’s a big difference between its short- and longer-term prospects.
Those analysts who believe that fear has made a comeback argue that gold is benefiting as equities slide and investors are increasingly concerned about the economic prospects of the U.S., China, Europe and Japan. Yet, even at $1,290, gold still remains more than 30% behind its all-time high of $1,898 in September 2011 amid the U.S. debt-limit crisis.
Although U.S. dollar has not strengthened as much as anticipated, the Fed’s rising rates have contributed to the fall in gold prices. In this view, a reversal may be unlikely because the investor assumption is that the Fed will continue to normalize, though perhaps slower than anticipated.
In the postwar era, such tightening meant a strengthening U.S. economy and a stronger dollar. But at the time, American economy was not haunted by budget and trade deficits or a debt burden. Today, it suffers from both twin deficits and a massive $22 trillion sovereign debt burden.
In this view, the Fed’s normalization may not herald increasing stability, but contribute to instability and mixed signals in the U.S. economy. In that case, rising international uncertainty and volatility is likely to support an upward gold trajectory in the longer term.
Uneasy markets – and gold
Following the burst of the asset bubble in the U.S.(2008), Europe’s debt crisis (2010) and the U.S. debt-limit crisis (2011), markets plunged and gold soared until it peaked at almost $1,900 in September 2011. In the course of the past eight years, these fundamentals have not improved.
As central bankers in major advanced economies resorted to ultra-low interest rates and rounds of quantitative easing, markets tanked along with the oil prices, whereas gold soared. That period prevailed as long as central banks pushed cheap money and bought their multibillion dollar assets, while major advanced economies supported their ailing economies with large fiscal stimulus packages. It was great for gold but bad for equities.
The great reversal began with the Fed’s tightening in 2015, which boosted markets and strengthened the dollar, but penalized gold and oil, which both tanked. This phase accelerated significantly even before the Trump era with the expectation of the new administration’s deregulation, privatization and liberalization. Markets soared, gold lingered.
However, as Trump’s agenda became constrained by the Mueller investigation and investors grew concerned about tariff threats that became effective last summer, the mood became more volatile and the sentiment more uncertain. Today, Dow Jones remains more than 13% below its October peak (Figure).
FigureThe Post-Crisis Decade: Gold and Equities, 2008-Present
Market forces behind upward trajectory
After its all-time high, gold has been seen largely as a weak asset until 2016, when it began to bounce, along with the Fed rate hikes. While it has advanced to $1,290, lingering uncertainty has resulted in fluctuations, which have effectively penalized further gains, yet prevented new plunges.
Market consensus tends to offer habitual reasons for gold’s upward trajectory. First, market volatility and economic uncertainty are back. Even Trump’s erratic tweets favor gold as a hedge against volatility, which boosts gold prices. And equity market volatility, as measured by the VIX, has tripled in just two months, after a long period of perceived calm.
Second, when a solid asset loses almost a third of its value, as gold did between 2011 and 2016, it becomes more cost-efficient. Gold’s average return is now more attractive.
Third, there’s the dollar story. Historically, a rapidly-strengthening dollar, typically boosted by rate hikes, has undermined gold’s gains. However, as the dollar has stabilized since early summer, downward constraints do not work as much against gold.
Finally, gold tends to be constrained by rising real rates (interest rates minus inflation). Since rising rates raise the opportunity costs of an asset that does not generate income, gold was expected to languish as the Fed would hike rates. But if real 10-year yields have peaked, as some argue, real rates may no longer pose a critical constraint to gold’s advances.
Secular strength in long-term
In the long-term, the picture may look different, however. It is the thriving U.S. economy and markets that keeps gold down. But have American fundamentals improved since 2011 debt-limit crisis? After all, today U.S. sovereign debt is twice as large as in 2011. And, according to CAPE (cyclically-adjusted PE ratio), equity valuations are almost twice as high as the historical norm – even amid the government shutdown.
Moreover, U.S. economy is no longer the key driver of global growth prospects; China and other large emerging economies are.
In long term, secular stagnation is set to broaden across the major advanced economies, which cannot be disguised by hyper-aggressive monetary policies, such as ultra-low rates, quantitative easing, or overpriced markets.
That’s one reason why several large emerging economies, which today fuel most of global growth prospects, and major oil exporters, are intrigued by the idea of re-coupling gold with a multilateral currency basket to avoid excessive exposure to U.S. denominated energy and commodity markets.
As China-supported One Belt One Road (OBOR) initiatives advance, U.S. dollar is being effectively sidelined by the yuan and other emerging-country currencies. Moreover, over time the OBOR is also likely to have a substantial impact on the gold market as it takes place in regions rich in mining resources and accounts for a vital share of global gold supply and demand.
Furthermore, there have been interesting shifts in gold reserves. While advanced economies, such as the U.S. and Germany, still own most global gold reserves, the U.S. has increased its gold holdings in the past decade only marginally, while Germany has been forced to cut its reserves. In contrast, China has tripled its reserves, while Russia has nearly quintupled its gold (after dumping billions of U.S. Treasuries), despite rounds of sanctions.
As some 90 percent of the physical demand for gold comes from outside the U.S., mainly from large emerging economies that are also fueling global growth prospects, gold is on the right side of the future.
(Based on an investor briefing on gold prospects amid new international uncertainty)
About the Author:
Dr Dan Steinbock is the founder of Difference Group and has served at the India, China and America Institute (US), Shanghai Institute for International Studies (China) and EU Centre (Singapore). For more, see http://www.differencegroup.net/
Our research team has been nailing the markets moves with our proprietary price modeling tools. Our December 12, 2018 call that Natural Gas would collapse nearly 30% after reaching a price peak was a very bold call. Who would have thought that predictive price modeling could be so accurate and could identify a move like this – or call for what is expected to happen next?
Back when Natural Gas breached the $4.60~4.80 range, our ADL predictive modeling system was suggesting a massive price anomaly was setting up. These types of triggers are becoming more common as volatility in the general markets increases. The ADL system suggested that a massive -30% downside price move would happen before the end of February 2019.
Now, as that trade has completed and our targets have been reached, we are alerting our followers that Natural Gas should begin to consolidate between $2.80 and $3.30 before attempting to rocket back above $4.00 near April or May 2019. Read our original analysis of Natural Gas to learn why these moves provide an incredible opportunity for traders and visit TheTechnicalTraders.com to read up on our early 2019 market predictions.
Join our other members in making 2019 an incredibly successful year. We believe 2019 will provide exceptional opportunities for skilled traders and we’ll be happy to share our proprietary research and analysis with you as a member of Technical Traders Ltd. You really don’t want to miss these moves and this incredible opportunity. Think about it, one trade like this with a -30% selloff followed by a 24% price rally could make your entire year. Imagine being able to find trades like this every week or month for success. Visit TheTechnicalTraders.com and get ready to make 2019 a fantastic year of success no matter if we have a bull market or bear market.
As we can see in the H4 chart, the long-term correctional uptrend continues; it has already reached the retracement of 61.8%. The next upside target may be the retracement of 76.0% at 1316.02. At the same time, there is divergence at MACD, which may indicate a reverse after the price reaches the target. The local support level is at 1238.65.
In the H1 chart, after being corrected to the downside by 23.6%, the pair is trying to start a new impulse to the upside. If the price breaks the high at 1298.47, the instrument may trade towards its mid-term targets. However, if the instrument starts a new descending wave, its targets will be the retracements of 38.2% and 50.0% at 1273.50 and 1265.72 respectively.
USDCHF, “US Dollar vs Swiss Franc”
As we can see in the H4 chart, the correctional downtrend continues; USDCHF has already reached the retracement of 50.0%. In the future, the price may continue falling towards the retracements of 61.8% and 76.0% at 0.9767 and 0.9682 respectively. The local resistance level is at 0.9990; the key one – the high at 1.0128.
In the H1 chart, the pair is trading sideways between the retracement of 38.2% and 50.0%. Breakout of one of the range’s borders will define the future mid-term tendency.
Attention! Forecasts presented in this section only reflect the author’s private opinion and should not be considered as guidance for trading. RoboForex LP bears no responsibility for trading results based on trading recommendations described in these analytical reviews.
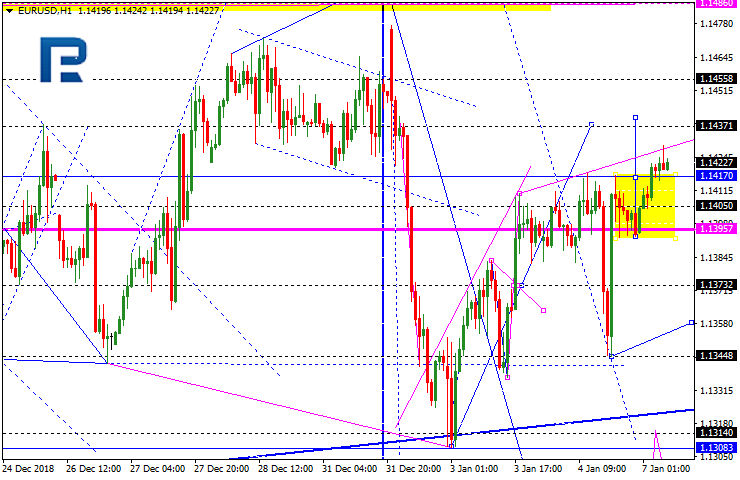
EURUSD has formed another consolidation range above 1.1405; right now, it is trading to break this level upwards. Possibly, the pair may grow with the target at 1.1437. After that, the instrument may form a new consolidation range at the top with a reversal pattern. The first downside target will be at 1.1373.
GBPUSD, “Great Britain Pound vs US Dollar”
GBPUSD has reached its upside target and formed another consolidation range at the top; right now, it is trading upwards and trying to expand the range towards 1.2777. According to the main scenario, the pair may form a reversal pattern at the highs. After breaking 1.2700 to the downside, the market may form a new descending structure with the target at 1.2550.
USDCHF, “US Dollar vs Swiss Franc”
USDCHF has formed another consolidation range above 0.9851; right now, it is trading to break the range downwards. Possibly, today the pair may fall towards 0.9833 and then form one more ascending structure to reach 0.9890. Later, the market may resume falling towards 0.9820 and then start a new growth with the first target at 0.9940.
USDJPY, “US Dollar vs Japanese Yen”
USDJPY has reached its upside target. Today, the pair may fall towards 107.53 and then grow to reach 108.15. After that, the instrument may resume trading inside the downtrend with the target at 106.50.
AUDUSD, “Australian Dollar vs US Dollar”
AUDUSD has completed the ascending wave. Possibly, today the pair may form a new descending structure with the target at 0.6970.
USDRUB, “US Dollar vs Russian Ruble”
USDRUB is trading downwards to reach 67.20. Later, the market may form one more ascending structure towards 68.42 and then resume trading inside the downtrend with the target at 65.60.
XAUUSD, “Gold vs US Dollar”
Gold has finished the descending impulse; right now, it is being corrected towards 1292.31. After that, the instrument may resume falling to break 1277.05 and then continue the third descending wave with the target at 1261.61.
BRENT
Brent is consolidating around 57.29. If later the instrument breaks this range to the upside, the pair may start a new growth towards 60.48; if to the downside – continue the correction to reach 55.00 and then form one more ascending structure with the short-term target at 60.88.
Attention! Forecasts presented in this section only reflect the author’s private opinion and should not be considered as guidance for trading. RoboForex LP bears no responsibility for trading results based on trading recommendations described in these analytical reviews.
The final full week of trading and final ‘the trading week ahead’ for 2018 this week, what a week to finish on – three of the top five largest central banks are meeting for the final time this year and will not meet again until February 2019.
The banks are The Bank of England, the Bank of Japan and the one that will impact markets the most over the coming 12 months the US Federal Reserve. Neither the BoE or BoJ are forecasted to move rates this week, the Fed, however, is, that isn’t what the market is likely to react too; it’s the economic forecasts and the future projections of the Federal Funds rate that will get the USD moving around.s
Over the past two and a half months, perma-bears would have us believe something in the US and the global economy has fundamentally changed – “growth is ending; a recession is coming”.
Their justification for this stance is reflected in this chart The ‘kinked’ curve (the inversion between the 2-year and 5-year bond) – is a strong inflection point recession watchers. It’s the first time in nearly 6 years the 2yr-5yr spread has inverted the last time was the lead up to the Euro crisis – the idea is recession risk is coming.
The larger recession indicator, however, is the 2yr and 10yr spread inversion when this inverts a recession is coming according to history. Over the past 40 years, every time the 2-10yr inverts a US recession precedes it in the coming 18 months.
Note; however, the 2-10 hasn’t inverted yet but at 15 basis points it’s so close you can touch it and a further 25 basis point rise on Thursday could push the spread over the line.
That does beg the question, will the spreads in the bond and corporate debt markets make the ‘data dependent’ Fed pause in 2019? Is rate hike trajectory about to ease? It will make the dot plot releases all the more interesting – and it will make DXY the biggest mover and shaker on a trade front this week. This Thursday’s meeting is a lock for the 25bp rise based on the communication over the past 2 months here is a sample of the Board (all these are voting members)
• Chairman Jerome Powell: “Interest rates are still low by historical standards, and they remain just below the broad range of estimates of the level that would be neutral for the economy — that is, neither speeding up nor slowing down growth.” From a Nov. 28 speech
• Vice Chairman Richard Clarida: “We’re at a point now where we really need to be especially data dependent. The economy is doing well. We’re looking for signals from the labor market, from inflation, to get a sense of both the pace and the destination for policy.” Interview on CNBC on Nov. 16
• New York Fed President John Williams: “I do expect further gradual increases in interest rates will best sponsor a sustained economic expansion.” Press conference on Dec. 4.
Vice Chairman Clarida is interesting – it’s the slight dovishness in the ‘especially’ that may give a hint to Thursday’s press conference – any signs of a pause or a slightly less hawkish Fed will drag on the USD and could mark the start of its moderation in 2019.
Margin/Leveraged trading is very attractive for traders as it helps a trader get higher return on the capital and helps take a bigger position than the amount of capital a trader has.
Many traders however have a tough time understanding margin trading and they end up losing money when they trade on margin. In this blog, we unravel margin trading in simple terms without making it complicated.
In simple terms in case of margin trading a trader only get his profit or loss on the coin. The trader will not actually get the coin but only the profit or loss from the time he enters the position to the time he exits the position.
This is different from buying a coin as in that case you actually get the coin but in case of margin-trading you will only get the P/L. Hence margin-trading is good for traders who are looking to profit from change in the price of the coin and don’t care about having or HODLing the coin.
Delta Exchange – Margin Trading Platform
Futures trading and margin trading are similar from a traders point of view. In both the cases trader get P/L and not the actual coin and both have leverage. Futures usually have higher liquidity and don’t have daily funding as in case of margin – hence I find futures trading a better alternative to margin trading.
How it actually works – An example
So let’s say price of Ether is 100$ and a trader believes that Ethereum is going to go to 110$ in the short term. He decides to go long Ethereum futures on Delta Exchange with 20X leverage. Since the leverage is 20X the trader is required to keep 100/20 = 5$ worth of ETH or 0.05ETH with Delta Exchange to open this position.
FIX API MT4: Automated Trading Platform in 2019
Now if the price of ETH goes to 110$ and trader closes the position he makes a 10% profit or 0.1ETH profit on his position. The trader has however invested only 0.05ETH for trading ETH futures on Delta Exchange, which means that his return on capital is 200%.
If instead the price falls to 95$ then the trader has made a 5% loss on his position. This would mean that the funds 0.05ETH that the trader has kept with exchange are not enough to cover his losses. At this point if the trader does not add more margin to his position the exchange will liquidate his position. In other words his position is closed to make up for his losses. This would mean that the trader will lose the entire 0.05 ETH that he had kept with the exchange.
When to trade using Leverage
If you goal is to target from the price movement of the coin in the short term, you should consider margin trading. If however, you want to buy a coin for a long term for investing purposes or if you are accumulating the coin for some utility of the coin, in that case you should actually buy the coin from some spot exchange.
FIX API clients leverage off SGT Markets existing liquidity and technology relationships to see one counterparty, one price, and one competitive, volume based fee.
Institutional investors – excited by greater regulatory clarity – are going to drive “considerable expansion” of the cryptocurrency market in 2019.
This is the bold forecast by the CEO of one of the world’s largest independent financial advisory organizations.
Nigel Green, founder and chief executive of deVere Group, which launched deVere Crypto, the world’s fastest crypto trading app 12 months ago, is speaking as the post-holiday crypto rally continues.
Over the last 48 hours, the three biggest digital currencies Bitcoin, Ethereum and XRP have climbed 4 per cent, 12 per cent, and 3 per cent, respectively.
Mr Green comments: “The bearish sentiment of the last quarter of 2018 is now, I believe, behind us.
“We can expect the current upswing to continue, albeit with peaks and troughs as in any financial market.”
He continues: “In 2019, the cryptocurrency market is set to radically evolve. We can expect considerable expansion of the sector largely due to inflows of institutional investors.
“Major corporations, financial institutions, governments and their agencies, prestigious universities, and household-name investing legends are all going to bring their institutional capital and institutional expertise to the crypto market.
“The direction of travel has already been on this path, but there is a growing sense that institutional investors are preparing to move off the sidelines in 2019.”
Mr Green goes on to add: “The acceleration of institutional investment is likely to be driven by greater regulatory clarity.
“More and more global jurisdictions can be expected to join the likes of Malta, Hong Kong, Japan and Switzerland in becoming crypto-friendly from a regulatory and pro-business viewpoint.”
Whilst Bitcoin, the world’s largest cryptocurrency by market capitalization, will remain dominant this year, Ethereum and XRP, due to their unique characteristics and problem-solving traits, can be expected to significantly fuel the 2019 upswing, affirms the deVere CEO.
He notes: “The smart contract abilities of Ethereum are already unrivalled. More and more institutional investors will be making use of these capabilities this year. Also, once Ethereum can accept outside data in its smart contract protocols, its price will rocket further.
“When it comes to XRP, hundreds of financial institutions across the world are already working with it and this is a trend that is set to continue and grow in 2019.
“In addition, XRP has been positioning itself to become a leading international facilitator of global remittances and inflows. This is a massive market in the expanding emerging economies.”
Nigel Green concludes: “2019 will be a year of accelerated maturation for the crypto sector due to institutional investment.”
About:
deVere Group is one of the world’s largest independent advisors of specialist global financial solutions to international, local mass affluent, and high-net-worth clients. It has a network of more than 70 offices across the world, over 80,000 clients and $12bn under advisement.