On Wednesday the 9th of January, trading on the euro closed up. The single currency rose on the back of a broadly weaker dollar. The US dollar index fell on account of remarks made by an FOMC member. Charles Evans, head of the Chicago Fed, hinted that the regulator would take its time with further rate hikes given the current uncertainty regarding the US economy. The FOMC’s minutes indicate hesitance among committee members to push interest rate up any higher for the time being. The EURUSD pair rose to 1.1558 after their publication.
16:30 Canada: building permits (Nov), new housing price index (Nov).
16:30 US: initial jobless claims (4 Jan).
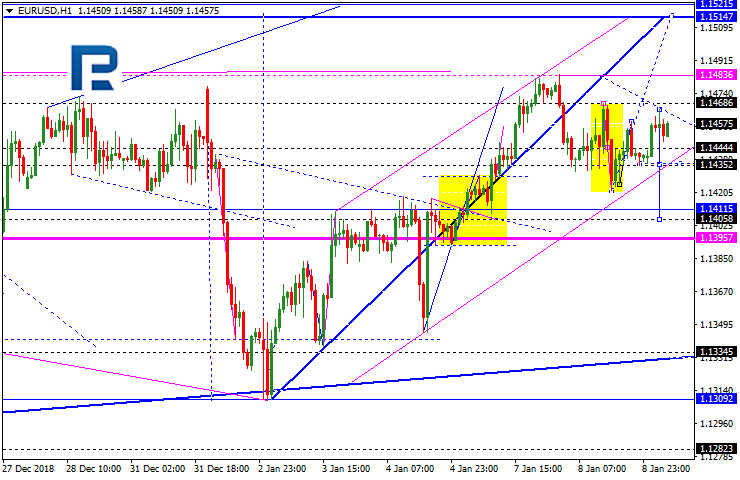
Fig 1. EURUSD hourly chart.
Current situation:
In today’s Asian session, the euro climbed to 1.1570. The rate has been moving upwards for 12 hours, hugging the upper boundary of the upwards channel. Despite yesterday’s growth on the pair, I see the rate dropping to 1.15 via a triple top. There’s nothing important from today’s events calendar. It looks like there’s nothing stopping the pair from correcting downwards to the 45 – 67 degree range. I can’t see the rate dropping any further than that for the time being, since the weekly cycles show the euro strengthening during the first half of this year. The euro is currently being bolstered by the crosses, which are the only thing saving it from decline.
EURUSD is consolidating around 1.1444; this range may be considered as the center of the correctional continuation pattern towards 1.1406. After that, the instrument may form one more ascending structure to reach 1.1515. However, if the price breaks the upside border of the range at 1.1470 without forming any descending structures, the pair may start trading towards 1.1515 at once. Later, the market may resume falling with the target at 1.1400.
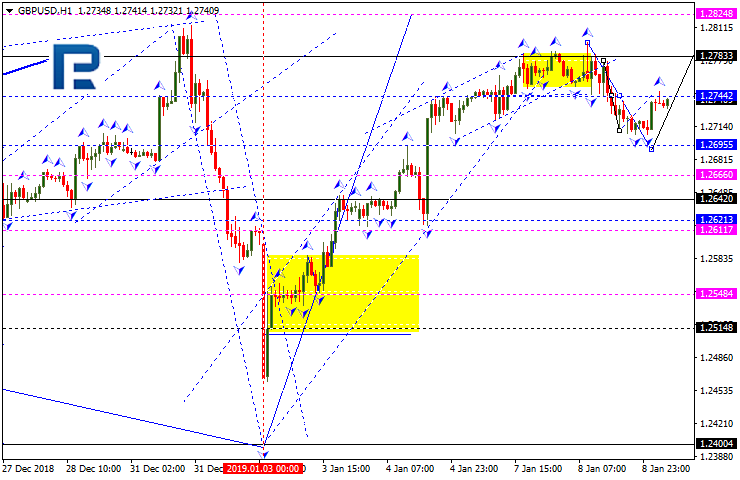
GBPUSD, “Great Britain Pound vs US Dollar”
GBPUSD has broken 1.2744 downwards and completed the first descending structure at 1.2713. Possibly, today the pair may continue falling with the first target at 1.2695. After that, the instrument may start a new growth to return to 1.2744.
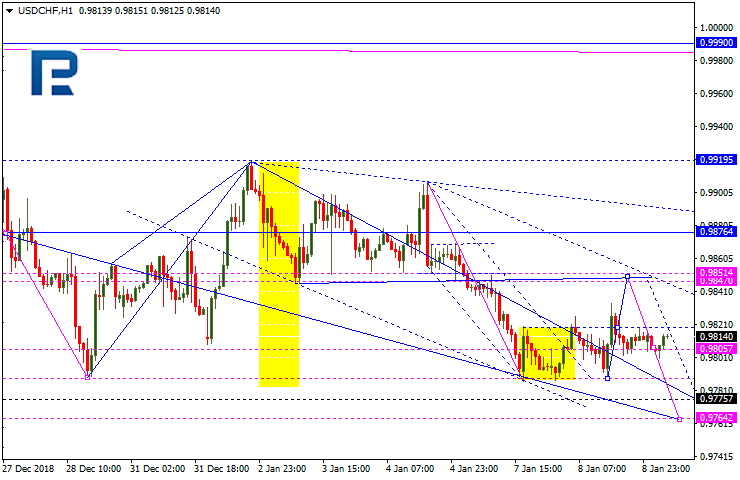
USDCHF, “US Dollar vs Swiss Franc”
USDCHF is still consolidating around 0.9805. If later the instrument breaks this range to the upside, the pair may continue the correction towards 0.9847; if to the downside – resume falling to reach 0.9775 and then form one more ascending structure with the target at 0.9876.
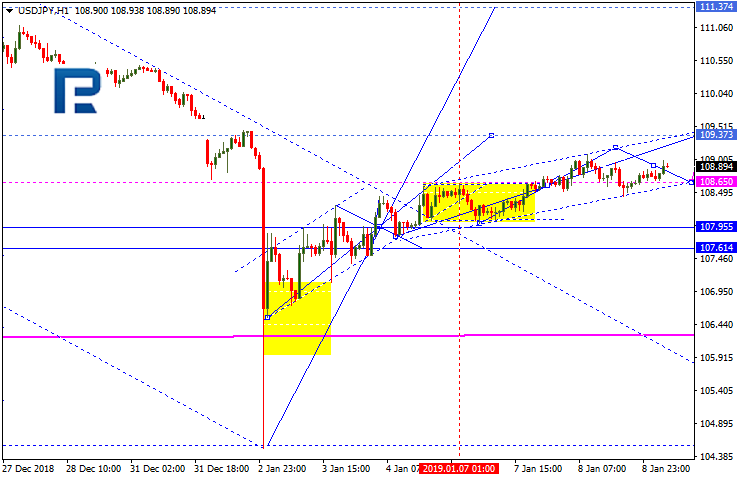
USDJPY, “US Dollar vs Japanese Yen”
USDJPY is still trading upwards. Possibly, the pair may expand the range towards 109.37. Later, the market may be corrected to reach 107.65 and then continue the correction with the target at 111.37.
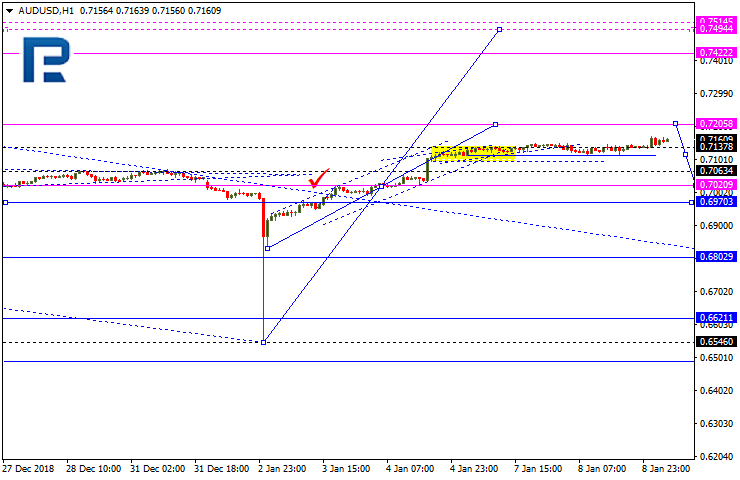
AUDUSD, “Australian Dollar vs US Dollar”
AUDUSD has broken its consolidation range upwards. Today, the pair may expand the range towards 0.7205 and then resume falling with the target at 0.7000. After that, the instrument may start a new growth to reach 0.7420.
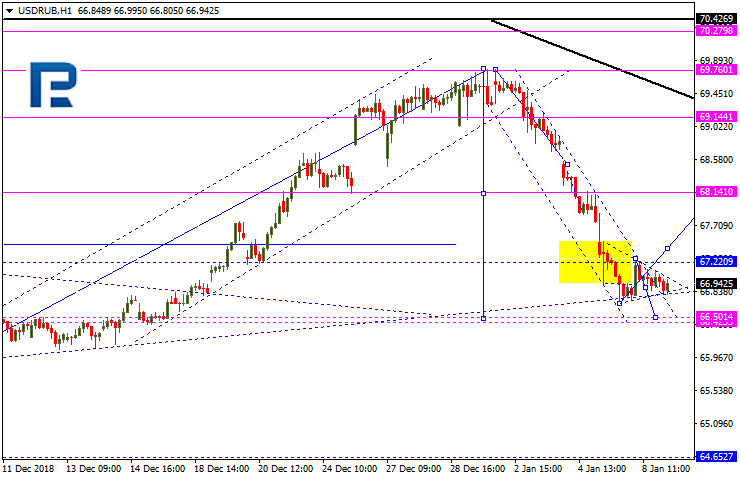
USDRUB, “US Dollar vs Russian Ruble”
USDRUB is forming another consolidation range near the lows. Possibly, the pair may fall towards 66.50 and then start a new growth with the target at 68.14. Later, the market may resume falling to reach 65.60.
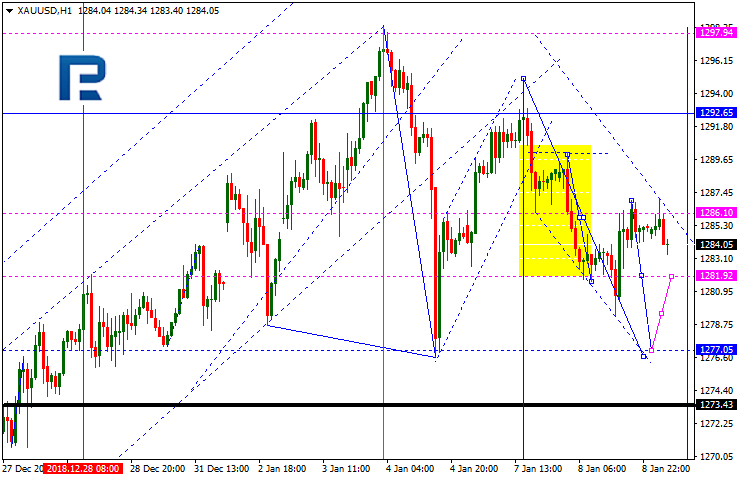
XAUUSD, “Gold vs US Dollar”
Gold is trading downwards to reach 1277.05. Later, the market may break this level and continue the third descending wave with the short-term target at 1259.50.
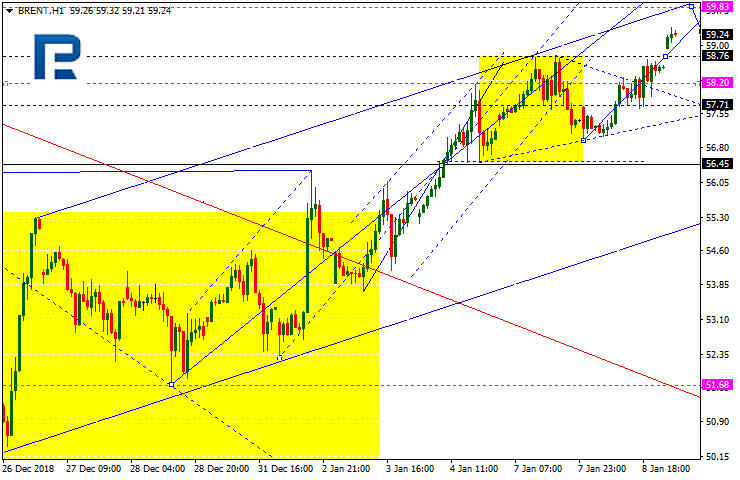
BRENT
Brent has broken its consolidation range upwards. Today, the pair may reach 59.83. After that, the instrument may form a new descending structure towards 58.75 and then continue growing with the short-term target at 60.60.
Attention! Forecasts presented in this section only reflect the author’s private opinion and should not be considered as guidance for trading. RoboForex LP bears no responsibility for trading results based on trading recommendations described in these analytical reviews.
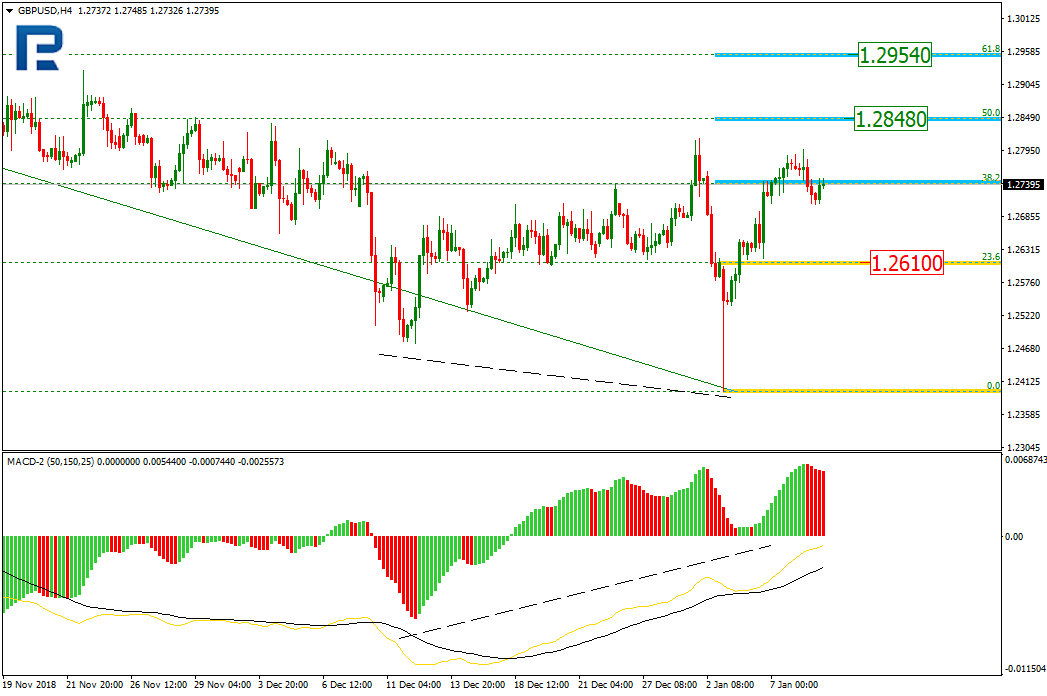
As we can see in the H4 chart, there was a convergence on MACD that made GBPUSD start a new correctional uptrend, which has already reached the retracement of 38.2%. In the future, the correction may continue towards the retracements of 50.0% and 61.8% at 1.2848 and 1.2954 respectively. The support level is at 1.2610.
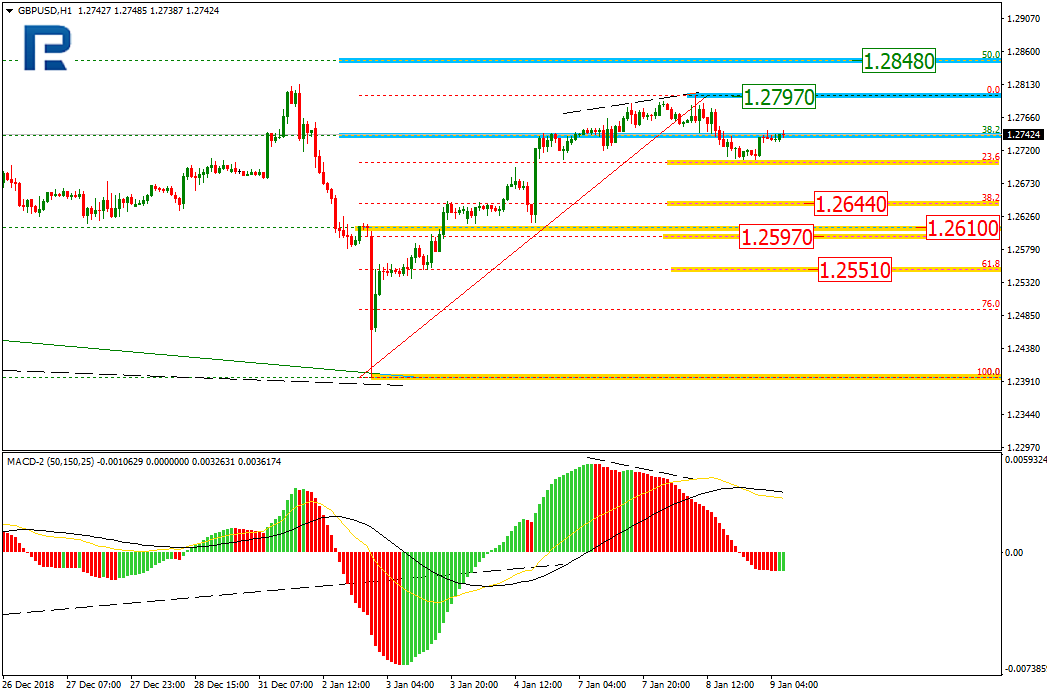
In the H1 chart, there was a divergence on MACD, which made the pair start a new pullback that has already reached the retracement of 23.6%. The next possible targets are the retracements of 38.2%, 50.0%, and 61.8% at 1.2644, 1.2597, and 1.2551 respectively. If the price breaks the local high at 1.2797, the instrument may continue growing towards its mid-term targets.
EURJPY, “Euro vs. Japanese Yen”
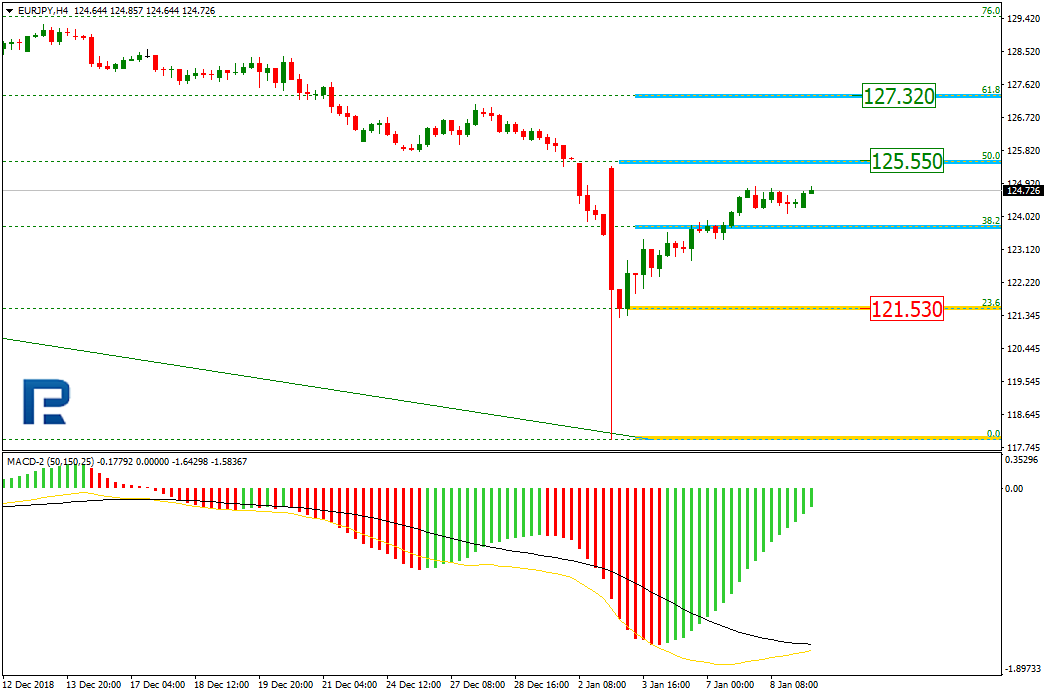
As we can see in the H4 chart, after finishing the quick descending impulse, EURJPY is forming a new pullback towards the retracements of 50.0% and 61.8% at 125.55 and 127.32 respectively. The support level is at 121.53.
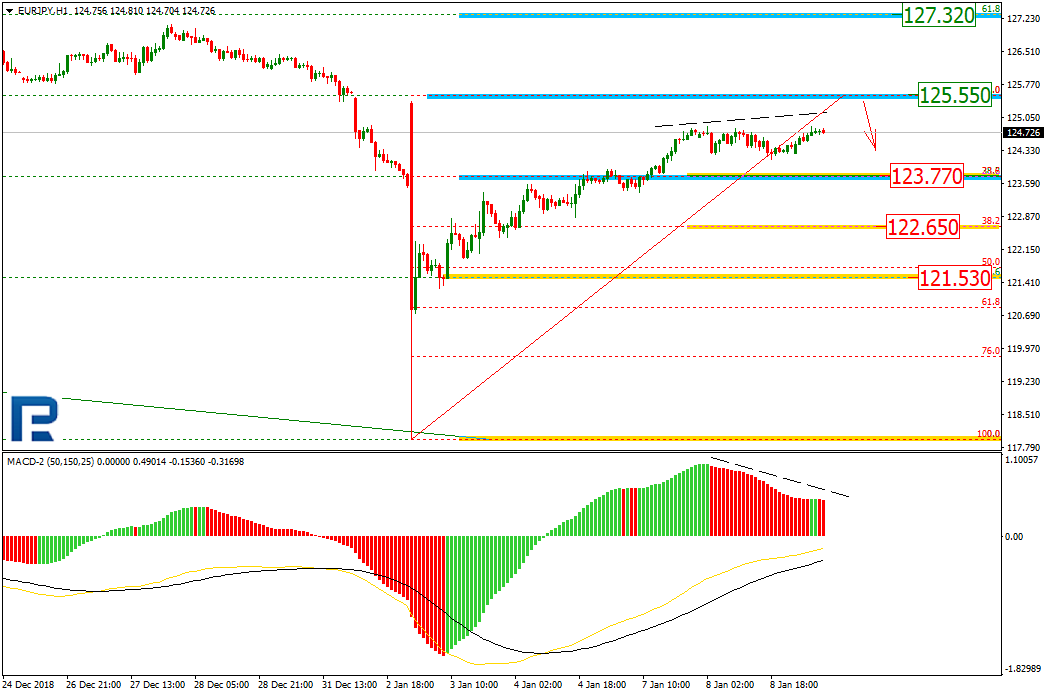
In the H1 chart, there is a divergence on MACD, which may indicate a new correction after the instrument reaches the target at 125.55. The possible targets of this correction may be the retracements of 23.6% and 38.2% at 123.77 and 122.65 respectively.
Attention! Forecasts presented in this section only reflect the author’s private opinion and should not be considered as guidance for trading. RoboForex LP bears no responsibility for trading results based on trading recommendations described in these analytical reviews.
EUR keeps moving sideways. The technical picture is ambiguous. The local support and resistance levels are at 1.14500 and 1.14850 respectively, you should open positions from these levels. The investors are waiting for the relevant info regarding the US/China negotiations as well as the FOMC Minutes. The negotiations were prolonged by an addtional year.
At 21:00 (GMT+2:00) we expect the publication of FOMC Minutes. The financial market participants will be evaluating the comments and rhetorics of the Central Bank representatives regarding the further key interest rate growth. Earlier the Head of Federal Reserve Jerome Powell mentioned that they correct the monetary policy according to the economic reports.
The price fixed above 50 MA and 200 MA which points toward the power of the buyers.
The MACD histogram started to rise, which indicates a bullish mood.
The Stochastic Oscillator is in the neutral zone, the %K line is above the %D line which gives a signal to buy EUR/USD.
Trading recommendations
Support levels: 1.14500, 1.14250, 1.14000
Resistance levels: 1.14850, 1.15000
If the price fixes above the resistance level of 1.14850 expect further growth of the currency pair. The movement will tend toward 1.15250-1.15500.
Alternatively the quotes can descend toward 1.14250-1.14000.
The GBP/USD currency pair
Technical indicators of the currency pair:
Prev Open: 1.27767
Open: 1.27115
% chg. over the last day: -0.33
Day’s range: 1.27065 – 1.27487
52 wk range: 1.2438 – 1.4378
The GBP/USD currency pair is consolidating. There is no defined trend. The local support and resistance levels are 1.27100 and 1.27550, you should open positions from them. The Brexit conundrum remains in the spotlight, the vote on the UK leaving the EU is scheduled for January, 15.
You should keep an eye on the statements by the Head of the Bank of England – 17:30 (GMT+2:00).
The indicators do not provide precise signals, the price fixed between 50 МА and 200 МА.
The MACD histogram is close to 0.
The Stochastic Oscillator is in the neutral zone, the %K line is below the %D line, which gives a signal to sell GBP/USD.
Trading recommendations
Support levels: 1.27100, 1.26500, 1.26000
Resistance levels: 1.27550, 1.28000
If the price fixes above the 1.27550 mark, expect further growth toward the round 1.28000.
Alternatively the quotes can descend toward 1.26750-1.26500.
The USD/CAD currency pair
Technical indicators of the currency pair:
Prev Open: 1.32962
Open: 1.32739
% chg. over the last day: -0.40
Day’s range: 1.32233 – 1.32779
52 wk range: 1.2248 – 1.3664
The USD keeps losing positions against the CAD. The demand for the raw resource currencies grew due to the lack of progress regarding the US/China trading conflict. The quotes are consolidating in the 1.32250-1.32700 range, you should open positions from these levels. Investors are waiting for the Bank of Canada decision regarding the key interest rate at 17:00 (GMT+2). Experts are thinking that the regulator will leave the positions the same.
The Economic News Feed for 09.01.2019 is calm.
The price fixed below 50 MA and 200 MA which points to the power of the sellers.
The MACD histogram is in the negative zone and below the signal line, which gives a signal to sell USD/CAD.
The Stochastic Oscillator is in the neutral zone, the %K line is above the %D line, which points toward the correction of the USD/CAD pair.
Trading recommendations
Support levels: 1.32250, 1.32000
Resistance levels: 1.32700, 1.33100, 1.33650
If the price fixes below 1.32250, expect further growth of toward 1.31750-1.31500.
Alternatively the quotes can correct toward 1.33000-1.33400.
The USD/JPY currency pair
Technical indicators of the currency pair:
Prev Open: 108.700
Open: 108.727
% chg. over the last day: +0.03
Day’s range: 108.700 – 109.000
52 wk range: 104.56 – 114.56
The USD/JPY has stabilized. The USD/JPY quotes are consolidating. The investors are waiting for additional drivers. The key support and interest rates are 108.300 and 109.000, positions should be opened from the key levels. The FOMC Minutes are in the spotlight. You should keep an eye on the US/China trading conflict.
The Economic News Feed for 09.01.2019 is calm.
Indicators do not provide precise signals, the price fixed between 50 MA and 200 MA.
The MACD histogram is in the positive zone but below the signal line, which gives a weak signal to buy USD/JPY.
The Stochastic Oscillator is in the neutral zone, the %K line is below the %D line, which points toward a bearish sentiment.
Trading recommendations
Support levels: 108.300, 107.400, 106.500
Resistance levels: 109.000, 109.500
If the price fixes above the round 109.000 expect further growth toward 109.500-109.750.
Alternatively the quotes can descend toward the round 108.000.
The US dollar recovered some losses against a basket of major currencies after it became known that the US and China decided to extend the talks for another day. It improved investors’ sentiment and gave a signal that countries could resolve their disagreements soon. The dollar index (#DX) closed yesterday in the positive zone (+0.26%). Also, financial market participants expect the statement by Donald Trump regarding the future work of the US government.
It became known that the British government had planned a vote of the House of Commons concerning the Brexit bill on January 15. If the bill is not supported, the UK may remain without an agreement at all and the process of a soft Brexit will be undecided. Today, the attention of financial market participants is focused on the Bank of Canada meeting, as well as the publication of the FOMC minutes. It is expected that the Central Bank of Canada will keep the key marks of monetary policy at the same level.
The “black gold” prices are growing in the hope of a breakthrough in trade relations between the US and China. At the moment, futures for the WTI crude oil are testing the mark of $50.25 per barrel. At 17:30 (GMT+2:00), a report on crude oil inventories will be published in the US.
Market Indicators
Yesterday, the bullish sentiment was observed in the US stock market: #SPY (+0.94%), #DIA (+1.09%), #QQQ (+0.90%).
The 10-year US government bonds yield is recovering. Currently, the indicator is at the level of 2.71-2.72%.
The news feed on 09.01.2019:
– Bank of Canada interest rate decision at 17:00 (GMT+2:00); – FOMC meeting minutes at 21:00 (GMT+2:00).
We also recommend paying attention to the speech by the Bank of England Governor Carney.
On Tuesday, trading on the EURUSD pair closed down. The pair’s decline was minimal as the bulls managed to partially recover their losses in the US session and bring the market into a sideways trend. The pair initially came under pressure after weak data from the Eurozone and Germany, in addition to a broadly stronger dollar after a rise in US bond yields. Pressure was then exerted on the dollar following optimism surrounding the trade talks between the US and China, which increased demand for risky assets, while reducing it for the safe havens.
The balance line and 45th degree are providing strong support, keeping the bears held up at 1.1429. The intraday minimum is at 1.1423.
The hourly indicators favour the bears, while cycles and patterns favour the bulls. Because of this and today’s news releases, I expect to see a rebound to the LB and a rise to the 67th degree at 1.1503. I don’t expect any further growth from the euro given that the FOMC is publishing its minutes today.
In other news, the British parliament will start debating the government’s EU withdrawal agreement today, with a vote planned for next week. This uncertainty will put the pound under pressure. We should also keep an eye on the headlines regarding the talks between the US and China. If something goes wrong, traders will retreat to the yen, and the euro will lose ground against the dollar.
If you are a long-term investor, swing trader, or day trader, then you could find one or all of the charts below interesting. What I am going to briefly cover and show you could make you think twice about how you are investing and trading your money.
I will be the first to admit you should not, and cannot, always pick market tops or bottoms, but there are certain times when it’s worth betting on one.
Below I have shared three charts, each with a different time frame using daily, 30 minutes, and a 10-minute chart. Each chart also has a different technical analysis technique and strategy applied.
Each shorter time frame chart as we work down the page zooms in closer to more imminent price action that should take place over the next few days.
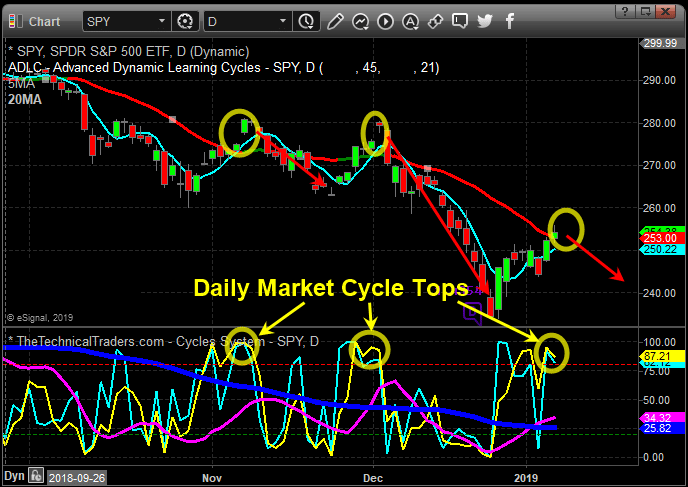
Daily Chart Signals Market Top – Investing/Swing Trading
The daily chart below shows a clear overall trend which is to the downside. Trends are more likely to continue than they are to reverse, hence the saying “The Trend Is Your Friend.”
A key piece of data on this chart is the blue investing cycle line at the bottom. If this is trending down or below the 50 level, then money should be focused on profiting from falling prices via inverse ETF’s, short selling, or put options.
Equally important are the yellow and baby blue cycle lines at the bottom. When these enter the upper reversal zone, we should expect sellers to step into the market and for the price to fall.
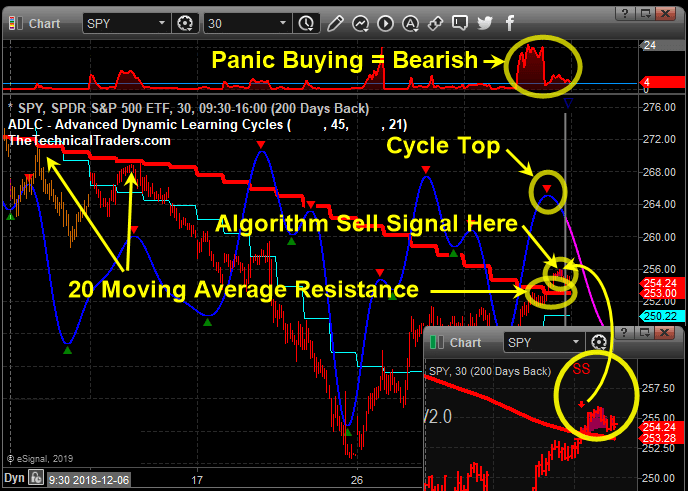
30-Minute Chart Signals Market Top – Swing/Momentum Trading
I apologize for the noisy chart below, a lot is going on there, but if you focus on the yellow text and drawings, it will help keep things simple.
This chart shows several reasons why we expect the price to fall. Based on technical and statistical analysis this chart points weakness over the next 1-3 trading days.
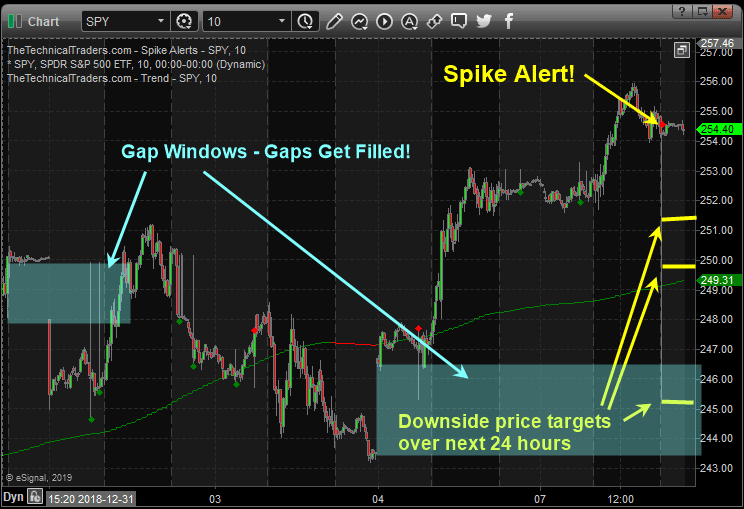
10-Minute Chart Signals Market Top – Momentum/Day Trading
Monday night (Jan 7th) after the closing bell the SPY ETF chart generated a sizable price spike to the downside. Those of you who follow our spikes and or at least know about these setups then you know we expect the price to reach at least one if not all spike targets which are 30%, 50%, and 100% of the spike within 36 hours.
So far in 2019 we have has six price spikes five winners, one loser which is an 83% win rate thus far. Today’s spike is abnormally large not sure what that means regarding this one being a success but it is another spike signal, and the odds favor a move down once you see the other analysis supporting this setup.
In short, 12 months I publically posted a 31-minute video on the stock market explain how 2018 would be wild and how the stock market should top out which it confirmed this a week ago when the December monthly stock market chart closed below critical support. The video goes on to explain how 2019-2020 will most likely be a bear market and economic recession, and that is exactly what looks and feels like is starting to unfold behind the scenes.
If you are boring long-term investor and have been stuck having to ride the stock market rollercoaster with your life savings my trading newsletter can help you with your long-term portfolio to not only avoid losses but profit from the collapse with one simple inverse exchange-traded fund which trades like a stock and you buy and sell it at anytime! Knowing when you put your nest egg to work, and when to back away and protect it is crucial if you want to become wealthy or become wealthy.
On the flip side, if you are an active trader looking for monthly trades then be sure to join the Wealth Building Newsletter today and receive my daily pre-market video analysis, so you understand what took place yesterday, during overnight trading, and what to expect when the market opens.
Subscribe today and become part of our trading community and prosper from the coming market correction and real-estate downturn.
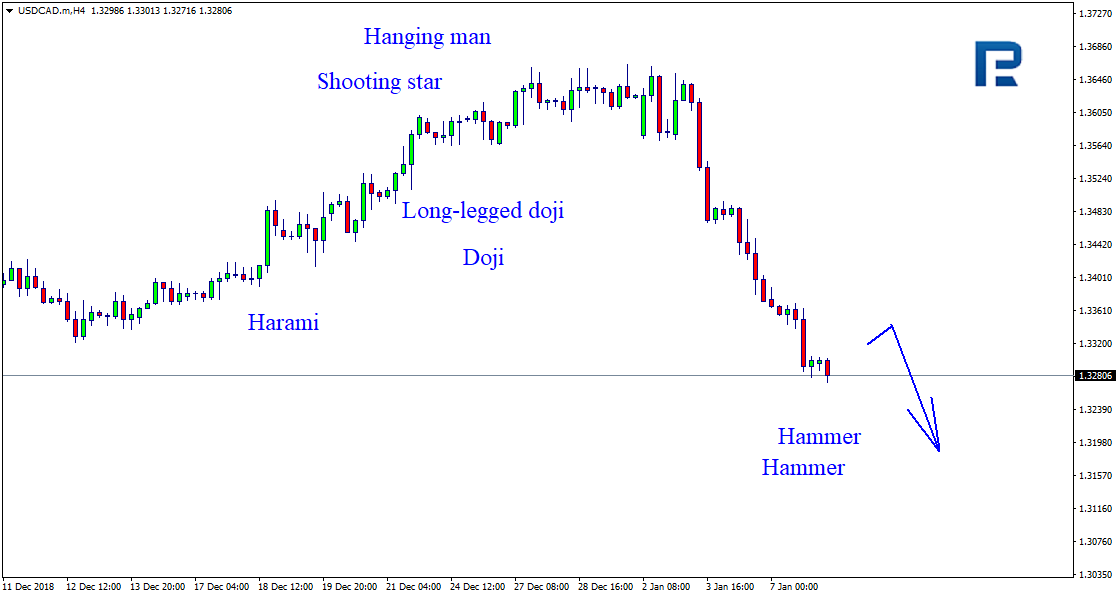
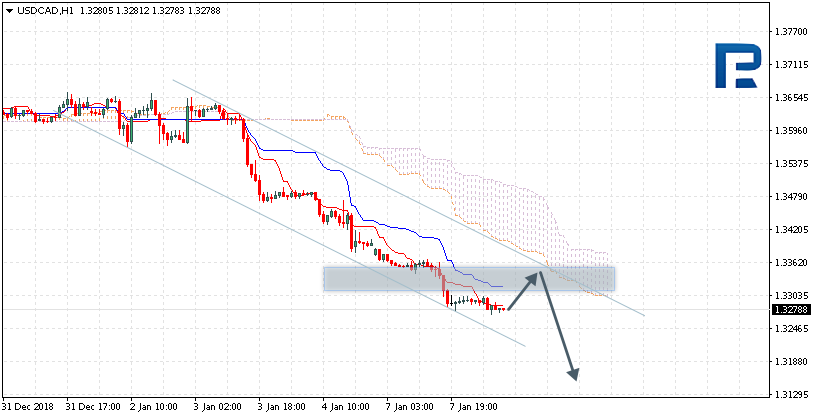
As we can see in the H4 chart, USDCAD is still trading close to the support level and forming Hammer reversal patterns. Judging by the previous movements, it may be assumed that right now the instrument may form another correction and then resume its descending movement.
AUDUSD, “Australian Dollar vs US Dollar”
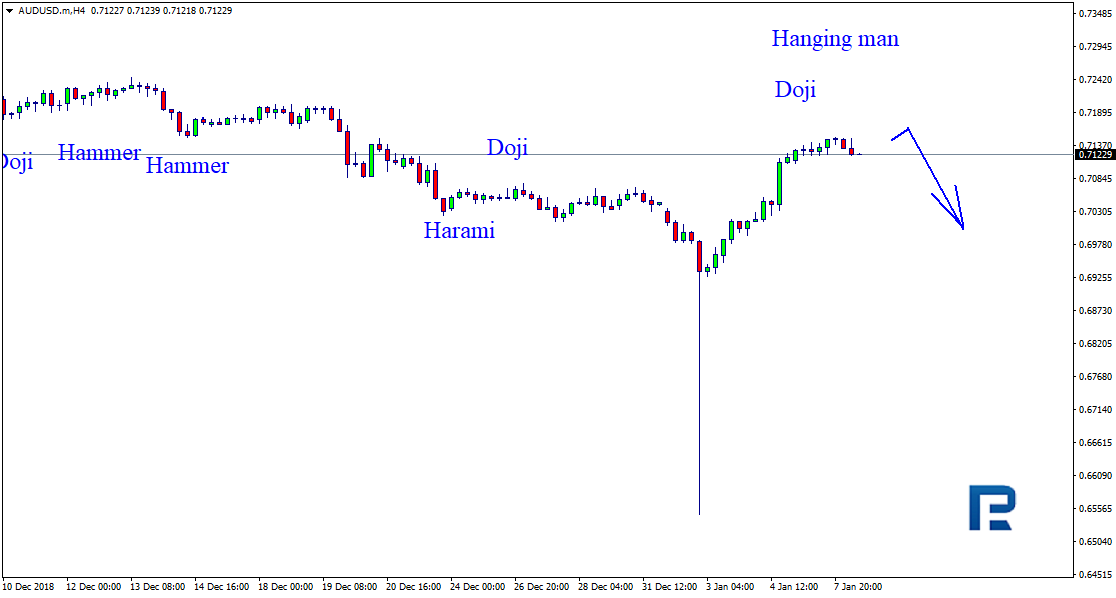
As we can see in the H4 chart, AUDUSD has completed another pullback from the support level and formed Hanging Man and Doji reversal patterns. Judging by the previous movements, it may be assumed that after finishing the correction the instrument may continue the downtrend.
Attention! Forecasts presented in this section only reflect the author’s private opinion and should not be considered as guidance for trading. RoboForex LP bears no responsibility for trading results based on trading recommendations described in these analytical reviews.
AUDUSD is trading at 0.7124; the instrument is moving above Ichimoku Cloud, thus indicating an ascending tendency. The markets could indicate that the price may test the upside border of the cloud at 0.7095 and then resume moving upwards to reach 0.7355. Another signal to confirm further ascending movement is the price’s rebounding from the support level. However, the scenario that Implies further growth may be cancelled if the price breaks the downside border of the cloud and fixes below 0.6865. In this case, the pair may continue falling towards 0.6725.
NZDUSD, “New Zealand Dollar vs US Dollar”
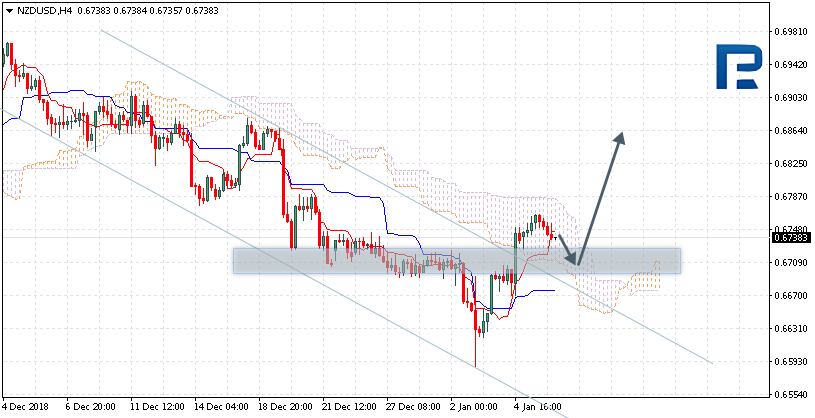
NZDUSD is trading at 0.6738; the instrument is moving inside Ichimoku Cloud, thus indicating a sideways tendency. The markets could indicate that the price may test the downside border of the cloud at 0.6705 and then resume moving upwards to reach 0.6865. Another signal to confirm further ascending movement is the price’s rebounding from the support level. However, the scenario that Implies further growth may be cancelled if the price breaks the downside border of the cloud and fixes below 0.6630. In this case, the pair may continue falling towards 0.6525.
USDCAD, “US Dollar vs Canadian Dollar”
USDCAD is trading at 1.3278; the instrument is moving below Ichimoku Cloud, thus indicating a descending tendency. The markets could indicate that the price may test the downside border of the cloud at 1.3345 and then resume moving downwards to reach 1.3155. Another signal to confirm further descending movement is the price’s rebounding from the resistance level. However, the scenario that implies further decline may be cancelled if the price breaks the upside border of the cloud and fixes above 1.3425. In this case, the pair may continue growing towards 1.3545.
Attention! Forecasts presented in this section only reflect the author’s private opinion and should not be considered as guidance for trading. RoboForex LP bears no responsibility for trading results based on trading recommendations described in these analytical reviews.
Yesterday the US dollar was weakened against the basket of major currencies. The quotes grew by 80 points. Jerome Powell, the Head of Federal Reserve, mentioned that the further rates of the interest rate growth will be determined by the future reports and the world economy. The pressure on the USD is caused by the weak business activity data in the non-industry economic sector. The EUR/USD is consolidating around 1.14300-1.14600, you should open positions from these levels.
The price fixed above 50 MA and 200 MA, which points toward the power of the buyers.
The MACD histogram is around 0. There are no signals at the moment.
The Stochastic Oscillator is in the neutral zone, the %K line is above the %D line, which gives a signal to buy EUR/USD.
Trading recommendations
Support levels: 1.14300, 1.14000, 1.13800
Resistance levels: 1.14600, 1.14850, 1.15000
If the price fixes above 1.14600 expect further growth toward 1.14850-1.15000.
Alternatively the quotes can correct toward 1.14000.
The GBP/USD currency pair
Technical indicators of the currency pair:
Prev Open: 1.27152
Open: 1.27767
% chg. over the last day: +0.42
Day’s range: 1.27459 – 1.27971
52 wk range: 1.2438 – 1.4378
GBP/USD recovered the majority of its losses after a sharp decline in the beginning of the month. The pound is being traded in a flat. The quotes are testing the local support and resistance levels at 1.27350 and 1.27900 and have further growth prospects. Investors are waiting for new data on Brexit. Positions should be opened from the key levels.
The Economic News Feed for 08.01.2019 is calm.
The price fixed above 50 MA and 200 MA which shows the power of the buyers.
The MACD histogram is in the positive zone but below the signal line, which gives a weak signal to buy GBP/USD.
The Stochastic Oscillator is in the neutral zone, the %K line is crossing the %D line. There are no precise signals at the moment.
Trading recommendations
Support levels: 1.27350, 1.27000, 1.26500
Resistance levels: 1.27900, 1.28500
If the price fixes above 1.27900 you should expect further growth toward 1.28300-1.28500.
Alternatively the price can descend toward 1.27000.
The USD/CAD currency pair
Technical indicators of the currency pair:
Prev Open: 1.33729
Open: 1.32962
% chg. over the last day: -0.54
Day’s range: 1.32680 – 1.33030
52 wk range: 1.2248 – 1.3664
The USD/CAD keeps showing a stable downward trend. Since the beginning of the month, the CAD grew by 300 points. Yesterday the CAD was supported by positive business activity reports from Ivey. At the moment the quotes are consolidating around 1.32700-1.33100. A technical correction is possible soon. You should open positions from the key levels.
The Economic News Feed for 08.01.2019:
– Trading Balance Report (CA) – 15:30 (GMT+2:00);
The price fixed below 50 MA and 200 MA which shows the power of the sellers.
The MACD histogram is in the negative zone but above the signal line which gives a weak signal to sell USD/CAD.
The Stochastic Oscillator is around the %K line is above the %D line, which indicates a bullish sentiment.
Trading recommendations
Support levels: 1.32700, 1.32400
Resistance levels: 1.33100, 1.33650, 1.34250
If the price fixes below 1.32700 expect further descend toward 1.32400-1.32200.
Alternatively the quote can correct toward 1.33400-1.33600.
The USD/JPY currency pair
Technical indicators of the currency pair:
Prev Open: 108.507
Open: 108.700
% chg. over the last day: +0.11
Day’s range: 108.512 – 109.087
52 wk range: 104.56 – 114.56
The USD/JPY quotes keep recovering after a long fall. The save haven currency is testing 109.000. 108.300 is acting as the key support. The downward trend can return soon. The US and China started the negotioations which led to the increase of demand for safe assets. Positions should be opened from the key levels.
The Economic News Feed for 08.01.2019 is calm.
The indicators do not provide precise signals, the price fixed between 50 MA and 200 MA.
The MACD histogram is in the positive zone and above the signal line, which shows the further growth of USD/JPY.
The Stochastic Oscillator is in the neutral zone, the %K line is below the %D line, which points toward a bearish mood.
Trading recommendations
Support levels: 108.300, 107.400, 106.500
Resistance levels: 109.000, 109.500
If the price fixes above the round 109.000 exoect further growth of USD/JPY.
Alternatively the quotes can descend toward 108.000-107.800.