Author Archive for InvestMacro – Page 302

Forex Technical Analysis & Forecast 11.01.2019 (EURUSD, GBPUSD, USDCHF, USDJPY, AUDUSD, USDRUB, GOLD, BRENT)

Article By RoboForex.com

EURUSD, “Euro vs US Dollar”

EURUSD has reached its downside target; right now, it is trading upwards to reach a.1537. Later, the market may fall towards 1.1510, thus forming a new consolidation range between two above-mentioned levels. If the instrument breaks this range to the upside, the price may form one more ascending structure with the target at 1.1570; if to the downside – resume falling towards 1.1461.

EURUSD
Risk Warning: the result of previous trading operations do not guarantee the same results in the future

GBPUSD, “Great Britain Pound vs US Dollar”

GBPUSD is still consolidating above 1.2758. Possibly, today the pair may grow towards 1.2811 and then fall to return to 1.2758, thus forming a new consolidation range. If the instrument breaks this range to the upside, the price may continue growing to reach 1.2899; if to the downside – form a new descending structure with the target at 1.2700.

GBPUSD
Risk Warning: the result of previous trading operations do not guarantee the same results in the future

USDCHF, “US Dollar vs Swiss Franc”

USDCHF is falling towards 0.9815. Later, the market may start a new ascending wave to reach 0.9833, thus forming a new consolidation range. If the instrument breaks this range to the upside, the price may continue growing with the target at 0.9888; if to the downside – form a new descending structure towards 0.9800.

USDCHF
Risk Warning: the result of previous trading operations do not guarantee the same results in the future

USDJPY, “US Dollar vs Japanese Yen”

USDJPY is trading upwards to reach 108.63. After that, the instrument may start a new decline with the target at 107.70.

USDJPY
Risk Warning: the result of previous trading operations do not guarantee the same results in the future

AUDUSD, “Australian Dollar vs US Dollar”

AUDUSD has completed the ascending wave. Today, the pair may fall to break 0.7155. After that, the instrument may continue the correction with the target at 0.7122.

AUDUSD
Risk Warning: the result of previous trading operations do not guarantee the same results in the future

USDRUB, “US Dollar vs Russian Ruble”

USDRUB is trading upwards to reach 67.37. Later, the market may resume falling towards 67.00, thus forming a new consolidation range. If the instrument breaks this range to the upside, the price may be corrected with the target at 68.15; if to the downside – continue trading inside the downtrend towards 66.50.

USDRUB
Risk Warning: the result of previous trading operations do not guarantee the same results in the future

XAUUSD, “Gold vs US Dollar”

Gold is trading upwards. Possibly, the pair may reach 1297.90. After that, the instrument may fall towards 1291.44 and then form one more ascending structure to reach 1300.955. Later, the market may form a new consolidation range around 1288.63.

GOLD
Risk Warning: the result of previous trading operations do not guarantee the same results in the future

BRENT

Brent is consolidating around 61.17. Today, the pair may reach 61.98. After that, the instrument may form a new descending structure towards 59.55 and then resume with the short-term target at 63.05.

BRENT
Risk Warning: the result of previous trading operations do not guarantee the same results in the future

Article By RoboForex.com

Attention!
Forecasts presented in this section only reflect the author’s private opinion and should not be considered as guidance for trading. RoboForex LP bears no responsibility for trading results based on trading recommendations described in these analytical reviews.

Fibonacci Retracements Analysis 11.01.2019 (BITCOIN, ETHEREUM)

Article By RoboForex.com

BTCUSD, “Bitcoin vs US Dollar”

As we can see in the H4 chart, BTCUSD has failed to form an ascending wave and expand the mid-term correction. At the same time, the descending impulse may be considered as a quick internal wave of the short0-term correction to the downside. The impulse has already reached the retracement of 61.8% and may continue towards the retracement of 76.0% at 3389.00. The key target of this impulse is the low at 3121.90. However, the price may yet break the high at 4234.50. In this case, the instrument may continue the correctional uptrend towards the retracement of 38.2% at 4428.00.

BTCUSD1
Risk Warning: the result of previous trading operations do not guarantee the same results in the future

In the H1 chart, the pair is falling towards the post-correctional extension area between the retracements of 138.2% and 161.8% at 3359.40 and 3233.00 respectively. The local resistance is at 4108.80.

BTCUSD2
Risk Warning: the result of previous trading operations do not guarantee the same results in the future

ETHUSD, “Ethereum vs. US Dollar”

As we can see in the H4 chart, there was a divergence o MACD, which made start a new correction to the downside. By now, it has already reached the retracement of 38.2%. The next possible targets are the retracements of 50.0%, 61.8%, and 76.0% at 120.70, 111.40, and 99.95 respectively. After breaking the resistance 160.44, the price may continue the mid-term correctional uptrend towards the retracement of 61.8% at 168.60.

ETHUSD1
Risk Warning: the result of previous trading operations do not guarantee the same results in the future

In the H1 chart, the instrument is falling towards the retracements of 50.0%, 61.8%, and 76.0% at 120.70, 111.40, and 99.95 respectively.

ETHUSD2
Risk Warning: the result of previous trading operations do not guarantee the same results in the future

Article By RoboForex.com

Attention!
Forecasts presented in this section only reflect the author’s private opinion and should not be considered as guidance for trading. RoboForex LP bears no responsibility for trading results based on trading recommendations described in these analytical reviews.

The Analytical Overview of the Main Currency Pairs on 2019.01.11

Analytics by JustForex

The EUR/USD currency pair

Technical indicators of the currency pair:
  • Prev Open: 1.15413
  • Open: 1.14993
  • % chg. over the last day: -0.30
  • Day’s range: 1.14964 – 1.15321
  • 52 wk range: 1.1214 – 1.2557

EUR retreated from the local maximums. Yesterday the quotes fell by 40 points. Right now they are consolidating around 1.15100-1.15350, you should open positions from these levels. USD remains under pressure, since some representatives of the Federal Reserve do not want to increase the key interest rate in 2019. Today the attention will be on the US inflation report. Positions should be opened from the key levels.

The Economic News Feed for 11.01.2019:

  • – Basic Consumer Price Index (US) – 15:30 (GMT+2:00);
EUR/USD

The indicators do not provide precise signals, the price is testing 50 MA.

The MACD histogram is close to 0.

The Stochastic Oscillator is in the neutral zone, the %K line is below the %D line, which points toward a bearish mood.

Trading recommendations
  • Support levels: 1.15100, 1.14850, 1.14500
  • Resistance levels: 1.15350, 1.15700, 1.16000

If the price fixes above 1.15350 expect growth toward 1.15700-1.16000.

Alternatively the quotes can correct toward 1.14850-1.14500.

The GBP/USD currency pair

Technical indicators of the currency pair:
  • Prev Open: 1.27889
  • Open: 1.27372
  • % chg. over the last day: -0.29
  • Day’s range: 1.27157 – 1.27678
  • 52 wk range: 1.2438 – 1.4378

GBP/USD remains in a long flat. There is no single well-defined trend. Right now the quotes are testing the local support and resistance levels of 1.27100 and 1.27650. The pound has a tendency to descend. The investors are waiting for important reports from the UK. Positions should be opened from the key levels.

The Economic News Feed for 11.01.2019:

  • – GDP Report (UK) – 11:30 (GMT+2:00);
  • – Production Volume in the Processing Industry Report (UK) – 11:30 (GMT+2:00);
GBP/USD

The indicators do not provide precise signals, the price has fixed between 50 MA and 200 MA.

The MACD histogram started to descend, which points toward a bearish mood.

The Stochastic Oscillator is in the neutral zone, the %K line is below the %D line, which points toward the sale of GBP/USD.

Trading recommendations
  • Support levels: 1.27100, 1.26500, 1.26000
  • Resistance levels: 1.27650, 1.28000

If the price fixes below the local support 1.27100 expect the quotes to dall toward 1.26600-1.26400.

Alternatively the quotes can grow toward 1.27750-1.28000.

The USD/CAD currency pair

Technical indicators of the currency pair:
  • Prev Open: 1.32061
  • Open: 1.32311
  • % chg. over the last day: +0.24
  • Day’s range: 1.31839 – 1.32447
  • 52 wk range: 1.2248 – 1.3664

The USD/CAD keeps showing a negative trend. At the moment CAD is testing the local support of 1.31800. 1.32200 is a mirror resistance. The demand for the USD is weakened after the FOMC minutes. The CAD is supported by the bullish mood on the oil quotes. USD/CAD can descend further, positions should be opened from the key levels.

The Economic News Feed for 11.01.2019 is calm.

  • – Economic Event (CAD) – 00:00 (GMT+2:00);
  • – Economic Event (CAD) – 00:00 (GMT+2:00);
  • – Economic Event (CAD) – 00:00 (GMT+2:00);
USD/CAD

The price fixed below 50 MA and 200 MA, which points toward the power of the sellers.

The MACD histogram is in the negative zone and below the signal line, which points to a descend of the USD/CAD quotes.

The Stochastic Oscillator is in the oversold zone, the %K line is below the %D line which gives a weak signal to sell USD/CAD.

Trading recommendations
  • Support levels: 1.31800, 1.31500
  • Resistance levels: 1.32200, 1.32700, 1.33100

If the price fixes below the local support 1.31800 expect the quotes to descend toward 1.31500-1.31200.

Alternatively the quotes can correct toward 1.32500-1.33000.

The USD/JPY currency pair

Technical indicators of the currency pair:
  • Prev Open: 108.132
  • Open: 108.425
  • % chg. over the last day: +0.11
  • Day’s range: 108.230 – 108.472
  • 52 wk range: 104.56 – 114.56

The USD/JPY is showing an ambiguous technical picture. Right now the quotes are consolidating around 108.000-108.500 and can descend further. Keep an eye on the US News Feed. You should open positions from the key levels.

The Economic News Feed for 11.01.2019 is calm.

USD/JPY

The indicators do not provide precise signals, the price has crossed 50 MA and 200 MA.

The MACD histogram is close to 0.

The Stochastic Oscillator is in the neutral zone, the %K line is crossing the %D line. There are no signals at the moment.

Trading recommendations
  • Support levels: 108.000, 107.500, 107.200
  • Resistance levels: 108.500, 109.000, 109.500

If the price fixes below the round 108.000, expect the quotes to descend toward 107.500-107.200.

Alternatively the quotes can recover toward 109.000-109.250.

Analytics by JustForex

The US Dollar Slightly Strengthened

by JustForex

The US dollar slightly strengthened against a basket of major currencies. However, the US currency is still under pressure after the publication of the FOMC minutes. Some Fed representatives believe that it is not necessary to rush to a further increase in interest rates in the current year. Yesterday, the head of the US Central Bank announced that the regulator would take into account the state and risks in the global financial markets when adjusting monetary policy. The dollar index (#DX) closed yesterday in the positive zone (+0.35%).

Today, during the Asian trading session, a report on the volume of retail sales has been published in Australia, the figure counted to +0.4% in November and was better than the forecasted value of +0.3%. We expect important statistics from the UK and the US.

The “black gold” prices continue to show positive dynamics. At the moment, futures for the WTI crude oil are testing the mark of $53.15 per barrel.

Market Indicators

Yesterday, the bullish sentiment was observed in the US stock market: #SPY (+0.35%), #DIA (+0.45%), #QQQ (+0.29%).

The 10-year US government bonds yield has become stable. At the moment, the indicator is at the level of 2.72-2.73%.

The news feed on 11.01.2019:

– UK GDP data at 11:30 (GMT+2:00);
– UK manufacturing production at 11:30 (GMT+2:00);
– Core consumer price index in the US at 15:30 (GMT+2:00).

by JustForex

Warning Signs from Russell 2000 and Dow Transports

By TheTechnicalTraders.com

Japanese Candlesticks Analysis 10.01.2019 (GOLD, NZDUSD)

Article By RoboForex.com

XAUUSD, “Gold vs US Dollar”

As we can see in the H4 chart, XAUUSD is testing the resistance level again and forming Shooting Star and Hanging Man reversal patterns. Judging by the previous movements, it may be assumed that after finishing the correction the instrument may continue its ascending movement.

GOLD
Risk Warning: the result of previous trading operations do not guarantee the same results in the future

NZDUSD, “New Zealand vs. US Dollar”

As we can see in the H4 chart, NZDUSD is trading near the resistance level and forming Hanging Man and Shooting Star reversal patterns. Judging by the previous movements, it may be assumed that after testing the resistance level and completing another pullback the instrument may continue its growth.

NZDUSD
Risk Warning: the result of previous trading operations do not guarantee the same results in the future

Article By RoboForex.com

Attention!
Forecasts presented in this section only reflect the author’s private opinion and should not be considered as guidance for trading. RoboForex LP bears no responsibility for trading results based on trading recommendations described in these analytical reviews.

Ichimoku Cloud Analysis 10.01.2019 (AUDUSD, NZDUSD, USDCAD)

Article By RoboForex.com

AUDUSD, “Australian Dollar vs US Dollar”

AUDUSD is trading at 0.7186; the instrument is moving above Ichimoku Cloud, thus indicating an ascending tendency. The markets could indicate that the price may test the upside border of the cloud at 0.7170 and then resume moving upwards to reach 0.7265. Another signal to confirm further ascending movement is the price’s rebounding from the support level. However, the scenario that Implies further growth may be cancelled if the price breaks the downside border of the cloud and fixes below 0.7145. In this case, the pair may continue falling towards 0.7055.

AUDUSD
Risk Warning: the result of previous trading operations do not guarantee the same results in the future

NZDUSD, “New Zealand Dollar vs US Dollar”

NZDUSD is trading at 0.6782; the instrument is moving above Ichimoku Cloud, thus indicating an ascending tendency. The markets could indicate that the price may test the upside border of the cloud at 0.6755 and then resume moving upwards to reach 0.6865. Another signal to confirm further ascending movement is the price’s rebounding from the channel’s downside border. However, the scenario that Implies further growth may be cancelled if the price breaks the downside border of the cloud and fixes below 0.6720. In this case, the pair may continue falling towards 0.6625.

NZDUSD
Risk Warning: the result of previous trading operations do not guarantee the same results in the future

USDCAD, “US Dollar vs Canadian Dollar”

USDCAD is trading at 1.3238; the instrument is moving inside Ichimoku Cloud, thus indicating a sideways tendency. The markets could indicate that the price may test the upside border of the cloud at 1.3255 and then resume moving downwards to reach 1.3135. Another signal to confirm further descending movement is the price’s rebounding from the channel’s upside border. However, the scenario that implies further decline may be cancelled if the price breaks the upside border of the cloud and fixes above 1.3285. In this case, the pair may continue growing towards 1.3395.

USDCAD
Risk Warning: the result of previous trading operations do not guarantee the same results in the future

Article By RoboForex.com

Attention!
Forecasts presented in this section only reflect the author’s private opinion and should not be considered as guidance for trading. RoboForex LP bears no responsibility for trading results based on trading recommendations described in these analytical reviews.

The Analytical Overview of the Main Currency Pairs on 2019.01.10

by JustForex

The EUR/USD currency pair

Technical indicators of the currency pair:
  • Prev Open: 1.14401
  • Open: 1.15413
  • % chg. over the last day: +0.98
  • Day’s range: 1.15344 – 1.15697
  • 52 wk range: 1.1214 – 1.2557

The demand for USD is weakened after the FOMC Minutes publication. Some federal reserve representatives consider that they should keep the key interest range at the same level. The EUR/USD growth increased by 120 points and updated the key extremums. At the moment the quotes are consolidating around 1.15300-1.15700, positions should be opened from these levels. The financial market participants are waiting for the protocol of the last ECB meeting regarding the monetary policy.

The Economic News Feed for 10.01.2019:

  • – Publication of the ECB meeting protocol regarding the monetary policy (EU) – 14:30 (GMT+2:00);

You should keep an eye on the US real estate report and the statement by the Head of the Federal Reserve, Jerome Powell.

EUR/USD

The price fixed above 50 MA and 200 MA, which points toward the power of the buyers.

The MACD histogram is in the positive zone but below the signal line, which gives a weak signal to buy EUR/USD.

The Stochastic Oscillator is in the neutral zone, the %K line is below the %D line which points toward the correction of the EUR/USD quotes.

Trading recommendations
  • Support levels: 1.15300, 1.14850, 1.14500
  • Resistance levels: 1.15700, 1.16000

If the price fixes above the resistance level of 1.15700 expect further growth of the EUR/USD. The movement will tend toward 1.16000-1.16300.

Alternatively the quotes can correct toward 1.15000-1.14800.

The GBP/USD currency pair

Technical indicators of the currency pair:
  • Prev Open: 1.27115
  • Open: 1.27889
  • % chg. over the last day: +0.63
  • Day’s range: 1.27504 – 1.27997
  • 52 wk range: 1.2438 – 1.4378

The technical picture on the GBP/USD currency pair remains ambiguous. The pound is moving sideways. The key levels are 1.27500 and 1.28000, you should open positions from these levels. A correction is possible soon, consider keeping an eye on the relevant Brexit intel.

The Economic News Feed for 10.01.2019 is calm.

GBP/USD

The indicators do not provide signals, the price is testing 50 MA.

The MACD histogram is in the positive zone but below the signal line, which suggests buying GBP/USD.

The Stochastic Oscillator is in the neutral zone, the %K line is below the %D line, which indicates a bearish mood.

Trading recommendations
  • Support levels: 1.27500, 1.27100, 1.26500
  • Resistance levels: 1.28000, 1.28500

If the price fixes above 1.28000 expect further growth of the quotes toward 1.28400-1.28600.

Alternatively the quotes can correct toward 1.27100-1.26800.

The USD/CAD currency pair

Technical indicators of the currency pair:
  • Prev Open: 1.32739
  • Open: 1.32061
  • % chg. over the last day: -0.46
  • Day’s range: 1.32010 – 1.32500
  • 52 wk range: 1.2248 – 1.3664

USD/CAD is in a bearish mood. The CAD is supported by the positive dynamic of the oil quotes. The WTI futures grew by 5% yesterday. The USD/CAD quotes are consolidating around 1.32200-1.32700. Positions should be opened from these levels. A technical correction is possible soon.

The Economic News Feed for 10.01.2019 is calm. At 15:30 (GMT+2:00) Canada will publish some data on the real estate market.

USD/CAD

The indicators do not provide precise signals. The price is testing 50 MA which is a strong dynamic resistance.

The MACD histogram is close to 0.

The Stochastic Oscillator is in the neutral zone, the %K line is above the %D line, which points toward a correction of the USD/CAD.

Trading recommendations
  • Support levels: 1.32200, 1.31800
  • Resistance levels: 1.32700, 1.33100, 1.33650

If the price fixes above 1.32700 expect further growth of USD/CAD toward 1.33100-1.33500.

Alternatively the quotes can fall toward 1.31800-1.31600.

The USD/JPY currency pair

Technical indicators of the currency pair:
  • Prev Open: 108.727
  • Open: 108.132
  • % chg. over the last day: -0.52
  • Day’s range: 107.769 – 108.258
  • 52 wk range: 104.56 – 114.56

The USD/JPY quotes started to descend. The yen strengthened against the USD by more than 60 points. The key support and resistance levels are 107.750 and 108.450, you should open positions from these levels. The trading instrument has further descend potential. Keep an eye on the US Tresure bonds yield dynamics.

The Economic News Feed for 10.01.2019 is calm.

USD/JPY

The price fixed between 50 MA and 200 MA which points toward the power of the sellers.

The MACD histogram is in the negative zone but above the signal line which provides a weak signal to sell USD/JPY.

The Stochastic Oscillator is in the neutral zone, the %K line is above the %D line, which points toward the bearish mood.

Trading recommendations
  • Support levels: 107.750, 107.200, 106.500
  • Resistance levels: 108.450, 109.000, 109.500

If the price fixes below 107.750 expect the descend toward 107.200-107.000.

Alternatively the quotes can recover toward 108.750-109.000.

by JustForex

The US Dollar Index Has Been Declining

Analytics by JustForex

The US dollar weakened against a basket of major currencies after the publication of the FOMC minutes. According to the minutes of the December Fed meeting, some officials support the idea of keeping rates unchanged in 2019. The dollar index (#DX) closed yesterday in the negative zone (-0.72%).

Yesterday, the Bank of Canada published its decision on a key interest rate, according to which the indicator remained unchanged at 1.75%, as investors expected. Today, during the Asian trading session weak economic data have been published in China. Thus, the consumer price index counted to 1.9% (y/y) in December, although experts expected 2.1% (y/y). The producer price index also fell to 0.9% (y/y) in December instead of 1.6% (y/y). Today, we expect important economic statistics from the Eurozone and the United States.

The “black gold” prices are consolidating after rapid growth during yesterday’s trading. Oil quotes prices have increased by more than 5%. At the moment, futures for the WTI crude oil are testing $51.65 per barrel.

Market Indicators

Yesterday, the bullish sentiment was observed in the US stock market: #SPY (+0.47%), #DIA (+0.42%), #QQQ (+0.81%).

The 10-year US government bonds yield is falling. Currently, the indicator is at the level of 2.68-2.69%.

The news feed on 10.01.2019:

– ECB monetary policy meeting accounts at 14:30 (GMT+2:00).

We also recommend paying attention to the statistics on the real estate market in the US and the speech by Fed Chairman Powell.

Analytics by JustForex

America’s New Africa Strategy

U.S., China and African Economic Development 

By Dan Steinbock

Recently, the White House released its new U.S. Africa strategy, which seeks militarization and portrays China as a threat. Both are misguided. Africa can greatly benefit from Chinese and U.S. economic development.

On December 13, 2018, U.S. National Security Adviser John Bolton gave a speech in the conservative Heritage Foundation about the Trump administration’s new “Africa strategy,” based on Trump’s ‘America First’ foreign policy doctrine.

In the United States, the media focus was on Bolton’s attack against U.S. adversaries and American aid. Specifically, Bolton accused Russia and China of “predatory practices” in Africa.

In practice, the Trump administration’s Africa strategy implies militarization of U.S. activities in Africa to undermine Chinese economic contribution, which has effectively supported modernization and growth in the continent.

Militarization of U.S. Africa Strategy

In 2017, the United States had a $39.0 billion in total goods trade with Sub-Saharan African countries and a trade deficit of $10.8 billion. America’s largest export markets were South Africa, Nigeria, Ghana, Ethiopia and Angola. In imports, Cote d’Ivoire and Botswana played a role as well.

In the past, U.S. Africa strategy focused mainly on economic cooperation and aid, and secondarily on military cooperation. In the new strategy, the focus areas have been reversed. The ‘America First’ Africa strategy purports to address three core U.S. interests in Africa:

First, advancing U.S. trade and commercial ties with nations across the region to the benefit of both the United States and Africa… Second, countering the threat from Radical Islamic Terrorism and violent conflict… And third, we will ensure that U.S. taxpayer dollars for aid are used efficiently and effectively.

While the first core interest ostensibly involves economic dealings, it actually doesn’t. The Trump administration “wants our economic partners in the region to thrive,” but it downplays all economic efforts to boost African prosperity.

It is the second principle that’s the key to the new U.S. strategy. According to Bolton, “ISIS, al-Qaida, and their affiliates all operate and recruit on the African continent, plotting attacks against American citizens and targets.” The new strategy sees Africa mainly as a base of Islamic terrorism, which must be defused in the continent so that it will not threaten American interests.

Third, the new strategy will no longer support “unproductive, unsuccessful, and unaccountable U.N. peacekeeping missions.”

Moreover, the ‘America First’ stance portrays as adversarial the Chinese efforts to boost global economic integration through the One Road and Belt initiative in emerging and developing economies. China’s economic contribution is mainly an effort to “dominate the world.” As Bolton puts it: “[China’s] predatory actions are sub-components of broader Chinese strategic initiatives, including ‘One Belt, One Road’ – a plan to develop a series of trade routes leading to and from China with the ultimate goal of advancing Chinese global dominance.”

Since economic facts do not support the Trump administration’s narrative, it relies increasingly on ideological trashing.

Chinese Economic Cooperation in Africa

Since the mid-2010s, Washington has accused China of “neocolonialism” in Africa. The misguided narrative seeks to reframe the eclipse of the commodity super-cycle, which caused a drastic fall in commodity prices, as another Chinese plot.

In 2016, the value of China-Africa trade was $128 billion, almost three times bigger than U.S. trade with the continent. The largest African exporters to China comprise Angola, South Africa and the Republic of Congo, whereas the largest buyers of Chinese goods include South Africa and Nigeria. The Sino-African trade increased rapidly some two decades until the fall of the commodity prices since 2014, when the bilateral trade peaked at $215 billion. Since then, the value of African exports to China has been penalized, even as Chinese exports to Africa have remained steady.

Meanwhile, U.S. investment in China has collapsed. U.S. FDI into Africa grew through the Bush years, when the White House still hoped to benefit from the impending industrialization in several African economies. But as the Obama administration presented its Africa vision in the early 2010s, U.S. FDI first plunged and then collapsed (Figure).

Figure Chinese FDI and US FDI to Africa (flows), 2003-2015

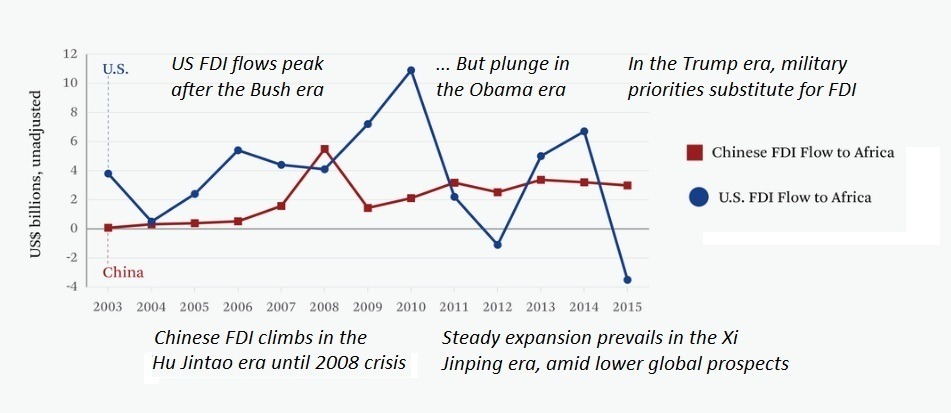
Source: UNCTAD; China Statistical Yearbook; Difference Group


When the administration began its attack against Chinese initiatives last fall, these outbursts were preceded by President Xi Jinping’s speech in the 2018 Forum on China Africa Cooperation (FOCAC) where Xi pledged $60 billion to the continent in loans, grants, and development financing.

The new U.S. Africa strategy is largely dictated by the concern that a has become Africa’s largest economic partner. In contrast to Bolton’s fearful images of Chinese negative impact in Africa, leading business consultancies, including McKinsey, offer very different accounts. The former is based on ideological bashing without facts. The latter reflects simple economic analysis:

Bolton on the U.S. Africa Strategy:McKinsey on China in Africa:
China uses bribes, opaque agreements, and the strategic use of debt to hold states in Africa captive to Beijing’s wishes and demands. Its investment ventures are riddled with corruption, and do not meet the same environmental or ethical standards as U.S. developmental programsThe Chinese “dragons” – firms of all sizes and sectors – are bringing capital investment, management know-how, and entrepreneurial energy to every corner of the continent – and in so doing, they are helping to accelerate the progress of Africa’s “lions,” as its economies are often referred to.


In the past two decades, Africa-China trade has been growing at some 20% per year. FDI has grown twice as fast in the past decade. McKinsey estimates China’s financial flows to Africa are 15% higher than official figures when non-traditional flows are included. China is also a large and fast-growing source of aid and the largest source of construction financing, which support Africa’s ambitious infrastructure developments.

But is Chinese infrastructure investment in Africa a threat to U.S. interests, really?

U.S., China, and Africa: Two Scenarios

Ever since the release of the U.S. administration’s new 2017 National Security Strategy, China has been perceived as America’s “adversary” rather than a partner: “For decades, U.S. policy was rooted in the belief that support for China’s rise and for its integration into the post-war international order would liberalize China.”

The new Africa strategy is actually based on the old neoconservative Wolfowitz Doctrine, which in the early ‘90s deems that the American goal must be “to prevent the re-emergence of a new rival, either on the territory of the former Soviet Union or elsewhere that poses a threat.” That’s why the White House sees its China ties mainly in win-lose terms.

But there is another future scenario that sees the multipolar world economy as a strength rather than a liability. It is predicated on more stable, global prospects as developing economies focus on economic development, instead of militarization. Unlike the U.S. Africa strategy, the multipolar scenario would not foster “major power competition” in Africa. Rather, it supports a win-win scenario, in which both America and China would trade and invest, and provide development aid to African economies. That would accelerate modernization and industrialization across the continent and thus living standards. With rising prosperity, terror would diminish.

The multipolar scenario would fulfill the three U.S. core interests in Africa and foster triangular economic ties among the U.S., China and Africa, while intensifying modernization in the continent.  In contrast, the old new U.S. Africa strategy has potential to undermine such futures.

About the Author:

Dan Steinbock is the founder of Difference Group and has served at the India, China and America Institute (US), Shanghai Institute for International Studies (China) and the EU Center (Singapore). For more, see http://www.differencegroup.net/    

The original version was released by China-US Focus on January 9, 2018