Technical Traders Ltd. is issuing new analysis which indicates the US and global markets may be poised for a dramatic upside price swing over the next couple. Recent events have driven asset class values to new valuations that may change the dynamics of markets for a few months. Prior to August/September 2018, many traders were fearful of the expectations of the US Federal Reserve, Global Trade Issues and the US Elections. Combine this with the end of the year liquidity issues and the threat of a US government shutdown over the wall funding and we have almost a perfect storm brewing for uncertainty and fear.
Now, it appears, our custom global market indexes are showing signs that a bottom may have formed over the past few weeks and that the global equities markets may be poised for an upside move in the range of +10% to +20% over the next 2-4 months.
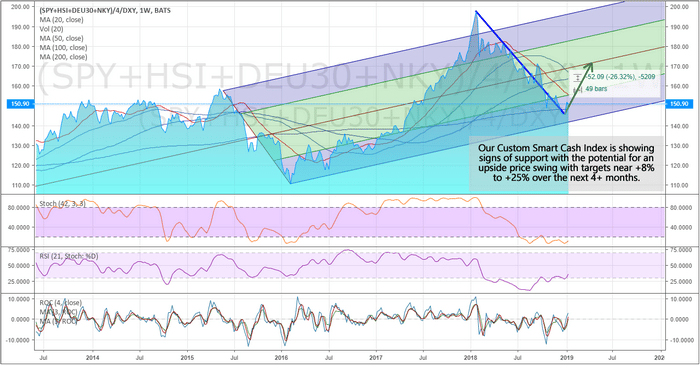
“What changed over the past month?”, you might be asking? Valuation levels have changed. The chart below is a Weekly chart of our Custom Smart Cash index. We use this as a measure of global equity market valuation and to determine if and when pricing levels are changing in terms of total market capitalization. We can see from early 2018, the global markets peaked and began to move lower. Even though the US markets pushed higher throughout this time, the total global markets continued to deteriorate. Now, the valuation levels are near historic channel support and have begun to flip back to the upside (at least in the immediate term). If this continues as capital re-enters the global capital markets in search of undervalued opportunities, this capital will find quite a few opportunities in beaten up global equities. Pay attention because this could be the setup of a market bottom with relatively strong upside potential.
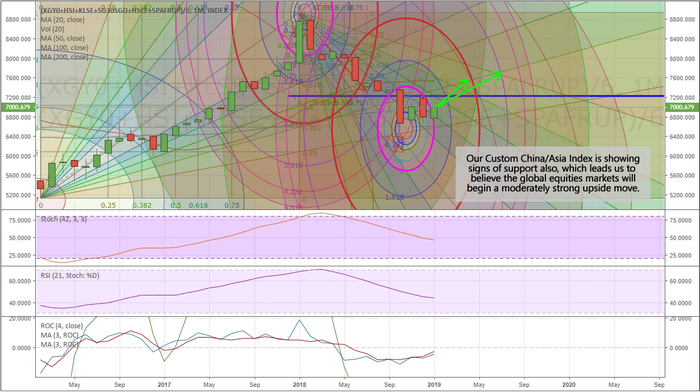
One item to pay attention to is our Custom China/Asia index. This chart, below, is a Monthly Custom China/Asia market index. It may be somewhat hard to understand with all of these Fibonacci Arcs drawn on it, but to us, this is a very clear chart. These Arcs are an advanced way to look at Fibonacci price support and resistance. We look for how these arcs relate to price activity and how they converge in past and future price points. Our belief is that each price move initiates and perpetuates with a certain energy level and frequency. If we are able to identify this level and frequency, then we may be able to attain greater knowledge of the future price turning points, support, resistance, and other key information. As you can see, the bottom on this chart occurred right within the Top Arc’s primary frequency levels near 4.5x the base frequency level – or 2x the immediate frequency level. This is a fairly common level for the price to form tops/bottoms. 2X equals 200% of an immediate price level energy frequency.
We believe China/Asia may experience an upside price swing of nearly +8 to +15% over the next couple of months as the global markets attempt a price recovery. This means that there may be some opportunity in the Asian markets through April/May 2019. We urge investors to be cautious of the Summer months of 2019 because we don’t expect this move to last long.
This means skilled traders will be able to find and execute a broad range of successful and profitable trading opportunities over the next 2 to 4 months. Get ready for 2019 to be a very good year for traders and learn how our daily market research, stock, ETF, and futures trading signals can save your time and money. Start executing the best opportunities today with TheTechnicalTraders.com.
Asian Protests and Imperial Japan’s Sexual Slavery
By Dan Steinbock
Recently, another Philippine statue commemorating Filipino “comfort women” has been removed. As international pressure is rising, it is time for Abe government to acknowledge its wartime history. Most of Japan recognizes it.
In December 2017, a memorial was erected along the Roxas Boulevard facing Manila Bay. It commemorated the Filipino “comfort women”, who were forced to work as sexual slave labor in Japanese military brothels during World War II.
In late April 2018, after Japan’s Ministry of Foreign Affairs said it was “extremely regrettable” such statues were erected, the Department of Public Works removed the statue. As Japan has an important role in infrastructure investment, President Duterte suggested the statue could be placed in a private property.
On December 28, another statue for the former “comfort women” was installed in a Catholic-run shelter for the elderly and the homeless in San Pedro, Laguna. After the Japanese embassy in Manila stated such statues were “extremely disappointing, not compatible with the Japanese government,” the statue was removed two days later.
Filipina Comfort Woman Memorial (Manila, Dec 8, 2017 – April 27, 2018)
Source: Wikipedia
Statue of a Comfort Woman – In front of the Japanese Embassy, Seoul
Source: Wikipedia
This time the Duterte government noted that the statue was “dedicated to peace and women’s empowerment,” used private funds and was built inside private property. It was freedom of expression. Lila Pilipina, an advocacy group for Filipina comfort women, stressed the Japanese government demands that we “forget its war crime.”
The removal of the second statue fosters a perception there is a systematic effort by the Shinzo Abe government to eradicate public statues for “comfort women.” By the same logic, all Holocaust memorials should be taken down, along with other memorials dedicated to historical atrocities because they all are inconvenient reminders about the past. Yet, German government has a very different stance toward the Nazi era. Mental lobotomy does not prevent real-life tragedies.
Until 1993, Japanese government had denied that the history of the “comfort women.” But that year, after the government study, Chief Cabinet Secretary Yohei Kono recognized that Japanese Imperial Army had forced “comfort women,” to work in military-run brothels during World War II. In 2015, Kōno re-affirmed the statement.
So why is the Abe administration to revise history? The reasons are historical – and perhaps personal.
Sexual slavery, Nobusuke Kishi and Cold War
Today, the number of Japan’s wartime sex slaves is estimated at 200,000 women, although Chinese scholars in Shanghai, where a Japanese “comfort station” was established already in 1932, put the real figure at 360,000-400,000.
In revisionist Japanese history, the role of these women has been downplayed. The very term “comfort women” is a euphemism for Japanese Imperial Army’s sex slaves. Most women were from areas occupied by Japan, particularly China and Korea, but also the Philippines. There were “comfort stations” in Myanmar, Thailand, Vietnam, Malaysia, Taiwan, Indonesia, Singapore, East Timor and elsewhere. There were also hundreds of “comfort women” from the Netherlands and Australia.
Unlike his predecessors as Prime Minister and the head of the Liberal Democratic Party, Abe has far-right views about history. He belongs to the ultranationalist Nippon Kaigi, which seeks to re-militarize Japan and to revive Imperial Japan and which, among other things, vehemently denies Japan’s “comfort women” history during World War II. That’s why in the late 1990s, he led the controversial Japanese history textbook reform, which downplayed Japan’s war crimes, including crimes against “comfort women.”
But there is also a more personal reason. Abe comes from a political family dynasty. His grandfather Kan Abe and father Shintaro Abe were prominent politicians. His mother is the daughter of the highly controversial former Prime Minister Nobusuke Kishi. Starting in 1933, Kishi praised Nazi Germany as Japan’s model. In 1937, he signed a degree calling for the use of slave labor in Japanese puppet state Manchukuo. The enslavement of men paved the way to the exploitation of Chinese, Korean and other women as sex slaves in Japan’s occupied colonies in Asia.
Due to Kishi’s brutal rule in the Manchukuo and his participation in the Tojo War Cabinet during World War II, he was imprisoned for over three years as a Class A war criminal. In Germany, Nazi leaders were prosecuted, but not in Japan. When Washington launched its Cold War against the Soviet Union, it needed Japan as a key ally in Asia.
That’s when many Japanese war leaders were freed and enlisted by the U.S. to suppress Japanese communists and socialists. The most notable of them was Kishi, “America’s favorite war criminal.” who played a key role in the “1955 System,” which made the Liberal Democratic Party the dominant political force in Japan and America’s key ally until today.
Rising stakes in the international debate
Wartime sex slaves are not “just history.” While Abe’s reformers have tried to open the economy to more women, his politics promotes remilitarization that most Japanese oppose. And while Japan is one of the world’s major economies, it ranks only 110th worldwide in the Global Gender Report, far behind Myanmar and India. The lingering imperial fantasies contribute to Japan’s economic decline.
Forced silence about wartime sexual slavery is not acceptable in rest of Asia. In December, 2015, Abe and South Korean President Park Geun-hye, who was later impeached for corruption, agreed to settle the “comfort women” dispute. Tokyo would pay a paltry $8.3 million to a fund supporting remaining victims. South Korea would remain mum about the issue and remove a memorial statue for the victims.
South Koreans criticized the odd pact. After the imprisonment of the corrupt Park, Seoul began to demand recognition for its victims, along with a UN Committee (CEDAW). The UN human rights agency (OHCHR) also called on Japan to acknowledge its violation of the human rights of “comfort women,” take legal responsibility and punish responsible individuals.
As international appeals did not work, the debate moved to a new stage. Recently, a South Korean court authorized the seizure of assets belonging to Nippon Steel & Sumitomo Metal, after the Japanese firm failed to comply with an earlier order to compensate victims of forced labor. Last week, Tokyo called the court decision “extremely regrettable,” while South Korean President Moon Jae-in urged Japan not to “politicize the issue” and to take a “more humble” attitude towards the past.”
The issue of the “comfort women” should not be politicized. As the Kono Statement evidences, most of Japan’s political leadership and most Japanese have acknowledged the “comfort women” history since the early 1990s. As polls indicate, only about a fifth of the population doesn’t – and that’s Abe’s core constituency.
If the Abe administration fails to acknowledge the past, it cannot win the future that overshadows over a prosperous, but heavily indebted and declining nation.
The statues to commemorate the legacy of “comfort women” represent historical veracity and overdue moral right. Efforts to eradicate them will ultimately fail. When one is taken down, another will be erected elsewhere – until the truth prevails.
About the Author:
Dr. Dan Steinbock is an internationally recognized strategist of the multipolar world.and the founder of Difference Group. He has served at the India, China and America Institute (US), Shanghai Institutes for International Studies (China) and the EU Center (Singapore). For more, see https://www.differencegroup.net/
The original commentary was published by The Manila Times on January 14, 2019
Will Negative Social Mood Oust Trump? Watch the Stock Market
By Elliott Wave International
Special Q&A With Alan Hall on Elections and Impeachment
At the end of this article you’ll have the opportunity to hear Alan discuss his impeachment research with ETV Correspondent Dana Weeks.
You cannot afford to miss Alan’s insightful political analysis. Please login to view the interview after reading the article.
Those who want President Trump to stay in office should hope the stock market rises, and those who want him ousted should hope it crashes.
Why? History shows that the stock market is a useful indicator of people’s attitudes toward the president. Socionomic theory proposes that society’s overall mood regulates both stock prices and the public’s perceptions of its leaders. Positive social mood makes society feel optimistic, bid up stock prices and credit leaders for their good feelings. Negative social mood makes society feel pessimistic, sell stocks and blame leaders for their bad feelings.
These tendencies are evident in presidential re-election outcomes. Presidents Hoover and Carter, for example, lost bids for re-election during trends toward negative social mood as reflected by declining stock prices. In fact, the stock market is a better re-election indicator than inflation, unemployment and GDP growth combined, as my colleagues at the Socionomics Institute demonstrated in a 2012 paper.
Social mood’s influence is also evident in the results of U.S. presidential impeachments and near-impeachments. Twice in history the U.S. House of Representatives has voted to impeach a president. In both cases social mood was trending positively, as reflected by rising stock prices, and in both cases the Senate voted for acquittal.
Figure 1
Figure 1 illustrates the timing of the first presidential impeachment. On March 2, 1868, the House of Representatives formally agreed to eleven articles of impeachment against President Andrew Johnson. The Senate took three separate votes, and each fell one vote short of the two-thirds majority necessary to remove Johnson from office. The Senate acquitted Johnson on May 26, 1868, during a stock rally that added to the 250% increase since October 1857.
Figure 2
Figure 2 shows that a substantial trend toward positive social mood preceded President Bill Clinton’s impeachment in the House and subsequent acquittal in the Senate. Note that some of the most serious events in the Monica Lewinsky scandal coincided with the largest downturn in the Dow during Clinton’s presidency. Yet, as the Dow recovered, so did Clinton’s approval ratings. And despite a $70-million prosecution of Clinton’s related perjury and obstruction of justice charges, the Senate acquitted the president as positive social mood lifted the Dow, Dow/gold and Dow/PPI to important peaks.
Figure 3
President Richard Nixon’s near-impeachment and resignation from office serves as a textbook case of how social mood influences the fortunes of public figures. Figure 3 shows the Dow Jones Industrial Average surrounding his time in office. The soon-to-be infamous Watergate break-in occurred toward the end of a strong 67% rally in the Dow from May 1970-January 1973. That trend toward positive mood helped Nixon win re-election in a landslide. But as mood trended toward the negative, the public’s view of its leader darkened, its appetite for scandal increased, the investigation accelerated, and Nixon’s fortunes changed. With almost certain impeachment looming, Nixon became the first president to resign from office on August 9, 1974.
Figure 4
What does this history tell us about the probability that President Trump will serve a full term in office? We considered this question in the June 2017 issue of The Socionomist. Figure 4 is a chart from that issue, updated to the present. It depicts the trend of social mood as reflected by the Dow. We left the gray arrows showing our 2017 analysis in place, and we added red arrows to indicate the possibilities going forward. In July 2017, Congressman Brad Sherman formally introduced an article of impeachment against the president in the House of Representatives. Yet as the market rose during 2017, President Trump–despite low approval ratings, tremendous staff turnover, unrelenting criticism from the political left and numerous indictments and charges of Trump associates in the ongoing Mueller investigation–did not face an impeachment vote. After the stock market peaked on January 26, 2018, however, the tone changed, and even some on the political right became more critical of the president.
Since the October 3 stock market peak, disapproval of the president has grown steadily louder and more strident. At the same time, the Mueller investigation has implicated more and more of the president’s inner circle in illegal activities. The Democrats won control of the House in the 2018 midterms. A November 26 Gallup poll revealed Trump’s disapproval rating had hit an all-time high. On December 10, Fox News’s senior judicial analyst Andrew Napolitano said Trump could be charged with “three separate crimes and could be indicted while serving as president.” By December 17, the Mueller investigation had issued more than 100 criminal counts and charged 34 people, 10 of whom have been found guilty. That same day, Wired published its list of “All 17 (Known) Trump and Russia Investigations” and said, “it’s increasingly clear that, as 2018 winds down, Donald Trump faces a legal assault unlike anything previously seen by any president.”
In the weeks since, the Trump Foundation agreed to dissolve, and Secretary of Defense James Mattis and diplomat Brett McGurk have resigned. On December 24, Time reported, “National Christmas Tree to Stay Dark During Holiday Due to Government Shutdown,” and several news organizations ran stories with versions of The Atlantic’s headline, “President Trump’s Nightmare Before Christmas,” as the stock market plunged. Of course, stalwart supporters of the president remain. Yet the number of oppositional voices is rising. A December 19 NBC News/Wall Street Journal poll found that 41% of Americans favor impeachment hearings.
We don’t know what the Mueller investigation will ultimately reveal, but for Trump, the facts may not matter as much as the social mood. Fasten your seatbelt and keep your eyes on stock market indexes, our best reflection of the trend of social mood.
You’ve read his essay, now hear from Alan Hall himself — including how he connects the dots from election research to impeachment, plus how he hopes to “get thru” to people whose minds are already made up.
Don’t have an EWI Login? No worries! Join Club EWI, our free Elliott wave educational community, and gain free access to this resource plus a full catalog of other valuable lessons. Plus, we’ll keep you updated with new resources, exclusive invitations, and deals.
This article was syndicated by Elliott Wave International and was originally published under the headline Will Negative Social Mood Oust Trump? Watch the Stock Market. EWI is the world’s largest market forecasting firm. Its staff of full-time analysts led by Chartered Market Technician Robert Prechter provides 24-hour-a-day market analysis to institutional and private investors around the world.
With the popularity (and price) of Bitcoin skyrocketing, new users are wondering “Is Bitcoin Safe?” while early adopters are focusing on securing their new digital wealth. When it comes to the safety of Bitcoin, there is one major consideration: Is the Bitcoin network secure?
What is Bitcoin?
Bitcoin is an alternative peer to peer electronic payment system that relies on ledgers and cryptographic proof rather than trust. Allowing two parties to transact directly with each other, Bitcoin is founded on the following features:
Peer-to-peer payments over an online network.
The elimination of third parties and replacing trust with verification.
Transactions would be irreversible, protecting sellers from fraud.
A peer-to-peer distributed timestamp server would generate mathematical proof of the chronological order of transactions.
Can Bitcoin be Hacked?
There are frequent reports of hackers stealing millions of dollars in Bitcoin, so it must be pretty easy to hack, right? Not so fast. It’s very important to understand the difference between Bitcoin the cryptocurrency and the Bitcoin blockchain, the technology enabling the cryptocurrency craze. We must also consider the insecurities of crypto exchanges before we arbitrarily decide if the Bitcoin network is secure or not. But be sure to look out for these cryptocurrency scams.
What is the Bitcoin Blockchain?
Digital currency is not a new concept. Before its wide adoption, one of the inherent roadblocks to a successful digital currency was the “double spending problem.” Because the currency is digital, how do you prevent people from simply copy/pasting their money and spending the same $20 over and over? Bitcoin solved this problem with the novel concept of distributed blockchaining for decentralized ledgering and verification of transactions around digital currencies—In short, a kind of online distributed ledger. To dive deeper into Bitcoin and its technology, check out the original whitepaper, Bitcoin: A Peer-to-Peer Electronic Cash System,by Satoshi Nakamoto, the pseudonymous creator of Bitcoin.
The idea is simple. Just as a finite amount of gold exists in the world, only a certain amount of Bitcoin can be mined from cryptoland. Moreover, each electronic “coin” is a chronological series of verified digital signatures, and the history of all transactions for each “coin” must be publicly revealed. By making all transactions public, everyone knows how much Bitcoin each person has. The network of Bitcoin participants reaches a consensus on which transactions are valid based on the balance of each account. In order to hack the Bitcoin network, you would need to control more than 50% of the voting power in the network to validate your own fraudulent transactions.
In Bitcoin’s network, the amount of computing power that you contribute to the network is equivalent to your voting power. As of the writing of this article, the bitcoin network’s computing power (or hash rate in crypto lingo) was 14.7 exahashes per second (for reference, 1 exabyte = 1 billion gigabytes). Google was approximated to have computing power equal to about 0.001 exahashes per second back in 2015. At that point in time, the hash rate of the bitcoin network was about 0.5 exahashes per second (i.e. 500x more than Google).
So can the bitcoin network be hacked? Yes. But you need to amass at least 250x the computing power of Google which will cost you more than the value of the bitcoin you could steal. Good luck with that.
How are People Losing their Bitcoin to Hackers?
To date, no one has been able to compromise the core Bitcoin network. Every major Bitcoin or cryptocurrency hack exploited vulnerabilities in third-party applications, crypto exchanges, or insecure crypto web sites. Third-party applications, crypto exchanges, and websites make it easier for people to interact with the Bitcoin network. Online wallets, or e-wallets, allow you to buy, sell, and store your Bitcoin. If your e-wallet provider is compromised, your account’s password and private key would be at risk, and hackers would be able to transfer money out of your account. This isn’t a vulnerability in the Bitcoin network, but in the third-party application. If you’re interested in some previous hacks/scams involving bitcoin you can check out our blog post from last year on the dangers and pitfalls of bitcoin.
There are also individual accounts getting hacked from tried and true phishing, social engineering, and malware attacks that don’t ever make the news.
How do you Keep your Bitcoin Safe from Hackers? Bitcoin Security Best Practices
Given that the network is cryptographically and mathematically proven to be secure, you should focus on securing the accounts you use to buy, sell, trade, and store your Bitcoin. Follow security awareness best practices so that your username, password, and private key don’t get stolen. If you’re new to security awareness, we have a lot of free resources available as well as some courses for purchase.
You should also consider using a hardware wallet. While e-wallets are more convenient, they are much more susceptible to basic phishing, social engineering, or malware attacks that trick you into revealing your password and private key. Hardware wallets, essentially USB drives with extra built-in security, require you to push buttons on the physical device to confirm a transaction, so a hacker would have to be in physical possession of your hardware wallet to steal your Bitcoin.
It’s unquestionably an eventful time in the world of cryptocurrency and blockchain. If you want to participate in the space, just make sure you’re willing to accept the associated risk and to minimize that risk by doing everything you can to secure your digital assets and identity.
The major currency pair retreated last Friday and this decline continues today, January 14. So far, EURUSD investors are analyzing the news and macroeconomic reports and trying to escape risks. It supports the USD and puts pressure on stock indexes. At the same time, investors barely paid any attention to the CPI report published by the USA last week.
According to the report, the inflation lost 0.1% m/m in December, just as expected. By the way, in November the indicator did not change. It is the lowest CPI value since March 2018. On YoY, the indicator was 1.9% in December after being 2.2% the month before. It is interesting that the Core CPI expanded by 0.2% m/m at the end of 2018.
Talking about investors trying to escape risks, everything remains the same: duration of the Government Shutdown in the USA reached stratospheric levels. Several agencies haven’t been operating for almost 24 days. The Congress still hasn’t agreed on financing the Mexican issue, that’s why policymakers can’t get back to work: they are on unpaid leave and this is rather negative signal.
As long as the American Government doesn’t restore its routine operations, the USD will have a chance to recover and get stronger.
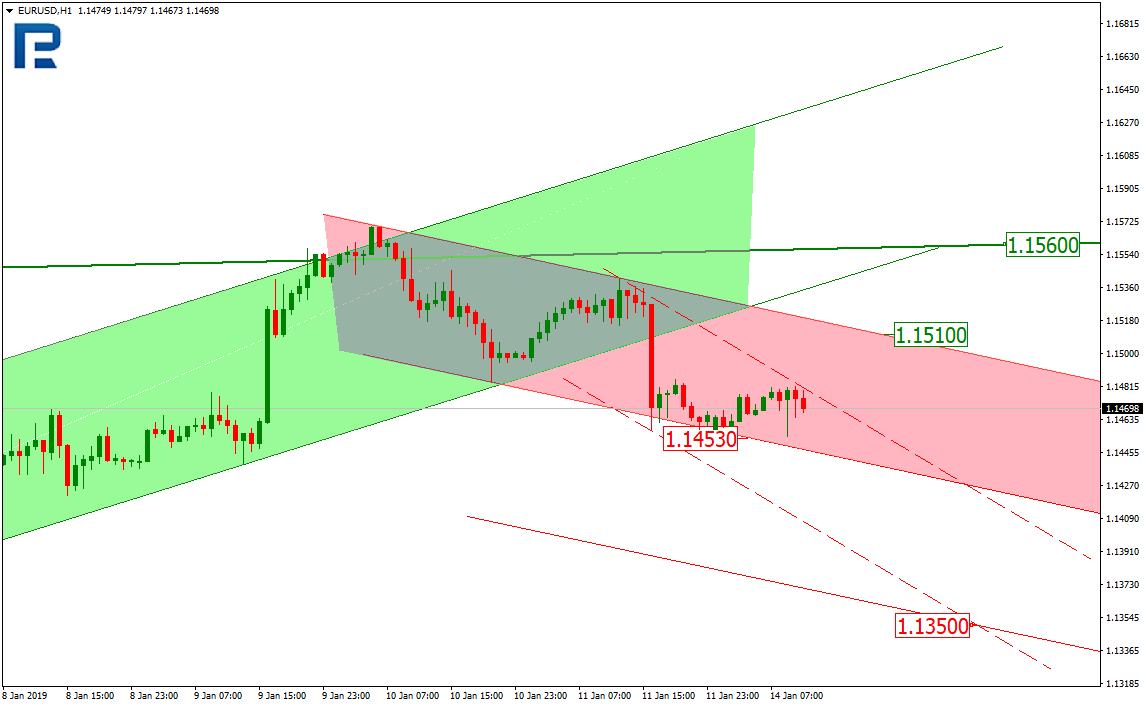
From the technical point of view, EURUSD is trading inside a mid-term ascending correctional channel. Currently, the pair has rebounded from the mid-term resistance line and right now is forming a short-term downtrend. In the H1 chart, one can see that the price is testing the downside border of the current channel. If the pair breaks the support line at 1.1453, the instrument may continue falling towards the projected support line at 1.1350. Another possible scenario implies that the price may complete the current downtrend and resume trading upwards to reach the resistance line at 1.1510. If the pair breaks the local resistance level, the instrument may start a new impulse inside the mid-term correctional trend with the closest target at 1.1560.
Disclaimer
Any predictions contained herein are based on the authors’ particular opinion. This analysis shall not be treated as trading advice. RoboForex shall not be held liable for the results of the trades arising from relying upon trading recommendations and reviews contained herein.
EURUSD has rebounded from 1.1537 and reached the predicted downside target at 1.1461; right now, it is consolidating above the latter level. Today, the pair may move downwards to reach 1.1440. Later, the market may grow to return to 1.1461 and then form a new descending structure with the target at 1.1386. This structure may be considered as the third descending wave.
GBPUSD, “Great Britain Pound vs US Dollar”
GBPUSD is still consolidating above 1.2758. Possibly, today the pair may fall to reach 1.2787 and then grow towards 1.2825. After that, the instrument may continue consolidating and form a new descending structure with the target at 1.2725.
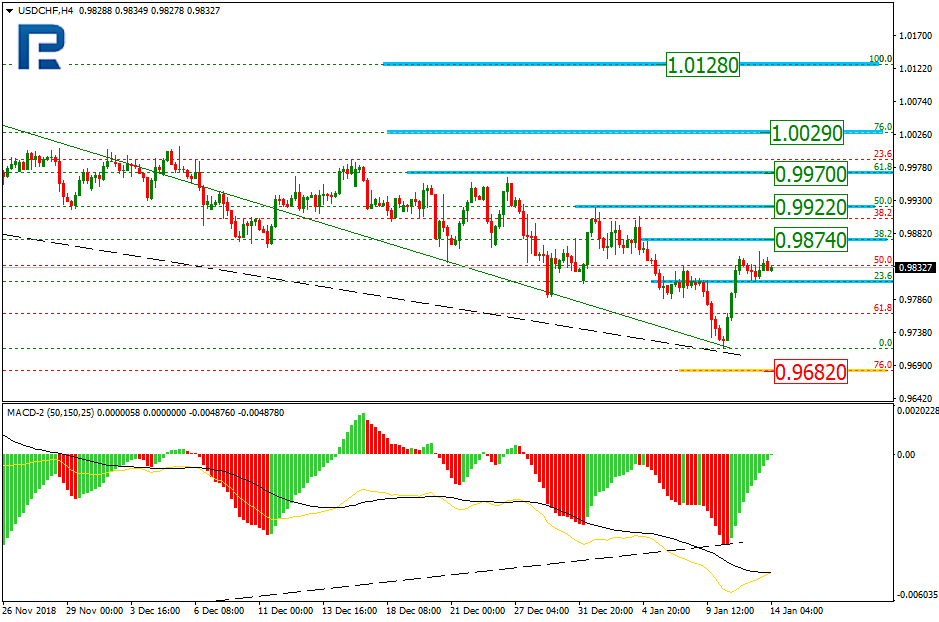
USDCHF, “US Dollar vs Swiss Franc”
USDCHF is consolidating at the top. Today, the pair may reach 0.9862 and then fall towards 0.9791. Later, the market may form one more ascending structure to return to 0.9862, break it, and then continue growing with the target at 0.9920.
USDJPY, “US Dollar vs Japanese Yen”
USDJPY is trading downwards to reach 107.51. After that, the instrument may start a new growth towards 109.31 and then form a new descending structure to return to 107.51, break it, and then continue trading inside the downtrend with the target at 105.95.
AUDUSD, “Australian Dollar vs US Dollar”
AUDUSD has completed the descending impulse along with the correction; right now, it is forming the second descending impulse with the target at 0.7129. Later, the market may resume growing towards 0.7186 and then start a new decline to reach 0.7022.
USDRUB, “US Dollar vs Russian Ruble”
USDRUB is still trading around 66.98. Possibly, today the pair may expand the range towards 67.32. After that, the instrument may resume falling to reach 66.50 and then start a new correction with the target at 68.13.
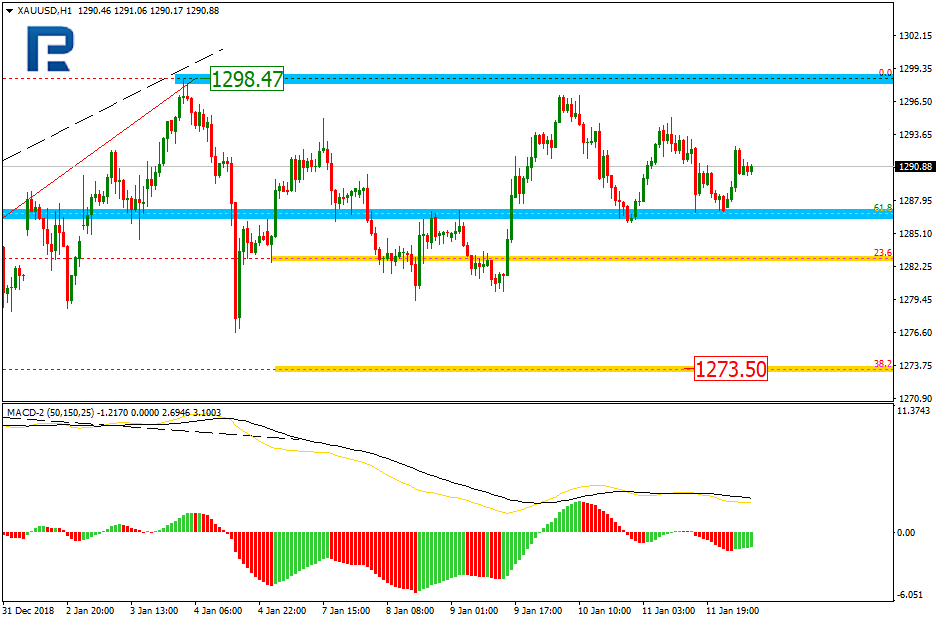
XAUUSD, “Gold vs US Dollar”
Gold is still consolidating at the top. Possibly, the pair may expand the range towards 1297.60 and then resume falling to reach 1282.22. Later, the market may form one more ascending structure to reach 1300.00 and then start a new decline with the target at 1276.50.
BRENT
Brent has finished the first descending impulse along with the correction; right now, it is forming the second impulse with the target at 58.86. After that, the instrument may reach 60.06 and then form a new descending structure towards 57.66. Later, the market may resume growing with the target at 64.34.
Attention! Forecasts presented in this section only reflect the author’s private opinion and should not be considered as guidance for trading. RoboForex LP bears no responsibility for trading results based on trading recommendations described in these analytical reviews.
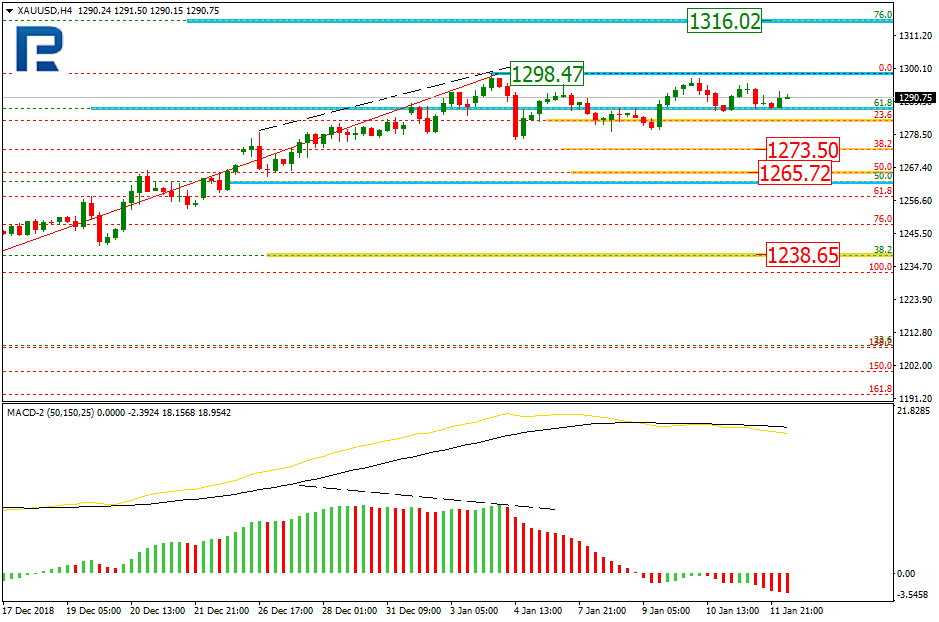
As we can see in the H4 chart, XAUUSD is being corrected sideways and may break the range both upwards and downwards. By now, the pair has been corrected to the downside by 23.6% and may continue trading towards the retracements of 38.2 and 50.0% at 1273.50 and 1265.72 respectively. However, if the price breaks the high at 1298.74, the instrument may resume growing to reach its mid-term target at 1316.02 (the retracement of 76.0%). The support level is at 1238.65.
In the H1 chart, the pair is consolidate inside the convergent triangle range. In this case, there is a high possibility that the price may break the range to the upside.
USDCHF, “US Dollar vs Swiss Franc”
As we can see in the H4 chart, the correctional downtrend continues; USDCHF has already reached the retracement of 61.8%. At the same, time, there was a huge convergence on MACD, which may indicate a new impulse to the upside. The possible targets are the retracements of 38.2%, 50.0%, 61.8%, and 76.0% at 0.9874, 0.9922, 0.9977, and 1.0029 respectively. The key resistance level is the high at 1.0128.
In the H1 chart, the pair has reached the retracement of 23.6% and right now is trading sideways.
Attention! Forecasts presented in this section only reflect the author’s private opinion and should not be considered as guidance for trading. RoboForex LP bears no responsibility for trading results based on trading recommendations described in these analytical reviews.
On Friday, the US dollar strengthened slightly against a basket of major currencies. Important economic data were published in the US, which met the expectations of investors. Thus, the core consumer price index counted to 0.2%, which matched the forecasts of experts. The dollar index (#DX) closed in the positive zone (+0.15%).
On Friday, the British pound strengthened against the US dollar despite the ambiguous economic statistics. The GDP indicator (m/m) increased by 0.2% instead of 0.1%. The volume of production in the manufacturing industry decreased by 0.3% in November, while experts expected an increase of 0.4%. Monthly GDP 3m/3m change counted to 0.3%, which matched the investors’ forecasts. At the moment, financial market participants expect the Brexit vote, which will be held tomorrow on January 15. Analysts believe that Parliament will not approve the bill.
The “black gold” prices have been declining. At the moment, futures for the WTI crude oil are testing the mark of $51.00 per barrel.
Market Indicators
On Friday, there was a variety of trends in the US stock market: #SPY (+0.04%), # DIA (-0.05%), #QQQ (-0.37%).
The 10-year US government bonds yield has been declining again. Currently, the indicator is at the level of 2.67-2.68%.
The news feed on 14.01.2019:
– Industrial production in the Eurozone at 12:00 (GMT+2:00).
On Friday the EUR/USD currency pair was in a bearish mood. The quotes lowered by more than 80 points. Important economic reports from the US were published, which have proven true the investors` expectations. For example, the basis consumer price index was 0.2% which fit the experts` expectations. Right now the trading instrument is consolidating in the 1.14500-1.14900 range, you should open positions from these levels.
The Economic News Feed for 14.01.2019:
– Report on the Volume of Industrial Production in EU – 12:00 (GMT+2:00).
The indicators do not provide precise signals. The price is being traded between 50 MA and 200 MA.
The MACD histogram is in the negative zone but above the signal line which gives a weak signal to sell EUR/USD.
The Stochastic Oscillator is in the negative zone but above the signal line which gives a weak signal to sell EUR/USD.
Trading recommendations
Support levels: 1.14500, 1.14100, 1.13700
Resistance levels: 1.14900, 1.15400, 1.15800
If the price fixes below the local support level of 1.14500, consider selling EUR/USD. The movement will tend toward 1.14100-1.13700.
Alternatively the currency pair can grow toward 1.15400-1.15600.
The GBP/USD currency pair
Technical indicators of the currency pair:
Prev Open: 1.27372
Open: 1.28538
% chg. over the last day: +0.74
Day’s range: 1.28221 – 1.28315
52 wk range: 1.2438 – 1.4378
On Friday GBP/USD saw an aggressive buy-out after the publication of weak economic reports. The GDP (m/m) grew by 0.2% instead of 0.1%. The production volume in the processing industry lowered by 0.3% instead of growing by 0.4% as expected. The monthly GDP (3m/3m) grew by 0.3% which fits with the investors` expectations. The quotes grew by 100 points. Right now the key support and resistance levels are 1.28000 and 1.28600 respectively. You should open positions from these levels but expect a technical correction soon.
The Economic News Feed for 14.01.2019 is calm.
The indicators point toward the power of the buyers, the price fixed above 50 MA and 200 MA.
The MACD histogram is in the positive zone but below the signal line which gives a weak signal to buy GBP/USD.
The Stochastic Oscillator is in the neutral zone, the %K line is crossing the %D line. There are no precise signals.
Trading recommendations
Support levels: 1.28000, 1.27500, 1.27000
Resistance levels: 1.28600, 1.29000
If the price fixes below the round 1.28000 expect a technical correction of GBP/USD quotes toward 1.27500-1.27000.
Alternatively the currency pair grow toward 1.29000-1.29200.
The USD/CAD currency pair
Technical indicators of the currency pair:
Prev Open: 1.32311
Open: 1.32572
% chg. over the last day: +0.23
Day’s range: 1.32643 – 1.32742
52 wk range: 1.2248 – 1.3664
On Friday USD/CAD had shown a bullish mood. The trading instrument is moving sideways. The key support and resistance levels are 1.32500 and 1.33000 respectively. Positions should be opened from the key levels, expect further growth.
The Economic News Feed for 14.01.2019 is calm.
The price fixed between 50 MA and 200 MA which act as the dynamic levels of support and resistance.
The MACD histogram is in the positive zone but below the signal line which gives a weak signal to buy USD/CAD.
The Stochastic Oscillator is in the neutral zone, the %K line is below the %D line which gives a weak signal to sell USD/CAD.
Trading recommendations
Support levels: 1.32500, 1.32000
Resistance levels: 1.33000, 1.33400, 1.34000
If the price fixes above the round 1.33000 expect the quotes to grow toward 1.33400-1.33600.
Alternatively the currency pair can descend toward 1.32000-1.31700.
The USD/JPY currency pair
Technical indicators of the currency pair:
Prev Open: 108.425
Open: 108.512
% chg. over the last day: +0.12
Day’s range: 108.102 – 108.198
52 wk range: 104.56 – 114.56
The USD/JPY quotes are still showing an ambiguous technical picture. The quotes are consolidating around the 108.000-108.500 range. Investors are waiting for additional drivers. You should open the positions from the key levels.
The Economic News Feed for 14.01.2019 is calm.
The price fixed below 50 MA and 200 MA which indicates a bearish mood.
The MACD histogram is close to 0, there are no signals.
The Stochastic Oscillator is in the neutral zone, the %K line is above the %D line which gives a signal to buy USD/JPY.
Trading recommendations
Support levels: 108.000, 107.500, 107.200
Resistance levels: 108.500, 109.000, 109.500
If the price fixes below the round 108.000 expect thequotes to descend toward 107.500-107.200.
Alternatively the quotes can grow toward 109.000-109.250.
The only question to ask yourself this week is how badly will the first Withdrawal Agreement vote fail in the house of Commons? According to the latest Bloomberg survey, there is on a 15% probability it will pass on the first attempt.
Why?
The vote on Wednesday morning is scheduled to cover the same Brexit Withdrawal Agreement handed down by Brussels and agreed upon by Theresa May in late November. The same Agreement that was never voted on in December after it became apparent it would overwhelmingly be rejected by the House. Thus the 15% probability it will pass Parliament.
GBP fell to its lowest level since November last week as the PM suffered two humiliating defeats on the floor of Parliament. The second vote, in particular, is the most humiliating for the following reason. If Wednesday morning’s vote falls, the PM has three days to amend the Agreement before it must be a vote on again. If this fails, Parliament can take effective control of the Brexit Agreement agenda basically making Theresa May a lame duck and will manufacture a new Agreement proposal.
Interestingly enough this should be a GBP positive, as it appears there is support across Parliament at large for “no Brexit” than for “no deal”.
GBP: wants to go higher but can it?
Since around the middle of December when the first vote never materialized GBP has remained stuck in a range. That in itself is interesting considering the USD weakness that has greeted us in 2019.
However, how this week’s vote pans out may offer clues as to the likely direction of GBP going forward. If there is a close defeat of the first vote leading to a ‘renegotiation’ that saw a second vote passing an agreement, this would be a clear positive however in Cable case this might actually be a strong mover considering the pair is one of the only pairs not to move on the USD’s weakness.
Conversely, a heavy defeat may be taken as a negative, as it would suggest no renegotiation could take place and the possibility of a no-deal or a general election would become the most likely scenarios, this would most likely push GBP lower, even back to levels not seen since July 2016.
USD: Still seeing the downside
Holding the line with my USD weakness call, you only have to look at the movement in the AUDUSD since the flash crash to see why (has moved through 5 cents).
The main reasoning is the consistent and collaborative communication from Fed officials. Clear examples of this:
In relation to the planned rate rises in 2019, Chairman Powell said: “the better way to think about it is that there is no such plan”.
Then on the balance sheet unwind, Vice Chairman Clarida said: “If we find that the ongoing program of balance sheet normalization…no longer promotes the achievement of our dual-mandate goals, we will not hesitate to make changes.”
Dovish Fed talk will mean dovish price action in the USD. The best test for this is if talk becomes action – this makes March very interesting. Short DXY call remains.