Yesterday, the US dollar strengthened against a basket of major currencies despite weak economic statistics. Thus, the NY Empire State manufacturing index counted to 3.90 in January, while experts expected 10.75. The producer price index fell by 0.2% instead of 0.1%. However, the dollar index (#DX) closed yesterday in the positive zone (+0.38%).
Yesterday, the Brexit vote took place in the British Parliament, as result members of Parliament rejected the Brexit deal proposed by Theresa May. Such a situation may lead to the UK exit without a deal, or a second referendum will be held. Prime Minister Theresa May has only three days to submit the Brexit backup plan.
The “black gold” prices are rising. At the moment, futures for the WTI crude oil are testing the mark of $52.15 per barrel. At 17:30 (GMT+2:00), a report on crude oil inventories will be published in the US.
Market Indicators
Yesterday, the bullish sentiment was observed in the US stock market: #SPY (+1.15%), #DIA (+0.71%), #QQQ (+1.95%).
The 10-year US government bonds yield is at the level of 2.72-2.73%.
The news feed on 16.01.2019:
– Consumer price index in the UK at 11:15 (GMT+2:00); – Retail sales in the US at 15:30 (GMT+2:00); – Fed’s “Beige Book” at 21:00 (GMT+2:00).
The pound has shrugged off a massive government defeat in the UK House of Commons tonight, perhaps because investors see the government’s threat of a no deal Brexit as illusionary given the increasing control over the Brexit process that the legislative body is now taking, affirms the CEO of one of the world’s largest independent financial advisory organizations.
The forecast from Nigel Green, founder and chief executive of deVere Group, comes as UK Prime Minister Theresa May lost the meaningful vote on her government’s EU withdrawal agreement by a significantly large margin of 230 votes and the pound rose by approximately one and a half U.S. cents in response.
Mr Green notes: “It appears the British government is currently in brinkmanship mode.
“Mrs May says she is not ‘running down the clock’ to the deadline of 28th March, but in all likelihood she will be re-submitting her Brexit plan with only a few minor tweaks, and so taking up government and parliamentary time that could perhaps be spent exploring other options that can command more support from MPs. In all probability, the government will seek an extension to Article 50.
Mrs May does not want to be the Prime Minister who takes the country into a chaotic no deal Brexit on 29th March.
“The longer the Brexit process is extended, the less chance of a no deal and greater chance there is of a second referendum that will reject Brexit, or a soft Brexit. This will please global financial markets and favour the pound and UK financial assets.”
He continues: “Following the leader of the opposition Labour party, Jeremy Corbyn’s tabling of a vote of no confidence, there is greater chance of a general election. But in normal times this would spook the markets and have a directly negative impact (in the short-term at least) on the pound, the FTSE and UK financial assets generally.
“But these are not normal times, and the DUP and Conservative MPs who vote against the government’s Brexit bill are unlikely to vote against the government. A general election seems a low probability outcome.”
Mr Green concludes: “As the uncertainty rumbles on, portfolio diversification should remain the major strategy for investors.”
About:
deVere Group is one of the world’s largest independent advisors of specialist global financial solutions to international, local mass affluent, and high-net-worth clients. It has a network of more than 70 offices across the world, over 80,000 clients and $12bn under advisement.
Ethereum’s price will “continue to soar” throughout 2019 – and a main driver of the continued rally will be this week’s hard fork.
The comments from influential tech expert Ian McLeod of Thomas Crown Art, the world’s leading art-tech agency, come as the second largest cryptocurrency has secured an impressive rally over the last month.
Mr McLeod observes: “Ethereum has made a bullish move and broke the $125.00 resistance – giving the crypto naysayers and doom-mongers a robust signal that this digital currency is on the upward trajectory once again.
“Ethereum’s rally is part of a wider cryptocurrency rally since the beginning of the year, with other major coins, including Bitcoin and XRP, also securing important gains.
“The bulls are back in town.”
He continues: “Whilst we can expect 2019 to be dominated by a considerably more bullish sentiment than in 2018 across the major digital assets, I think it is likely that Ethereum will be the standout winner this year for three key reasons.
“First, the hard fork set to take place on 16 January. The hard fork will mean Ethereum miner rewards fall from three ether to two and decrease the block time, resulting in a faster network. This is a key part of a major Ethereum upgrade and the markets are excited.
“There’s a possibility the date of the hard fork might be pushed back a little, but traders are managing this into expectations.”
“Second, oracles. Oracles – data feeds that deliver information into the smart contract from third parties – will inevitably drive adoption of Ethereum smart contracts.
“This is because smart contracts using decision-making on real-world metrics can be expected to find relevant use cases among consumers, firms, and organizations, amongst others. And, of course, as adoption and utility of Ethereum smart contracts increase, so will Ethereum’s price.”
Thomas Crown Art is already a global pioneer in using Ethereum smart contracts.
Ian McLeod comments: “We’ve created a groundbreaking solution for artists and art collectors and galleries by giving the capability to use new works of art as a literal ‘store of value’ and serve as a cryptocurrency wallet for owners whilst providing an independent method to conclusively prove the provenance of artwork quickly and easily, and to view an immutable chain of ownership.
“Using an Ethereum blockchain to authenticate artwork is an ideal use-case for distributed ledger technology. It provides the ability to store a permanent, immutable record of artwork at the point of creation which can be used to authenticate registered works by any third party independently.”
Thomas Crown Art’s tech expert concludes: “The sentiment data and technical analysis suggests that Ethereum’s rally, to be fuelled further by the hard fork, will continue in the short to medium term.
“It is likely that this will positively impact on the rest of the cryptocurrency sector.”
As we can see in the H4 chart, XAUUSD is still testing the resistance level again and forming Shooting Star, Doji, and Hanging Man reversal patterns. Judging by the previous movements, it may be assumed that after finishing the correction the instrument may break the level and continue its ascending movement.
NZDUSD, “New Zealand vs. US Dollar”
As we can see in the H4 chart, NZDUSD is still trading near the resistance level and forming Doji, Hanging Man, and Shooting Star reversal patterns. Judging by the previous movements, it may be assumed that after testing the resistance level and completing another pullback the instrument may continue its growth.
Attention! Forecasts presented in this section only reflect the author’s private opinion and should not be considered as guidance for trading. RoboForex LP bears no responsibility for trading results based on trading recommendations described in these analytical reviews.
UK financial assets and the pound will rally if Theresa May’s Brexit deal is passed today (Tuesday), affirms the CEO of one of the world’s largest independent financial advisory organizations.
The comments from Nigel Green, deVere Group’s founder and chief executive, come as the UK Prime Minister gave a final plea to persuade the lawmakers in parliament to back her Brexit deal. It follows an “alleged coup” by pro-EU politicians attempting to strip the British government of control.
Mrs May postponed a parliamentary vote on her deal last month, admitting she was set to lose it. To win today, the PM has to overcome heavy opposition from across the political spectrum.
Mr Green observes: “If it is passed, sterling will rally sharply as the prospect of a no deal, and/or months of further uncertainty ends.
“Sentiment towards UK stocks will also rally, particularly given the attractive valuations of many UK companies.
“However a strong pound may dilute the impact on exporters, as their earnings in dollars and euros, amongst others, will become less valuable in sterling terms.
“As such, the FTSE 100, the UK’s benchmark index, may underperform small and mid cap stocks in the relief rally that follows the Bill’s passing.”
He continues: “If the bill is not passed, as is widely expected, sterling and UK financial assets will probably be unmoved since this is the expectation – the markets have priced it in.
“However, a significant loss for the government (say by over 40 votes), would lead to a further fall in sterling and negative sentiment towards UK stocks. Financial markets do not like political uncertainty.”
Mr Green goes on to say: “Should Theresa May be defeated, the leader of the opposition Labour party, Jeremy Corbyn, will push for a general election.
“Another UK election in these highly unusual times can be expected to spook the markets and have a direct negative impact in the short-term at least on the pound, the FTSE and UK financial assets generally.”
The deVere CEO concludes: “There is potential for a large relief rally for UK financial assets and Sterling if Mrs May’s Brexit bill is passed – but this looks unlikely to materialize.”
About:
deVere Group is one of the world’s largest independent advisors of specialist global financial solutions to international, local mass affluent, and high-net-worth clients. It has a network of more than 70 offices across the world, over 80,000 clients and $12bn under advisement.
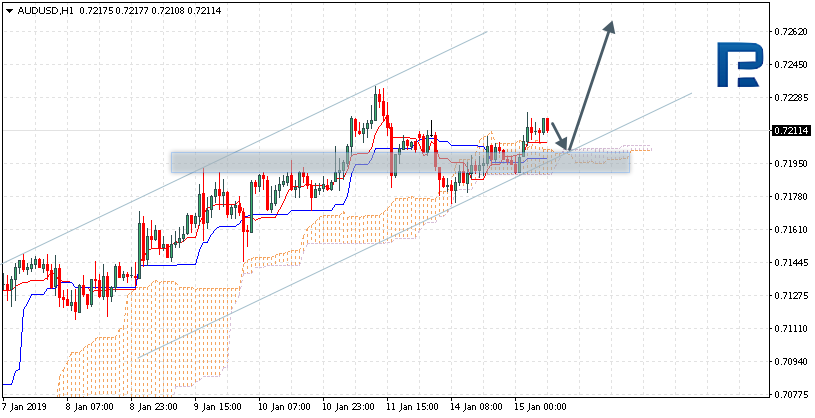
AUDUSD is trading at 0.7211; the instrument is moving above Ichimoku Cloud, thus indicating an ascending tendency. The markets could indicate that the price may test the upside border of the cloud at 0.7200 and then resume moving upwards to reach 0.7265. Another signal to confirm further ascending movement is the price’s rebounding from the channel’s downside border. However, the scenario that Implies further growth may be cancelled if the price breaks the downside border of the cloud and fixes below 0.7175. In this case, the pair may continue falling towards 0.7075.
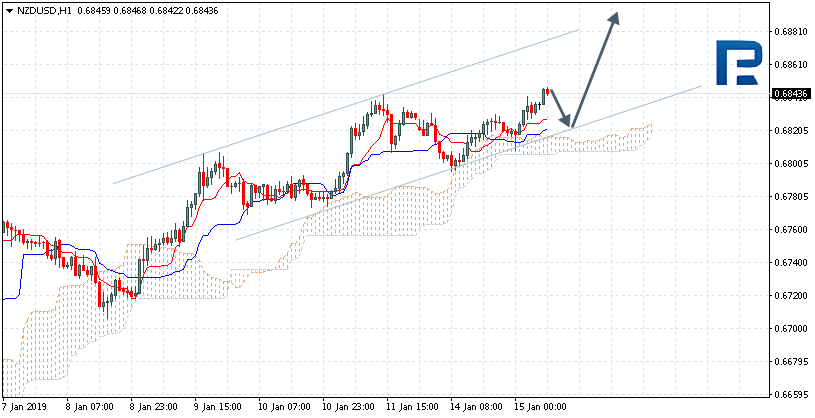
NZDUSD, “New Zealand Dollar vs US Dollar”
NZDUSD is trading at 0.6843; the instrument is moving above Ichimoku Cloud, thus indicating an ascending tendency. The markets could indicate that the price may test Tenkan-Sen and Kijun-Sen at 0.6835 and then resume moving upwards to reach 0.6900. Another signal to confirm further ascending movement is the price’s rebounding from the channel’s downside border. However, the scenario that Implies further growth may be cancelled if the price breaks the downside border of the cloud and fixes below 0.6800. In this case, the pair may continue falling towards 0.6715.
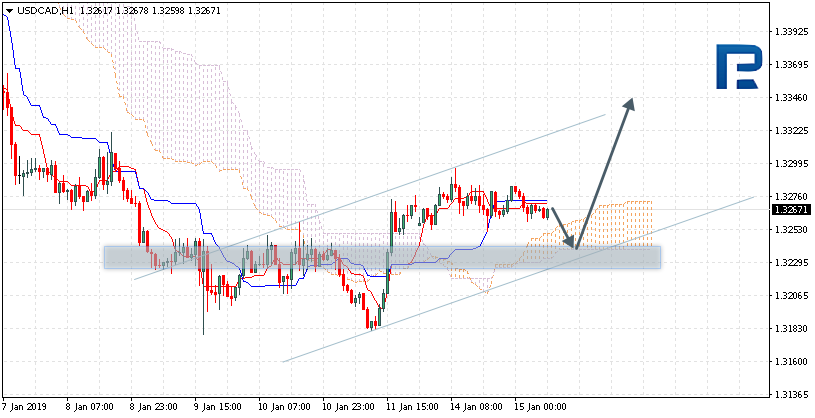
USDCAD, “US Dollar vs Canadian Dollar”
USDCAD is trading at 1.3267; the instrument is moving above Ichimoku Cloud, thus indicating an ascending tendency. The markets could indicate that the price may test the downside border of the cloud at 1.3245 and then resume moving upwards to reach 1.3345. Another signal to confirm further ascending movement is the price’s rebounding from the channel’s downside border. However, the scenario that implies further growth may be cancelled if the price breaks the downside border of the cloud and fixes below 1.3205. In this case, the pair may continue falling towards 1.3105.
Attention! Forecasts presented in this section only reflect the author’s private opinion and should not be considered as guidance for trading. RoboForex LP bears no responsibility for trading results based on trading recommendations described in these analytical reviews.
EUR/USD is showing an ambiguous technical picture. The trading instrument is in a sideways trend. Yesterday the EU published some weak economic reports. The volume of the industrial production lowered in Novermber by 1.7% while the investors expected the fall by 1.5%. The trading instrument is consolidating in the 1.14600-1.14900 range. You should open positions from the key levels.
– Manufacturer`s Price Index (US) – 15:30 (GMT+2:00).
The indicators do not provide precise signals, the price is being traded between 50 MA and 200 MA.
The MACD histogram is close to 0. There are no signals.
The Stochastic Oscillator is in the neutral zone, the %K line is below the %D line, which points toward a bearish mood.
Trading recommendations
Support levels: 1.14600, 1.14250, 1.13800
Resistance levels: 1.14900, 1.15300, 1.15700
If the price fixes below the local support level of 1.14600 consider selling EUR/USD. The movement will tend toward 1.14000.
Alternatively the currency pair can grow toward 1.15300-1.15500.
The GBP/USD currency pair
Technical indicators of the currency pair:
Prev Open: 1.28538
Open: 1.28560
% chg. over the last day: +0.21
Day’s range: 1.28800 – 1.29105
52 wk range: 1.2438 – 1.4378
GBP/USD is showing a variety of trends. The investors are waiting for the Brexit vote which is set for tonight. The key levels are 1.28600 and 1.29100. Positions should be opened from these levels. Tonight GBP/USD may be highly volatile so consider setting the StopLoss and TakeProfit parameters.
The Economic News Feed for 15.01.2019:
– The Brexit Vote – 21:00 (GMT+2:00);
Indicators point toward the power of the buyers, the price fixed above 50 MA and 200 MA.
The MACD histogram is in the positve zone but below the signal line, which gives a weak signal o buy GBP/USD.
The Stochastic Oscillator is in the neutral zone, the %K line is below the %D line which points toward a bearish mood.
Trading recommendations
Support levels: 1.28600, 1.28100, 1.27700
Resistance levels: 1.29100, 1.29500
If the price fixes below the mirror support of 1.28600, expect the quotes to fall toward 1.28100-1.27900.
Alternatively the quotes can grow toward 1.29500-1.29700.
The USD/CAD currency pair
Technical indicators of the currency pair:
Prev Open: 1.32572
Open: 1.32817
% chg. over the last day: +0.04
Day’s range: 1.32444 – 1.32582
52 wk range: 1.2248 – 1.3664
USD/CAD is showing an ambiguous technical picture. The quotes are moving in a flat. The investors are waiting for additional drivers. You should keep an eye on the US news feed. Right now the key interest range is 1.32400 and 1.32800 respectively. You should open positions from the key levels.
The Economic News Feed for 15.01.2019 is calm.
The indicators do not provide precise signals, the price is testing 50 MA.
The MACD histogram is close to 0.
The Stochastic Oscillator is in the neutral zone, the %K line is below the %D line which gives a signal to sell USD/CAD.
Trading recommendations
Support levels: 1.32400, 1.32000, 1.31700
Resistance levels: 1.32800, 1.33150, 1.33600
If the price fixes below 1.32800 expect the quotes to grow toward 1.33150-1.33400.
Altenatively the quotes can descend toward 1.32000-1.31700.
The USD/JPY currency pair
Technical indicators of the currency pair:
Prev Open: 108.512
Open: 108.154
% chg. over the last day: -0.20
Day’s range: 108.632 – 108.697
52 wk range: 104.56 – 114.56
Yesterday the USD/JPY have slightly lowered. Right now the currency pair is in a bullish mood. The key levels are 108.500 and 108.800. You should open positions from the key levels. The quotes can grow further.
The Economic News Feed for 15.01.2019 is calm.
The price has fixed above 50 MA and 200 MA which shows the power of the buyers.
The MACD histogram is in the positive zone which gives a signal to buy USD/JPY.
The Stochastic Oscillator is in the neutral zone, the %K line is below the %D line, which points toward a bearish mood.
Trading recommendations
Support levels: 108.500, 108.200, 108.000
Resistance levels: 108.800, 109.100
If the price fixes above 108.800 expect further growth toward 109.100-109.300.
Alternatively the quotes can fall toward 108.200-108.000
Yesterday, the US dollar slightly changed against a basket of major currencies. Financial market participants took a wait-and-see attitude. Important economic reports will be published today. The dollar index (#DX) closed yesterday in the negative zone (-0.07%).
The US government shutdown also puts pressure on the US currency. The government has not work from December 22 due to disagreements concerning the wall on the border with Mexico. The shutdown has been lasting 25 days and is the longest in the US history. Republican Senator Lindsey Graham tried to urge Donald Trump to at least partially restore work, but the President refused.
The euro weakened against the US dollar amid weak statistics from the Eurozone. Thus, the industrial production declined by 1.7% in November, while investors expected a drop of 1.5%. Previous data were also revised downward, the growth in October counted to 0.1%, not 0.2%. Today, the attention of financial market participants will be focused on the Brexit vote.
The “black gold” prices are consolidating. At the moment, futures for the WTI crude oil are testing the mark of $51.15 per barrel. At 23:30 (GMT+2:00), the API weekly crude oil stock will be published.
Market Indicators
Yesterday, the bearish sentiment was observed in the US stock market: #SPY (-0.61%), #DIA (-0.39%), #QQQ (-0.88%).
The 10-year US government bonds yield is at the level of 2.71-2.72%.
The news feed on 15.01.2019:
– Reports on the volume of exports and imports in the US at 15:30 (GMT+2:00); – Producer price index in the US at 15:30 (GMT+2:00); – UK Parliament vote on Brexit deal at 21:00 (GMT+2:00).
Kendall and Hochberg: Interest Rates Win Again as Fed Follows Market
By Elliott Wave International
Most economists and financial analysts believe that central banks set interest rates.
For more than two decades, Elliott Wave International has tracked the relationship between interest rates set by the marketplace and interest rates set by the U.S. Federal Reserve and found that it’s actually the other way around–the market leads, and the Fed follows.
The latest Federal Reserve rate decision on December 19 brought the usual breathless anticipation. Confusion reigned as the U.S. president as well as a former Fed board member publicly urged the U.S. central bank not to raise rates and many wondered if the Fed would “rescue” investors with a surprise decision to leave them unchanged. The Fed, however, did what it almost always does: it brought its rate in line with market rates.
The Fed increased its federal funds rate a quarter-point from 2.25% to 2.50%. As shown by the dashed line in Figure 1, the Fed’s move followed a rise in the six-month U.S. Treasury bill yield from 2.36% to 2.56% and an increase in the three-month U.S. Treasury bill yield from 2.18% to 2.42% since the prior Fed rate hike on September 26. So, market rates remain nearly undefeated when it comes to predicting what the Fed’s actions will be.
Figure 1
Figure 2, a longer term version of the same relationship, is from The Socionomic Theory of Finance by Robert Prechter. It shows the federal funds rate as set by the Fed and the market-set three-month U.S. Treasury bill yield back to early 2000. This history shows that the T-bill market moves first and the Fed’s interest-rate changes follow. As a result, no one monitoring the Fed’s decisions can predict when T-bill rates will change, but anyone monitoring the T-bill rate can predict when the Fed’s rates will change. We demonstrated this ability in August 2007 by predicting that the Fed was on the cusp of lowering its federal funds rate dramatically. Figure 2 shows the timing and its aftermath.
Figure 2
Over the years, Fed leaders have indicated that they’re in the dark. On September 17, 2007, a CNBC interviewer asked former chairman Alan Greenspan, “Did you keep interest rates too low for too long in 2002-2003?” Greenspan instantly responded, “The market did.” In a November speech this year, current chairman Jerome H. Powell likened the Fed’s situation to walking through a living room when the lights suddenly go out. He said, “What do you do? You slow down and you maybe go a little bit less quickly, and you feel your way more. So under uncertainty of this kind, you be careful.” The Fed has recently racked up $66.5 billion in paper losses in its bond portfolio, far exceeding its $39.1 billion in capital. Would you trust an institution that lost so much money in the bond market that it sank to a net worth of negative $27.4 billion to tell you where interest rates were headed? The Fed continually follows the market because it lacks any other useful guide.
This article was syndicated by Elliott Wave International and was originally published under the headline Kendall and Hochberg: Interest Rates Win Again as Fed Follows Market. EWI is the world’s largest market forecasting firm. Its staff of full-time analysts led by Chartered Market Technician Robert Prechter provides 24-hour-a-day market analysis to institutional and private investors around the world.
On Monday, the price managed to climb to the highest levels since the 23rd of November. This optimism is a result of the latest developments from the Brexit pit, where according to Theresa May, a ‘no Brexit’ option is more probable than a ‘no deal’ option. Fundamentals are very much in line with the technical analysis, and this situation is always more than welcomed by Forex traders.
As I am primarily a technical trader, I will focus on this type of analysis. GBPUSD is largely influenced by the double bottom formation from December and January. This reversal formation always has a neckline and the breakout of that neckline is a trigger to go long. In our case, this neckline is the horizontal area around 1.2815 (orange). That resistance was broken on Friday and that was the first sign of optimism. Later, the broken resistance was successfully tested as a support and that proved the buy signal.
From the price action point of view, the buy signal here is very strong. Additionally, it has a great risk-to-reward ratio. In theory, a stop loss order should be placed below today’s lows and the take profit is on the black line connecting long-term lower highs. That gives us a potential profit which is three times bigger than the potential loss. Positive sentiment will remain as long as we are above the orange line. Should the price drop below that support it will create a false breakout pattern and will be a legitimate signal to go short.