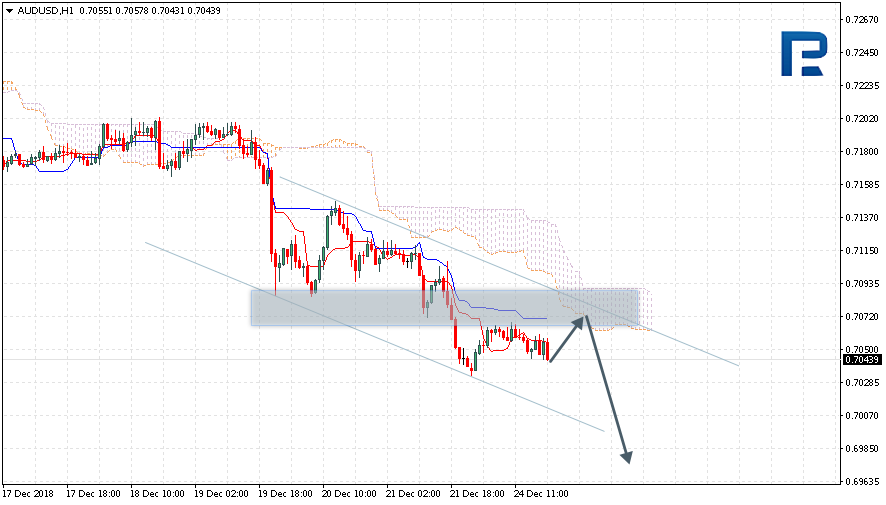
AUDUSD is trading at 0.7043; the instrument is moving below Ichimoku Cloud, thus indicating a descending tendency. The markets could indicate that the price may test the downside border of the cloud at 0.7070 and then resume moving downwards to reach 0.6980. Another signal to confirm further descending movement is the price’s rebounding from the channel’s upside border. However, the scenario that Implies further decline may be cancelled if the price breaks the upside border of the cloud and fixes above 0.7100. In this case, the pair may continue growing towards 0.7205.
NZDUSD, “New Zealand Dollar vs US Dollar”
NZDUSD is trading at 0.6716; the instrument is moving below Ichimoku Cloud, thus indicating a descending tendency. The markets could indicate that the price may test Tenkan-Sen and Kijun-Sen at 0.6770 and then resume moving downwards to reach 0.6635. Another signal to confirm further descending movement is the price’s rebounding from the resistance level. However, the scenario that Implies further decline may be cancelled if the price breaks the upside border of the cloud and fixes above 0.6830. In this case, the pair may continue growing towards 0.6975.
USDCAD, “US Dollar vs Canadian Dollar”
USDCAD is trading at 1.3576; the instrument is moving above Ichimoku Cloud, thus indicating an ascending tendency. The markets could indicate that the price may test Tenkan-Sen and Kijun-Sen at 1.3535 and then resume moving upwards to reach 1.3660. Another signal to confirm further ascending movement is the price’s rebounding from the channel’s downside border. However, the scenario that implies further growth may be cancelled if the price breaks the downside border of the cloud and fixes below 1.3465. In this case, the pair may continue falling towards 1.3345.
Attention! Forecasts presented in this section only reflect the author’s private opinion and should not be considered as guidance for trading. RoboForex LP bears no responsibility for trading results based on trading recommendations described in these analytical reviews.
As we can see in the H4 chart, EURUSD has completed another pullback from the resistance level and formed Harami, Shooting Star, and Doji reversal patterns. Judging by the previous movements, at the moment it may be assumed that after finishing the correction the instrument may continue moving to the upside.
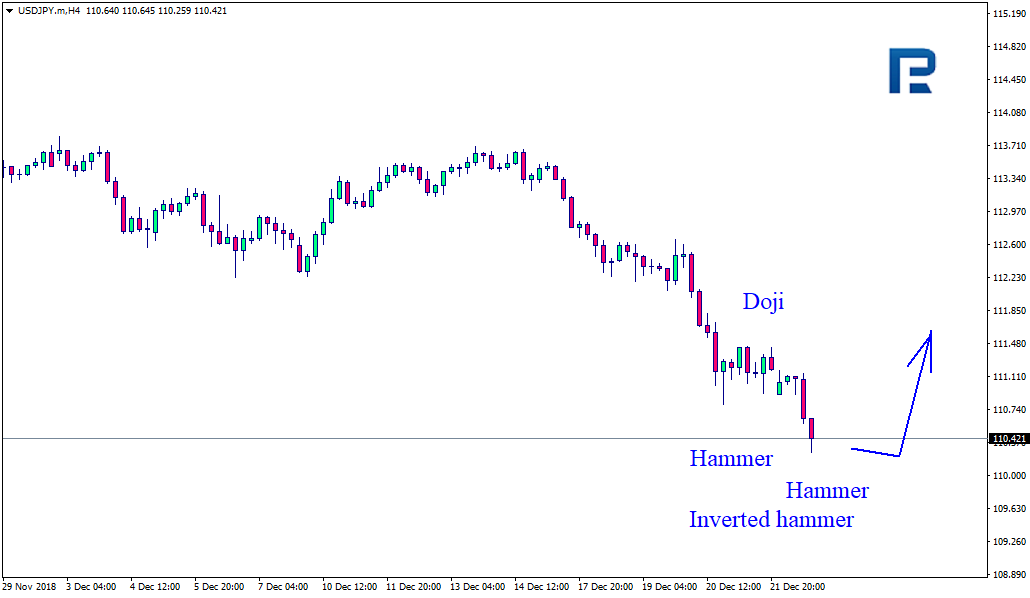
USDJPY, “US Dollar vs. Japanese Yen”
As we can see in the H4 chart, USDJPY has broken the support level and formed several Hammer and Inverted Hammer reversal patterns. Judging by the previous movements, at the moment it may be assumed that after completing the pullback the instrument may continue its ascending tendency.
Attention! Forecasts presented in this section only reflect the author’s private opinion and should not be considered as guidance for trading. RoboForex LP bears no responsibility for trading results based on trading recommendations described in these analytical reviews.
At the beginning of another December week, EURUSD is slowly rising and trading close to 1.1395. investors’ response to the US Federal Reserve decisions helped the instrument to reach 1.1485, the highest level over the previous trading week.
In general. December turned out to be a very volatile month for the major currency pair. Investors had to consider OPEC+ meetings, the FOMC meeting, and the QE program elimination. There was too much fundamental news, forcing a lot of fluctuations in EURUSD and a veritable firestorm of emotions among investors.
This week, the macroeconomic calendar is almost empty. The only active day will be Friday. The USA will report on the Goods Trade Balance and the Wholesale Inventories in November. On the same day, the US Federal Reserve Chairman Jerome Powell is going to speak. There will be hardly anything else to make the currency market move.
On Christmas Eve and Christmas, no activity is expected on the market, that’s why the major currency pair will probably consolidate in the range. There might be some quick movements on a “thin” market with a handful of investors, such things happen from time to time, but it’s very unlikely.
Looking at the H1 chart of EURUSD, one can see the mid-term correction to the upside. The current short-term decline may reach the support level of the mid-term projected channel at 1.1285, but only after the price breaks the low at 1.1355. In the nearest future, the instrument is expected to start a new pullback towards the resistance level at 1.1420.
Disclaimer
Any predictions contained herein are based on the authors’ particular opinion. This analysis shall not be treated as trading advice. RoboForex shall not be held liable for the results of the trades arising from relying upon trading recommendations and reviews contained herein.
EURUSD has formed another consolidating range around 1.1414 and broken it to the downside; right now, it is trading downwards to return to the broken border of the range. Possibly, the pair may test 1.1414 from below and then resume falling with the short-term target at 1.1344. After that, the instrument may to return to 1.1414 once again and then resume trading inside the downtrend with the first target at 1.1340.
GBPUSD, “Great Britain Pound vs US Dollar”
GBPUSD is trading close to 1.2640 without any particular direction. If later the instrument breaks 1.2710 to the upside, the price may be corrected with the short-term target at 1.2750; if 1.2600 to the downside – resume trading inside the downtrend towards 1.2530 and then form one more ascending structure to return to 1.2640.
USDCHF, “US Dollar vs Swiss Franc”
USDCHF has formed another consolidation range around 0.9913; if later it breaks this range to the upside, the price may continue the ascending wave with the short-term target at 0.9963. Right now, the pair is expected to return to 0.9913 and then resume growing to reach the above-mentioned target. Later, the market may start a new correction to return to 0.9913 once again and then form one more ascending structure with the first target at 0.9985.
USDJPY, “US Dollar vs Japanese Yen”
USDJPY has completed the ascending impulse along with the correction, thus forming another consolidation range. If later the instrument breaks 111.46 to the upside, the price may be corrected to reach 112.12; if 110.80 to the downside – resume trading inside the downtrend and extend the third wave with the target at 107.50.
AUDUSD, “Australian Dollar vs US Dollar”
AUDUSD has formed another consolidation range around 0.7100 and broken it to the downside; right now, it is trading downwards to reach 0.7000. Possibly, today the pair may return to 0.7100 to test it from below and then form a new descending structure with the target at 0.7000.
USDRUB, “US Dollar vs Russian Ruble”
USDRUB has reached its short-term target at 67.17 and broken it to the upside. Today, the pair may start a new correction to return to 67.17. After that, the instrument may, form one more ascending structure with the target at 68.96.
XAUUSD, “Gold vs US Dollar”
Gold is trading upwards; it has finished the descending impulse along with the correction at 1262.00. Possibly, the pair may extend this structure towards 1268.50, resume falling towards 1262.00 and then start a new ascending structure to reach 1274.74. All rising structures (to extend the ascending wave or form a reversal pattern) may be formed only according to an alternative scenario. The main scenario implies that the price may break 1254.25 to the downside and trade inside the downtrend with the first target at 1230.50.
BRENT
Brent is trading upwards. Today, the pair may reach 55.95 and then form another descending structure towards 51.75. Later, the market may start a new growth with the target at 57.50.
Attention! Forecasts presented in this section only reflect the author’s private opinion and should not be considered as guidance for trading. RoboForex LP bears no responsibility for trading results based on trading recommendations described in these analytical reviews.
As we can see in the H4 chart, the long-term correctional uptrend continues; it has already reached the retracement of 50.0%. The next upside target may be the retracement of 61.8% at 1287.00. At the same time, there is divergence at MACD, which may indicate a reverse after the price reaches the target. The local support level is at 1208.68.
In the H1 chart, after reaching the retracement of 50.0%, the pair started a new correction to the upside. If the price breaks the high at 1266.47, the instrument may trade towards the post-correctional extension area between the retracements of 138.2% and 161.8% at 1271.21 and 1274.15 respectively.
USDCHF, “US Dollar vs Swiss Franc”
As we can see in the H4 chart, after USDCHF reached the retracement of 50.0% at 0.9835, the convergence made it reverse and start a new rising impulse. The local resistance is at 0.9990, the key one – the high at 1.0128.
The H1 chart shows more detailed structure. The pair has already reached the retracement of 38.2% and may continue trading towards the retracements of 50.0%, 61.8%, and 76.0% at 0.9984, 1.0019, and 1.0059 respectively.
Attention! Forecasts presented in this section only reflect the author’s private opinion and should not be considered as guidance for trading. RoboForex LP bears no responsibility for trading results based on trading recommendations described in these analytical reviews.
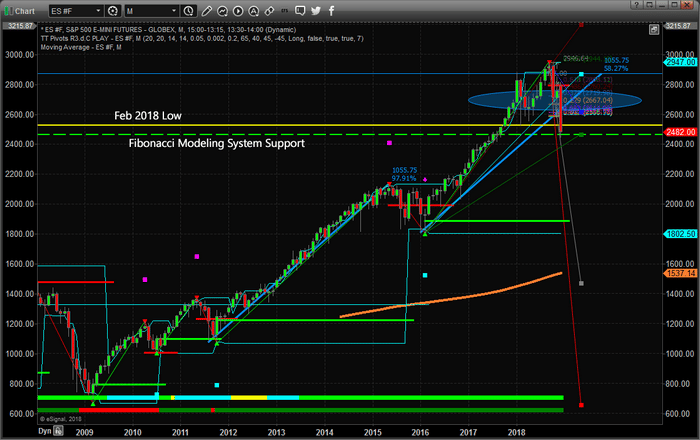
The ES (S&P e-mini contracts) broke the support level from the February 2018 lows immediately after the US Federal Reserve announced a 25 bp rate hike this week. This breakdown below the February 2018 lows is concerning because it indicates that previous support is not holding and we could be in for further downside price activity.
We are preparing a detailed research post for early next week regarding a broad range of US markets as well as how our proprietary price modeling systems are reflecting this recent price move. What we can suggest to all investors is play small positions at the moment and prepare for increased volatility. There is near-term support that may come into play soon, but overall the markets are reacting to a deleveraging event that could see prices push below 2400 before finding true support.
Visit TheTechnicalTraders.com to read all of our recent research posts and see what we believe will be the big movers in 2019.
Friday’s trading closed nearly 100 pips down. Growth from the 1.1440 support stopped at the 1.1474 mark. While the subsequent drop seemed like a technical correction up until 1.1420, the breakout of the trend line at 1.1412 sped up the decline on the back of stop levels being activated and short positions closed.
Buyers cashed in on their long positions thanks to the dollar’s rise, before the greenback reversed ahead of the Christmas holidays. It was also given a boost by a US stock selloff, with the dollar and yen coming into play as safe havens.
The majors showed mixed dynamics last week. Among the losers against the US dollar were the Aussie (-2.02%), the Loonie (-1.58%), and the Kiwi (-1.24%). Rising against the greenback were the yen (+1.95%), the euro (+0.59%), the pound (+0.33%), and the Swiss franc (+0.28%).
Day’s news (GMT+3):
Christmas Eve.
Fig 1. EURUSD hourly chart.
Current situation:
After the breakout of the trend line, the EURUSD pair’s drop came to an end at around the 112th degree at 1.1384 before recovering to 1.1393. Considering that Friday marked the second day of decline in a row for our pair, the fact that the economic calendar is empty, and that there is a reduced trading schedule in the US, today I expect to see the pair go against Friday’s movements to the LB balance line at 1.1420.
Market participants reacted to FOMC member Williams’ speech, who said that the Fed would be keeping a close eye on statistics. If reports are strong, forecasts could change, which could affect the number of projected rate hikes in 2019.
The pair has been trading within a sideways range of 250 pips since mid-November. I think it will stay within this range until the end of the year.
EURUSD is still forming the ascending structure. Possibly, today the pair may fall towards 1.1381 and then grow to reach 1.1440, thus forming another consolidation range. If later the instrument breaks this range to the upside, the price may reach 1.1495; if to the downside – resume trading inside the downtrend with the target at 1.1250.
GBPUSD, “Great Britain Pound vs US Dollar”
GBPUSD is still consolidating around 1.2640. Today, the pair may fall to reach 1.2540 and then grow to expand the range towards 1.2745. Later, the market may continue trading inside the downtrend with the short-term target at 1.2415.
USDCHF, “US Dollar vs Swiss Franc”
USDCHF is trading close to the downside border of the range. Possibly, today the pair may form one more ascending structure towards 0.9900 and then resume falling to reach 0.9866. If later the instrument breaks 0.9850 to the downside, the price may resume falling with the target at 0.9825; if 0.9900 to the upside – start a new growth towards 1.0000.
USDJPY, “US Dollar vs Japanese Yen”
USDJPY has reached the short-term downside target; right now, it is forming the first ascending impulse. Possibly, the pair may be corrected with the first target at 111.70. After that, the instrument may form a new descending structure towards 111.27.
AUDUSD, “Australian Dollar vs US Dollar”
AUDUSD is still trading downwards. Possibly, today the pair may reach 0.7077 and then form one more ascending structure towards 0.7144. Later, the market may resume trading inside the downtrend with the target at 0.7000.
USDRUB, “US Dollar vs Russian Ruble”
USDRUB is still trading upwards. Today, the pair may reach 68.20 and fall towards 67.15. After that, the instrument may, form one more ascending structure with the target at 68.40.
XAUUSD, “Gold vs US Dollar”
Gold is trading upwards as well; it has reached the upside target. Possibly, today the pair may fall towards 1257.40 and then start a new ascending structure to reach 1261.61. If later the instrument breaks 1257.40 to the downside, the price may trading inside the downtrend with the first target at 1248.15.
BRENT
Brent is trading downwards. Today, the pair may reach 53.85 and then form one more ascending structure towards 57.95. Later, the market may fall to reach 55.85 or even extend this structure towards 52.42. After that, the instrument may form a reversal pattern and start a new correction with the first target at 63.00.
Attention! Forecasts presented in this section only reflect the author’s private opinion and should not be considered as guidance for trading. RoboForex LP bears no responsibility for trading results based on trading recommendations described in these analytical reviews.
As we can see in the H4 chart, there was a convergence on MACD, which made BTCUSD start a new ascending correction, which has already reached the retracement of 23.6. The next possible targets may be the retracements of 38.2% and 50.0% at 4427.00 and 4835.00 respectively. The support level is at 3121.90.
In the H1 chart, there was a divergence on MACD that made the pair complete the uptrend and start a new descending impulse, which has already reached the retracement of 23.6%. The next downside targets may be the retracements of 38.2% and 50.0% at 3770.00 and 3645.00 respectively. The local resistance is at 4172.40.
ETHUSD, “Ethereum vs. US Dollar”
As we can see in the H4 chart, the convergence made ETHUSD start a new rising correction, which has already reached the retracement of 23.6%. The next downside targets may be the retracements of 38.2% and 50.0% at 135.40 and 151.80 respectively. The support level is at 80.86.
In the H1 chart, there divergence made the start a new descending correction, which has already reached the retracement of 23.6%. The next downside targets may be the retracements of 38.2% and 50.0% at 104.40 and 99.90 respectively. The local resistance is at 118.90.
Attention! Forecasts presented in this section only reflect the author’s private opinion and should not be considered as guidance for trading. RoboForex LP bears no responsibility for trading results based on trading recommendations described in these analytical reviews.
The EUR/USD is showing a positive trend. The quotes grew by 80 points and set the new monthly maximums. The USD is under pressure due to weak economic reports and political stress in the White House. Donald Trump refused to sign a bill regarding the temporary financing of the government. The Philadelphia PMI in December lowered to 9.4 instead of 15.6. You should open positions from the key levels of 1.14400-1.14800.
The Economic News Feed for 21.12.2018:
– Primary Orders on the Durable Goods (US) – 15:30 (GMT+2:00);
– GDP Report (US) – 15:30 (GMT+2:00);
Inficators signal the power of the buyers, the price fixed above 50 MA and 200 MA.
The MACD histogram is in the positive zone and keeps rising which points toward the growth of the EUR/USD.
The Stochastic Oscillator is in the neutral zone, the %K line is above the %D line, which also gives a signal to buy EUR/USD.
Trading recommendations
Support levels: 1.14400, 1.14000, 1.13700
Resistance levels: 1.14800, 1.15000
If the price fixes above 1.14800 expect further growth of the EUR/USD toward 1.15000-1.15300.
Alternatively the quotes can descend toward 1.14000.
The GBP/USD currency pair
Technical indicators of the currency pair:
Prev Open: 1.26079
Open: 1.26532
% chg. over the last day: +0.47
Day’s range: 1.26398 – 1.26976
52 wk range: 1.2477 – 1.4378
The GBP/USD keeps trading in a long flat. The technical picture is ambiguous. The Bank of England, as expected, kept the monetary policy at the same levels. The GBP is supported by the positive retail sales report in the UK. The investors are looking forward to more data regarding Brexit. The key trading range is 1.26350-1.26800, positions should be opened from these levels.
At 11:30 (GMT+2:00) the UK will publish a GDP report.
Indicators do not provide precise signals, 50 MA started to cross 200 MA.
The MACD histogram is close to 0.
The Stochastic Oscillator is in the neutral zone, the %K line is rossing the %D line. There are no signals at the moment.
Trading recommendations
Support levels: 1.26350, 1.26000, 1.25400
Resistance levels: 1.26800, 1.27550, 1.28000
If the price fixes above 1.26800, consider buying GBP/USD. The movement will tend toward 1.27400-1.27750.
Alternatively the quotes can descend toward the round 1.26000.
The USD/CAD currency pair
Technical indicators of the currency pair:
Prev Open: 1.34842
Open: 1.35028
% chg. over the last day: +0.10
Day’s range: 1.34928 – 1.35266
52 wk range:1.2248 – 1.3496
The USD/CAD keeps showing a bullish mood. The CAD is trading in a flat. Positions should be opened from the key interest levels of 1.34900 and 1.35300. Investors are waiting for the economic reports from Canada. Also, keep an eye on the oil quotes dynamics.
The Economic News Feed for 21.12.2018:
– Basis Index for Retail Sales (CAD) – 15:30 (GMT+2:00);
– GDP Report (CAD) – 15:30 (GMT+2:00);
The price fixed above 50 MA and 200 MA which points toward the power of the buyers.
The MACD is in the positive zone and keeps rising which points toward the growth of USD/CAD.
The Stochastic Oscillator is in the neutral zone, the %K line is higher than the %D line, which gives a signal to buy USD/CAD.
Trading recommendations
Support levels: 1.34900, 1.34500, 1.34150
Resistance levels: 1.35300, 1.35500
If the price fixes above 1.35300 expect further growth toward 1.35600-1.35800.
Alternatively the price can fix below 1.34900 and you should expect a drop-off toward 1.34600-1.34400.
The USD/JPY currency pair
Technical indicators of the currency pair:
Prev Open: 112.406
Open: 111.203
% chg. over the last day: -1.16
Day’s range: 111.048 – 111.459
52 wk range: 104.56 – 114.56
USD/JPY remains in an aggressive sell-off. During the trading yesterday, the yen grew by more than 1% against the USD. The quotes reached 111.000 and can descend further. The local resistance is 111.450. You should keep an eye on the US economic reports and the government bond dynamics.
During the Asian trading session, Japan published a weak inflation report.
Indicators point toward the power of the buyers: the price fixed below 50 MA and 200 MA.
The MACD histogram is in the negative zone but above the signal line, which gives a weak signal to sell USD/JPY.
The Stochastic Oscillator is in the neutral zone but above the signal line which points toward a bearish sentiment.
Trading recommendations
Support levels: 111.000, 110.750
Resistance levels: 111.450, 112.000, 112.250
If the price fixes below the round 111.000 expect further descend of the USD/JPY quotes..
Alternatively the currency pair can recover toward 111.700-111.900.