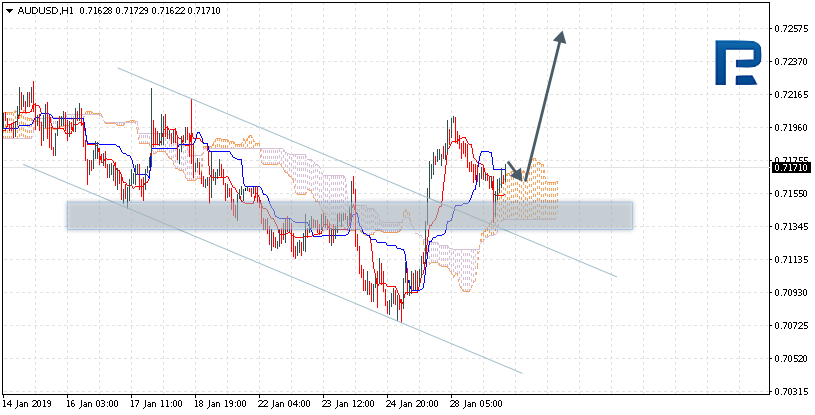
AUDUSD is trading at 0.7171; the instrument is moving above Ichimoku Cloud, thus indicating an ascending tendency. The markets could indicate that the price may test the upside border of the cloud at 0.7165 and then resume moving upwards to reach 0.7260. Another signal to confirm further ascending movement is the price’s rebounding from the support level. However, the scenario that Implies further growth may be cancelled if the price breaks the downside border of the cloud and fixes above 0.7130. In this case, the pair may continue falling towards 0.7055.
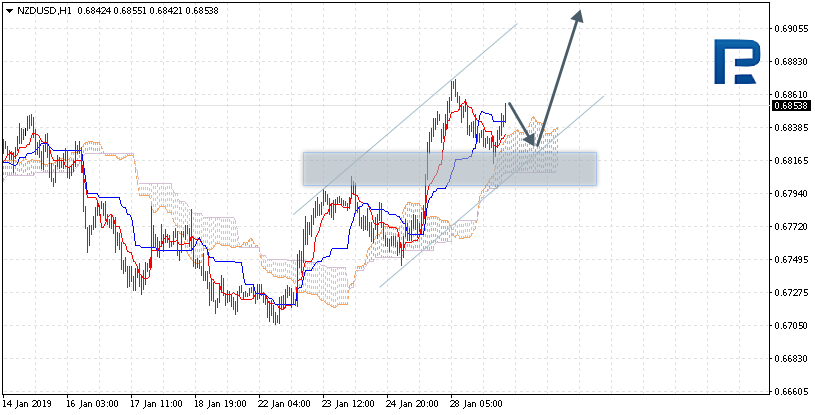
NZDUSD, “New Zealand Dollar vs US Dollar”
NZDUSD is trading at 0.6853; the instrument is moving above Ichimoku Cloud, thus indicating an ascending tendency. The markets could indicate that the price may test the upside border of the cloud at 0.6835 and then resume moving upwards to reach 0.6945. Another signal to confirm further ascending movement is the price’s rebounding from the channel’s border. However, the scenario that Implies further growth may be cancelled if the price breaks the downside border of the cloud and fixes below 0.6785. In this case, the pair may continue falling towards 0.6655.
USDCAD, “US Dollar vs Canadian Dollar”
USDCAD is trading at 1.3245; the instrument is moving below Ichimoku Cloud, thus indicating a descending tendency. The markets could indicate that the price may test the downside border of the cloud at 1.3265 and then resume moving downwards to reach 1.3125. Another signal to confirm further ascending movement is the price’s rebounding from the channel’s downside border. However, the scenario that implies further decline may be cancelled if the price breaks the upside border of the cloud and fixes above 1.3325. In this case, the pair may continue growing towards 1.3445.
Attention! Forecasts presented in this section only reflect the author’s private opinion and should not be considered as guidance for trading. RoboForex LP bears no responsibility for trading results based on trading recommendations described in these analytical reviews.
As the market shares of Bitcoin take us on a rollercoaster ride, e-wallets, cryptoexchanges, and other cryptocurrencies are popping up. New “crypto” apps offer mining services, exchange services, and even banking services. How will you navigate the potential security pitfalls of cryptocurrency scams?
We will examine some of the various ways bad actors are skimming the coffers of cryptocurrencies and what you as a consumer can do to avoid them.
Cryptocurrency Hack Attacks:
Fake News
With the era of social media and online news, fake news pushers have it easier than ever to create and spread online cryptocurrency scams by capitalizing on the gold rush. They simply mimic mainstream media web pages with catchy links, “Click here to earn one Bitcoin a day!” which bait users to enter their personal data and credit card information. Always remember, Think before you click! If it sounds too good to be true, then it usually is.
Phishing Scams
Another popular cryptocurrency scam is specialized phishing lures to penetrate cryptocurrency storage systems, such as mobile wallet apps, online exchanges, or trading apps. For example, Fortinet identified a phishing attack that invited investors to increase their gains by utilizing a trading bot application. The phishing email claimed that this app, Gunbot, automatically traded Bitcoins within set parameters to secure profits for investors. Recipients were encouraged to download the new trading bot, Gunbot attachment, but in actuality, it contained an executable that delivers Orcus Remote Access Terminal (RAT) malware.
RATs allow your computer or device to be controlled remotely. From there, it takes just a few keystrokes for the attacker to gain admin rights, which in turn gives him/her access to account and password information that may be stored in the far reaches of your device’s memory. The attacker may even strike gold if you have any Bitcoins or other cryptocurrencies that are stored on the hard drive.
Miner Malware
Mining cryptocurrencies takes a lot of resources and computational power. In fact, electricity is the number one operational cost to a Bitcoin miner. For that reason, nefarious hackers have resorted to “borrowing” resources by spreading Bitcoin-mining malware. Many of the current malware botnets are created to mine Bitcoins, whether they’re injected into computers, smart phones, or IoT gadgets. Although their intent isn’t malicious, it’s still unauthorized use of someone else’s property, and it costs the victim money and slows down the hijacked devices. If your battery is dying faster than usual or your device is running slower than normal, then you should scan your system with updated antivirus/anti-malware software.
Compromised e-Wallets
Crypto-currencies often store their value in file stores known as e-wallets. Wallets can be compromised, manipulated, stolen, and transferred, just like any other data stored on a computer. Kaspersky Lab recently detected a new attack strain called CryptoShuffler. The technique uses simple copy-and-paste tactics to steal valuable Bitcoins from unsuspecting users, straight out of their wallets. Most experts recommend keeping your value in an offline wallet that can’t be accessed by malware or hackers.
Fake e-Wallets
Bad actors create fake e-wallets to take advantage of people new to Bitcoin and other digital currencies as they are less likely to recognize fake apps. Lookout recently discovered three fake Bitcoin wallet Android apps in the Google Play Store that trick people into sending cybercriminals Bitcoins. Some of the apps had thousands of downloads. Fortunately, Google has since pulled them from the store. But more crop up every day as the craze for cryptocurrencies hungers on.
Transfer Trojans
Crypto-currency trojans monitor your computer waiting for what looks like the format of a crypto-currency account number. When it spots one, it “awakens” and replaces the intended account you are transferring value to with their account number. Unless you are aware of the switch, it will be game over if you hit the Send button.
Inherent Programming Weaknesses
Like any crypto implementation, the cryptologic algorithm is almost always far more sound than the program that implements it. In general, blockchaining can suffer from a programming bug or lack of good private key security (or Bitcoin wallets) which will it turn compromise the whole system. So, before you use a cryptocurrency or get involved in a blockchain project, make sure the software programmers are applying secure development lifecycle (SDL) processes to minimize bugs. And, protect your private crypto keys as you would the key to your house, or better yet, your safe.
Known Plaintext Crib Attacks
Good crypto makes the resulting cryptotext look like random gibberish. Theoretically, a crypto-attacker should not be able to figure out what the original plaintext looked like. With any blockchain technology, however, the format of the blocks is not a secret and can be easy to figure out. Certain letters, characters, or numbers are always in the same places in every block. This allows crypto-attackers to “crib” a partial representation of the plaintext in every crypto protected block. Plus, every block is a function of the previous block. This weakens the overall protection of the underlying encryption cipher. If the cipher isn’t weak, it isn’t a huge problem, but it does give attackers a starting edge.
Weak SHA-256?
Many security experts wonder if SHA-256, which contains the same mathematical weaknesses as its shorter, very much related SHA-1 precedent, is a concern for Bitcoin and blockchain (both usually use SHA-256). The answer is not right now. SHA-256 is strong enough for the foreseeable future. More importantly, since most of the world’s financial transactions and HTTPS transactions are protected by SHA-256, when someone breaks it, we’ll have far bigger things to worry about than just Bitcoin and blockchains. “Although if you’re planning to make a cryptocurrency or blockchain, start planning for “crypto-agility,” which is the ability to replace ciphers and keep the underlying program,” suggests Roger A. Grimes, from CSO.
Sites Get Hacked
Some of the bigger hacks are ascribed to unscrupulous operators who run away with millions in ill-gotten gains. Other common hacking threads surrounding Bitcoin is how often the centralized website controlling the cyber currency gets hacked. One such example is Youbit, a South Korean Bitcoin exchange that had to file for bankruptcy after criminals stole almost one-fifth of its clients’ holdings in the second major cyberattack on its systems this year.
DDoS attacks against major cyptocurrency exchanges or vaults like Mt. Gox or more recently, Coincheck, can take down whole cryptocurrency systems resulting in either stolen funds or corrupted files that are rendered worthless. Make sure to back up your value into an offline location because an FDIC bail out is not likely to happen. Moreover, always do business with a cryptocurrency website that is well secured and trustworthy.
Credentials Intercepted
Researchers have been warning for years about critical issues with the Signaling System 7 (SS7) that could allow hackers to listen in private phone calls and read text messages on a potentially vast scale, despite the most advanced encryption used by cellular networks.
Avoid using two-factor authentication (2-FA) via SMS texts for receiving OTP codes. Instead, rely on cryptographically-based security keys as a second authentication factor, for example Google Auth.
Timely Advice
Whether you decide to join the craze or sit back and watch the rollercoaster’s dips and turns, here are a few cyber security tips that will be wise to follow:
Research before investing to make sure your cryptocurrency website is well secured and trustworthy.
Do not trust Twitter or other social media for investment advice since fake news is a pitfall.
Think before you click! Do not fall for phishing scams or ads laced with malicious links.
Report phishing scams, and don’t share or forward the lure to others.
Closely monitor your cryptocurrency wallets, credit card accounts, and banking accounts.
Be wary of social engineering attempts to steal your credentials.
Routinely scan your computers, laptops, mobile phones, and other devices using updated and patched antivirus/anti-malware software.
Avoid using two-factor authentication via SMStexts, rather use Google Auth.
Practicing routine cyber hygiene will help you avoid the hidden traps lying wait on the web.
EUR kept rising against the USD. Right now the local support and resistance levels are 1.14200 and 1.14450. Mario Draghi, the head of the Central Bank of Europe, is worried about the growing risks on the global markets. The regulator intends to keep the monetary policy the same. The investors are waiting for the Federal Reserve meeting. Keep an eye on the US/China trading conflict and open positions from the key levels.
At 17:00 (GMT +2:00) US will publish the Customer Trust Index.
The price fixed above 50 MA and 200 MA which showcases the power of the buyers.
The MACD histogram is in the positve zone and keeps rising which gives a signal to buy EUR/USD.
The Stochastic Oscillator is in the neutral zone, the %K line is below the %D line which shows a bearish mood.
Trading recommendations
Support levels: 1.14200, 1.13900, 1.13700
Resistance levels: 1.14450, 1.15000
If the price fixes above 1.14450, expect the price to grow toward 1.14800-1.15000.
Alternatively the price can fall toward 1.14000-1.13800.
The GBP/USD currency pair
Technical indicators of the currency pair:
Prev Open: 1.31838
Open: 1.31520
% chg. over the last day: -0.36
Day’s range: 1.31294 – 1.31683
52 wk range: 1.2438 – 1.4378
The pound has stabilized around the key range of 1.31300 and 1.32000. The financial market participants are waiting for the Brexit vote in the parliament. Today you should minimize risks when opening GBP/USD orders.
Keep an eye on the US economic reports.
The indicators do not provide precise signals, the price has crossed 50 MA.
The MACD histogram is close to 0.
The Stochastic Oscillator is in the neutral zone, the %K line is crossing the %D line. There are no signals at the moment.
Trading recommendations
Support levels: 1.31300, 1.30600, 1.30000
Resistance levels: 1.32000, 1.32500
If the price fixes above 1.32000 expect it to grow further toward 1.32500-1.32750.
Alternatively, the quotes can fall toward 1.30700-1.30400.
The USD/CAD currency pair
Technical indicators of the currency pair:
Prev Open: 1.32183
Open: 1.32592
% chg. over the last day: +0.30
Day’s range: 1.32448 – 1.32784
52 wk range: 1.2248 – 1.3664
Yesterday USD recovered against the CAD. Right now the quotes are moving sideways. The trading instrument created the local support and resistance levels at 1.32500 and 1.32800. USD/CAD has a tendency to descend. You should open positions from the key levels. Keep an eye on the US newsfeed.
The Economic News Feed for 29.01.2019 is calm.
The indicators do not provide precise signals, the price fixed betwee 50 MA and 200 MA
The MACD histogram is close to 0.
The Stochastic Oscillator is in the neutral zone, the %K line is above the %D line which gives a sinal to buy USD/CAD..
Trading recommendations
Support levels: 1.32500, 1.32250
Resistance levels: 1.32800, 1.33150
If the price fixes below the local support 1.32500 expect the quotes to fall further toward 1.32250-1.32000..
Alternatively the quotes can recover toward 1.33000-1.33200.
The USD/JPY currency pair
Technical indicators of the currency pair:
Prev Open: 109.541
Open: 109.317
% chg. over the last day: -0.14
Day’s range: 109.130 – 109.392
52 wk range: 104.56 – 114.56
USD/JPY technical picture remains ambiguous. The yen remains in a flat. The key range is 109.150-109.400, with prospects to descend. Keep an eye on the US Treasury bonds yield and open positions from the key levels.
The Economic News Feed for 29.01.2019 is calm.
The indicators do not provide precise signals, the price has crossed 50 MA and 200 MA.
The MACD histogram is in the negative zone but above the signal line which gives a weak signal to sell USD/JPY.
The Stochastic Oscillator is in the neutral zone, the %K line is crossing the %D line. There are no signals at the moment..
Trading recommendations
Support levels: 109.150, 108.900, 108.700
Resistance levels: 109.400, 109.600, 109.850
If the price fixes below 109.150, expect the quotes to fall toward 108.900-108.700.
Alternatively the quotes can grow toward 109.600-109.800.
The US dollar weakened slightly against a basket of major currencies during yesterday’s trading session. The US dollar index (#DX) closed yesterday in the negative zone (-0.04%). Financial market participants took a wait-and-see attitude before the Fed interest rate decision. Also, investors will follow the trade relations between the US and China. Negotiations between countries should take place this week. However, the case of Huawei Technologies Co. may worsen the situation. Yesterday, the US judicial authorities accused Huawei of stealing intellectual property.
At the moment, investors’ attention is focused on the UK Parliament vote on Brexit deal, which will be held today. The first version of the agreement proposed by Theresa May was criticized and rejected. The new draft contains 19 amendments, for which parliamentarians will vote.
The “black gold” prices are recovering after a decline the day before. At the moment, futures for the WTI crude oil are testing the mark of $52.10 per barrel. At 23:30 (GMT+2:00), the API weekly crude oil stock will be published.
Market Indicators
Yesterday, the bearish sentiment was observed in the US stock market: #SPY (-0.76%), #DIA (-0.93%), #QQQ (-1.24%).
The 10-year US government bonds yield fell slightly. At the moment, the indicator is at the level of 2.73-2.74%.
The News Feed on 29.01.2019:
– Consumer confidence index in the US at 17:00 (GMT+2:00); – UK Parliament vote on Brexit deal at 21:00 (GMT+2:00).
On Monday the 28th of January, trading on the EURUSD pair closed up. After a downwards correction to 1.1390, the bulls shifted the Asian session’s high from 1.1426 to 1.1444. The single currency enjoyed increased demand as investors adjusted their positions ahead of Tuesday’s vote in the British parliament on an EU withdrawal agreement. The euro crosses all rose except for EURJPY.
Day’s news (GMT+3):
10:00 Switzerland: trade balance (Nov).
10:45 France: consumer confidence (Jan).
12:15 UK: BoE Deputy Governor Woods’ speech.
17:00 US: S&P/Case-Shiller home price indices (Nov).
18:00 US: consumer confidence (Jan).
Fig 1. EURUSD hourly chart.
Current situation
At the beginning of Monday’s European session, the euro slid to 1.1390. The drop occurred just as I’d expected, although it missed my target by 17 pips. The sharp reversal on the EURGBP pair changed market expectations among speculators until the end of the day.
Trader attention has switched to the FOMC press conference set to take place on Wednesday. Markets are expecting the regulator to announce a hiatus on their tightening of monetary policy. Aside from the FOMC, the British parliament’s vote on a Brexit deal will also be the focus of traders. This will have an influence on GBP currency pairs, which will in turn affect the major currencies.
We also shouldn’t forget about news of the US government bringing criminal charges against Chinese tech firm Huawei. This could have an effect on talk between the two countries as well as on risky assets. A retreat from riskier assets would be negative for the euro.
At the time of writing, the euro is trading at 1.1437 against the greenback. Considering that all the euro crosses are trading up, I’m predicting the 1.1444 high to be revisited today. 1.1460 – 1.1470 is my target range.
It’s been a decade of lows for commodities after posting 7 declines in 11 years, but we’ve seriously underestimated lithium. It’s back with a vengeance in 2019.
The commodities market endured yet another annus horribilis, with just four commodities—natural gas, uranium, cocoa and wheat—recording any uptick at all. Last year’s 12 percent slide by the Bloomberg Commodity Index–spurred by 20 percent-plus declines by industrial bellwethers like West Texas Intermediate crude, steel and platinum—came in the wake of two years of modest gains.
Viewed against that kind of backdrop, lithium’s 50 percent correction that snapped a multi-year winning streak appears less vicious. It’s important to remember that prior to the crash, lithium had enjoyed a meteoric rise with prices doubling since the beginning of 2016 and nearly quadrupling over the past decade. The fact that much of the rally coincided with a sharp rise in the value of the U.S. dollar makes it all the more remarkable.
Investing in the commodity market can be a roller-coaster ride; what with the incessant boom-and-bust cycles driven by the ebb and flow in infrastructural spending, production ramps/cutbacks and stockpiling/destocking supplies. And just like other financial markets, trader sentiment plays a big role in determining trajectories.
Unfortunately, it’s the latter scenario that took center-stage during last year’s lithium crash. A furor around anticipated new supply especially from China’s new hard-rock projects and Chilean brine mines got out whack and derailed the market.
The situation was not helped by Wall Street punters sounding the alarm over the dangers of oversupply …
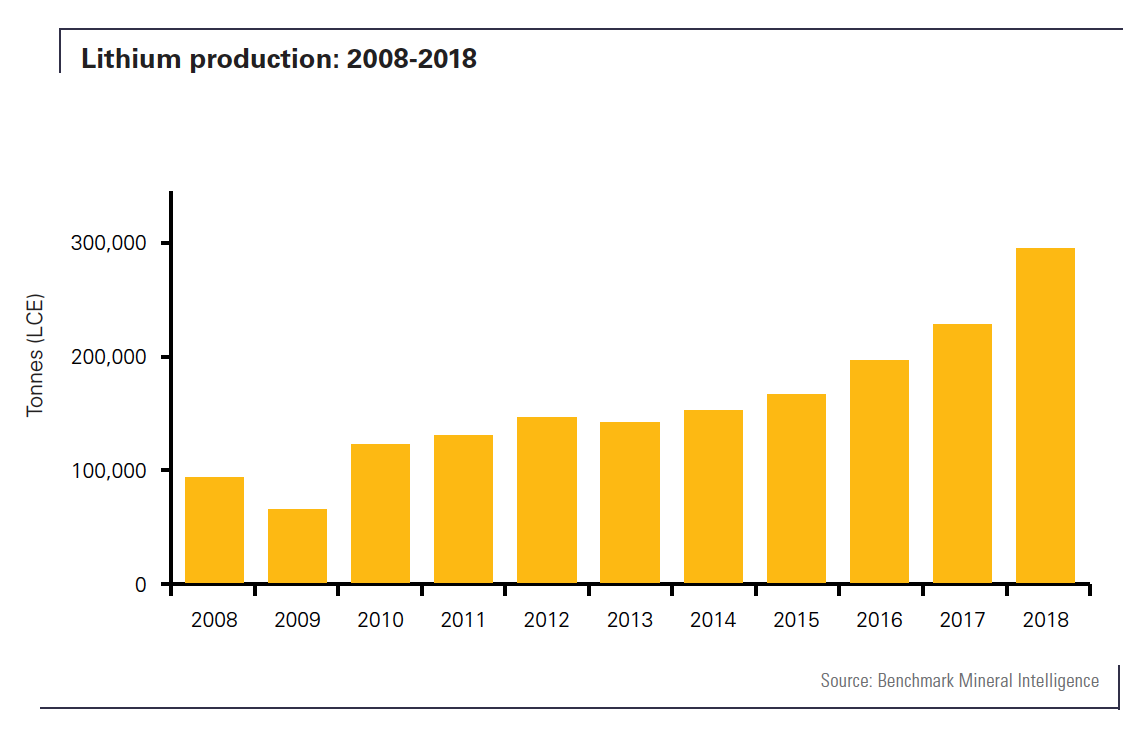
Shares of major lithium producers and explorers including Sociedad Quimica y Minera de Chile (NYSE:SQM), Albemarle Corp. (NYSE:ALB) and Orocobre Ltd (ASX:ORE) received a severe hammering in March after Morgan Stanley forecast that Chilean low cost brine producers could add as much as 200kt per year by 2025, while expansion of China’s and Australia’s hard-rock mines could pump in another half a million metric tonnes over the timeframe. That’s certainly a massive production ramp-up considering that global production in 2017 totaled just over 200kt.
In August, Macquarie Research provided the final straw after chiming in with a warning that the market was “sleepwalking into a tsunami of oversupply.”
The report put the final nail in the coffin of the decade-long lithium rally– Fastmarkets reckons that prices for battery-grade lithium carbonate in China, by far the world’s largest consumer of high-grade lithium carbonate, tumbled 50.31 percent last year to 75,000-83,000 ($10,885-12,046) yuan per tonne from 158,000-160,000 ($22,932-23,222) yuan per tonne the previous year, as demand waned.
But maybe the bear camp rushed their fences this time…
While it’s undeniable that the carnage managed to exceed even Morgan Stanley’s decidedly pessimistic outlook for global lithium prices to drop 45 percent by 2021, the fundamentals suggest that the selloff was greatly overdone and such low prices cannot be justified by simple market forces of supply and demand.
According to London-based Benchmark Minerals Intelligence senior analyst Andrew Miller, the disconnect between lithium prices and the demand side of the equation has never been bigger.
Reality Check
A cross-section of materials experts have raised eyebrows at the negative assessment, criticizing the investment analysts for underestimating the rise in lithium demand and the complex nature of lithium mining and production ramps. According to them, both MS and Macquarie failed to account for just how big the gap between supply forecast and actual production can be.
And, they might be spot on.
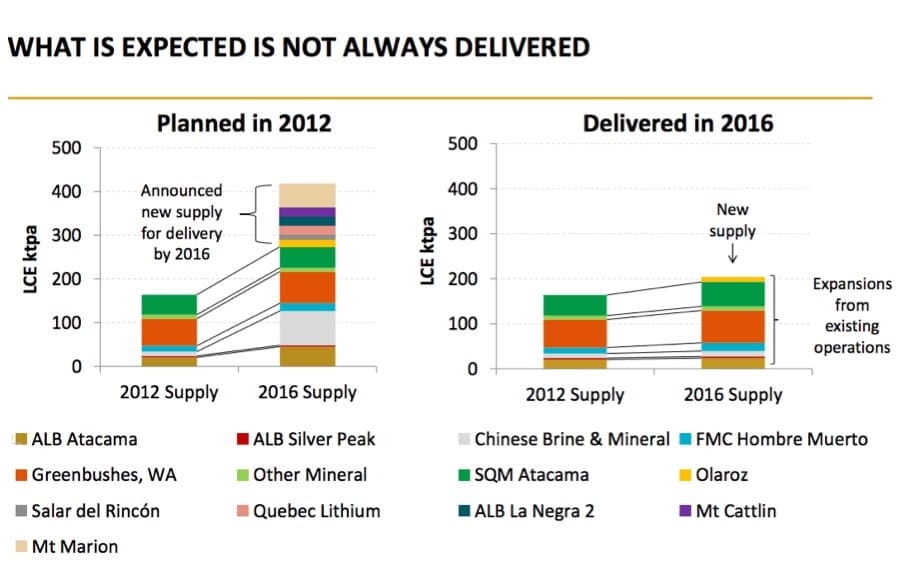
Supply expansions in 2018 came in much lower than predicted and the tsunami of oversupply forecast by the likes of Macquarie Research proved to be little more than changing tides in the lithium supply chain.
A good case in point is Brisbane-based Orocobre, which has become the poster child for just how challenging new brine mining can be. The company’s Salar de Olaroz project in Argentina took seven years to hit its stride but still came up short of production targets. Meanwhile, run-ins with the courts and regulators coupled with mutual accusations of license violations facing Chile’s lithium giants SQM and Albemarle at their Atacama brine projects further reinforce this point.
The screenshot below from Orocobre’s investor slide presentation is a sobering reminder to this reality.
In terms of feedstock supply, SQM and Albemarle had laid out plans for increased production rates. But as is often the case with brine evaporation, the process has been hindered by seemingly endless production delays. SQM hit technical obstacles at its new brine conversion facilities that delayed its target capacity of 70,000 tpa LCE by end of 2018 while Albemarle continues to struggle to achieve full capacity at La Negra II.
The situation has not been much better in China—the ultimate lynchpin to the lithium bear thesis. Many Chinese brine producers in the Qinghai region had outlined plans to triple or quadruple capacities over the coming 3-4 years. A visit by Benchmark Minerals to these operations, however, has painted a dire picture—the technical challenges related to high magnesium concentrations in the region are nowhere near being comprehensively overcome. Across Qinghai’s 10 producers, only an additional 5,000-10,000 tonnes of lithium product found its way to the market, majority of which failed to reach technical grade specifications. This, in effect, means that much of what came online from the region was either reprocessed thus adding to costs or converted to lithium hydroxide in a bid to meet growing demand for nickel-rich cathode technologies.
Although tight credit in China forced some lithium buyers to destock and contributed to the glut, the predicted huge oversupply failed to materialize. Around mid-September, analysts at CRU estimated lithium surplus for 2018 at a relatively mild 22,000 tonnes against a demand of 277,000 tonnes.’
So far, there is no clear data or evidence that that the lithium demand narrative is about to slowdown, let alone reverse. On the contrary, certain emerging trends in the industry suggest just the opposite.
The biggest near-term driver for lithium demand is the NCM trend. The shift towards cathodes that use huge amounts of lithium hydroxide is already underway, something that is expected to trigger a huge NCM (nickel-cobalt-manganese) ramp up. Benchmark Minerals estimates that 44 percent of mega-and-giga-factories will use lithium as a raw material by 2028 translating into 534,000 tonnes of additional demand.
That projection seems to resonate with Elon Musk’s ambitious target to build 20 gigafactories across the globe over the next decade. Miller sees 2019 as the tipping point where demand will eventually outstrip supply starting 2020.
Meanwhile, Roskill has predicted that the shift to higher-nickel-cathode materials will push many lithium producers to favor production of lithium hydroxide over lithium carbonate thus taking some pressure off the lithium carbonate supply side. The firm has forecast lithium demand to expand by a brisk 21 percent annual clip between 2018 and 2025 with demand expected to grow 13.5 percent in the current year.
But, of course, no lithium bull thesis would be complete without the EV angle.
Currently, the EV market accounts for about 47 percent of global lithium demand. That, however, is expected to drastically change as EV penetration rates coupled with the ongoing trend of electric vehicles using larger battery packs that yield longer ranges leading to electric mobility gobbling up 83 percent of lithium supply a by 2027.
Fastmarkets has predicted EV penetration to hit 15 percent by 2025 from 2 percent currently. EV demand has actually been beating estimates and is constantly being revised upwards to reflect this. The EV explosion is expected to drive a nearly six-fold increase in lithium demand for the forecast period.
IMG: Larger View Source: Infinity Lithium company presentation
Key lithium trends to watch in 2019 and beyond
• Lithium carbonate prices will steady in 2019 before picking up steam starting 2020 • Lithium hydroxide prices could soften a little bit after remaining resilient in 2018 • China will become less important as a global price trend driver as demand rapidly builds up in other key markets
Miller advises investors to keep an eye on new spodumene production, particularly how quickly it can be integrated into the chemical and converter supply chain and turned into either lithium carbonate or hydroxide. A slower ramp is likely to lead to supply constraints and raise prices and vice-versa.
Want to review my Cable trade, for the past 2 months, I have been net long GBP moving in and out as need to remove event risks, the reason for the net long call was the chances of some sort of deal was always the most likely outcome.
Over the past week and a half that scenario is now looking like a certainly and Cable is pricing this idea.
(Source: Bloomberg)
There is a clear break out here and the move through the 200-day moving average is a positive sign. Suspect it will shift higher still on an actually deal. However, the market is clearly biased to this way of thinking and thus the shift higher is unlikely to be a ‘gapping’ movement as a ‘deal’ is starting to be baked in. Looking for 1.325/30
Next 2 weeks also sees the first central bank meetings of 2019, it starts this week with the FOMC later in the week.
Key points to the meeting:
Federal Funds rate will remain on hold – the question is, are we actually at the ‘neutral’ cash rate already?
Watch how many different members use ‘patient’ and ‘data dependent’ – the communication currently is ‘lock step’ with a very consistent message. This week’s meeting is also the first of eight press conference meetings for 2019. Will be listening out for clues about where the Board sees rates in the latter half of the year.
There are also signs that the Board is considering changes to its balance sheet policy, unlikely to be done at this week’s meeting. However, its plausible this could happen this year thus further to the FOMC rate calls expect Chairman Powell to reiterate that balance sheet policy is ‘flexible’ in principle.
All-in-all these are dovish stances, and the conformation of this call is likely moving the growth communication from ‘strong’ to ‘solid’.
Reiterate that the USD is likely to ease over the coming period.
15 and Counting: Inflation
AUD has been rather resilient of late. This is despite the fact Chinese data has been rather poor and political risk has increased. The movement back toward 71.60/70 was solid without show signs buyers are keen to break it out.
I believe this week’s inflation data should be a trigger for a move back toward mid to low 70cents. Australian inflation just hasn’t been firing on any level over the past 3 ½ years, come Wednesday it is likely that for the 15th consecutive quarter trimmed-mean (core) inflation, the RBA’s preferred measure of inflation, will be below its target band of 2% to 3%.
Housing had done most of the heavy lifting over the past four quarters however housing inflation is likely to have flat lined in the last quarter meaning other components will need to have pick up the slack and I can’t see this happening. The question that comes from this statement is at what point does the RBA admit this is becoming a consistent problem that causes them to act on rates?
Recent concerns about peso’s depreciation have been exaggerated. In the most dangerous international environment since the postwar era, there is no room for complacency, however.
In the past, international and domestic critics of the Duterte government have complained that the Philippine peso has fallen “six straight years,” which is seen as a sign of the failure of Duterte agenda.
In March 2017, Bloomberg reported that “Asia’s ugly duckling of 2017 is the peso, thanks to Duterte.” At the time, peso’s weakening was explained, oddly enough, by investors who had been spooked by allegations of “unlawful killings and corruption.”
More recently, the peso is said to face an additional threat, “a mid-term election that may compound concerns about its economy.” This time Bloomberg believes that “political uncertainties” pose an added source of pressure.” Yet, recent surveys do not seem to support such speculation.
Still other reports see “political risks” where such do not necessarily exist, while approaching the peso’s weakening as if it was fueled by mainly internal forces.
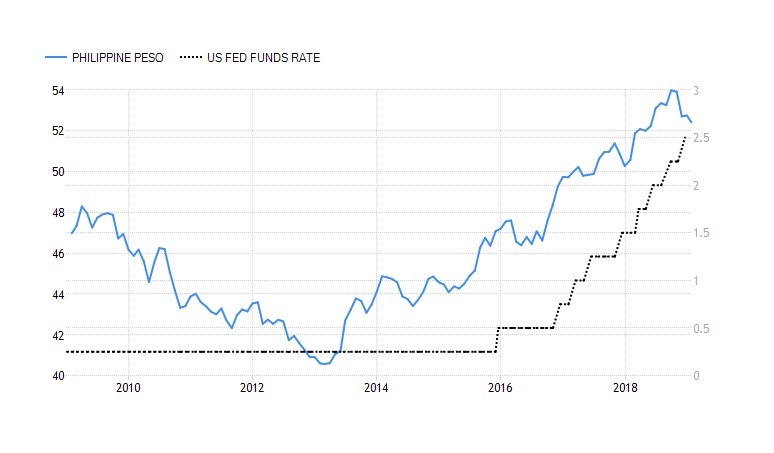
In reality, most currencies in emerging markets have depreciated since first expectations that the U.S. will start rate normalization and when the actual rate hikes began – about “six straight years” ago, well before Duterte (Figure).
Figure
Since the Fed’s signaling of normalization and rate hikes, Philippine peso has depreciated almost in parallel.Forces behind peso movements
A series of well-known forces have fueled recent peso depreciation. In the fall, inflation reached an intolerable high of 6.7%. It was boosted by a price effect associated with tax reforms (TRAIN), rising oil prices and a failure to manage rice prices. Accordingly, Philippine peso depreciated until early October.
Yet, the pressures that have been associated with overheating are likely to weaken in 2019 as the TRAIN-related price pressures should ease in the coming months.
Also, the slowing international economy has penalized oil. Crude oil exceeded $75 in early October but is now around $55 (a U.S.-Sino trade compromise could contribute to rising prices again, however).
In the past, the quota system failed to keep rice price in control; the new import tariff system should stabilize it.
Moreover, high loan growth has made some observers uneasy. While it is associated with the infrastructure drive, it has to be monitored.
Most importantly perhaps, some observers feel uncomfortable with current account deficit (CAD). Yet, the widening CAD is the effect of the infrastructure drive. It has been expanding as a result of imports, which support infrastructure development.
Furthermore, the slowdown of electronic exports, which account for more than half of Philippine exports, is hardly a domestic challenge. U.S. trade wars have undermined the recovery of world trade. However, there are some possible new shifts in the international horizon.
Last year, the tighter dollar, boosted by the Fed’s rate hikes, went hand in hand with tighter financial conditions. That is no longer the case. Also, last year Trump’s tax cuts gave a one-time high for the U.S. economy. But now U.S. growth may have peaked.
Accordingly, the prospects of slower growth and lower inflation may have made the Fed less hawkish.
Risky international environment, budget passage
Nevertheless, the international environment, including U.S. trade wars, poses more threats than ever since the postwar era.
If the U.S.-Sino trade truce paves way to a compromise by March 1, world demand may improve. But if the tensions spread as they did last year; world demand is likely to further deteriorate. And even if trade compromise can be found, tensions are likely to linger in the technology sector.
Moreover, the White House may target the ASEAN in its trade wars, as it has suggested since mid-2018.
In 2018, the Philippines expansion amounted to 6.2%. Although inflation did penalize the government’s downwardly-revised goal of 6.5 to 6.9%, the country is one of the fastest growing economies in Asia and relatively well-positioned to absorb shocks. Moreover, the Bangko Sentral ng Filipinas (BSP) hiked policy rates several times in 2018, which makes further tightening less likely in 2019.
Yet, the status quo permits no complacency. The inflation-induced reduction of the country’s economic growth in the fourth quarter of 2018, which penalized the annual figure, should serve as a warning sign for a belated 2019 budget passage.
Even if a re-enacted budget were to be passed now, the infrastructure programs that are of critical national importance cannot proceed until after the mid-year. That, in turn, has potential to harm the current year’s economic growth, once again. Time is money. Consequently, a rapid 2019 budget passage is vital.
The Duterte fiscal expansion has potential to continue well into the early 2020s, which bodes well for economic growth – as long as political impasse does not penalize economic progress.
About the Author:
Dr. Dan Steinbock is the founder of Difference Group and has served at the India, China and America Institute (US), Shanghai Institute for International Studies (China) and the EU Center (Singapore). For more, see http://www.differencegroup.net/
The original commentary was released by The Manila Times on January 28, 2018
After completing the ascending wave at 1.1348 and breaking the descending channel, EURUSD has formed a continuation pattern near the broken channel and extended the wave twice by reaching 1.1425. Possibly, today the pair may form a new consolidation range near the highs and expand it up to 1.1433. Later, the market may form a new descending structure towards 1.1398. If the instrument breaks this range to the downside, the price may continue trading inside the downtrend with the first target at 1.1348.
GBPUSD, “Great Britain Pound vs US Dollar”
GBPUSD has broken 1.3138 upwards and may continue growing towards 1.3218. Today, the pair may reach this level and start a new decline to return to 1.3138. After that, the instrument may resume falling towards 1.3016.
USDCHF, “US Dollar vs Swiss Franc”
USDCHF has broken 0.9939 downwards and may continue falling towards 0.9907 (an alternative scenario). Possibly, the pair may continue the correction to reach 0.9890. Later, the market may f continue trading inside the uptrend with the target at 0.9990.
USDJPY, “US Dollar vs Japanese Yen”
USDJPY is consolidating to break 109.41 downwards. Possibly, the pair may fall towards 108.93 and then grow to return to 109.41. In fact, the price may continue the correction to the downside to reach 108.84 (an alternative scenario). According to the main scenario, the instrument is expected to form one more ascending structure with the target at 110.10.
AUDUSD, “Australian Dollar vs US Dollar”
AUDUSD has broken 0.7153 and may continue growing towards 0.7234. After that, the instrument may decline to reach 0.7155 and then form one more ascending structure with the target at 0.7350.
USDRUB, “US Dollar vs Russian Ruble”
USDRUB is still trading downwards. Possibly, the pair may extend the structure to reach 65.45 and then form one more ascending structure with the target at 66.36. Later, the market may continue trading inside the downtrend towards 62.25.
XAUUSD, “Gold vs US Dollar”
Gold has broken the consolidation range upwards and may continue growing towards 1311.80. Today, the pair may fall to reach 1294.04 and then start a new growth to return to 1311.80 from below. After that, the instrument may form a new descending structure with the target at 1254.15.
BRENT
Brent is trading below 61.16. Possibly, the pair may form one more ascending structure to reach 62.08 and then fall to return to 61.16. Later, the market may break this range to the upside and continue trading upwards with the target at 63.95.
Attention! Forecasts presented in this section only reflect the author’s private opinion and should not be considered as guidance for trading. RoboForex LP bears no responsibility for trading results based on trading recommendations described in these analytical reviews.
EURUSD is falling. It looks like investors aren’t very interested in the USD as a “safe haven” asset since the country started providing some positive signals.
So, the Government Shutdown in the USA is either over or put on hold, no one can say for sure. Last Friday, January 25th, the US President Donald Trump said that he would reopen the Federal government for the next three weeks until February 15th while the negotiations over how to secure the American-Mexican border continued.
It is known that the border issue was the only aspect, which hadn’t been agreed on. However, the wall is very important for Trump and his office: he already said that the issue had to be solved until February 15th, otherwise he would be forced to appeal to the constitution and declare a national emergency. Indeed, it is a possibility, but only if worse comes to worst.
This entire week will be very interesting for the USD. The two-day meeting of the US Federal Reserve will be over on Wednesday and the regulator is expected to announce its balance. There is an opinion that the Fed is selling its assets slower than it possibly could and investors seem to be more sensitive to this than to the rate changes. It looks like the regulator fell under influence of the White House and decided to withdraw money for the system in a softer way than it was expected. Earlier, market players expected the Fed to be more aggressive in February-April.
Looking at the H4 chart, one can see that EURUSD is again trading inside the rising correctional channel, but the question is for how long. Is it a temporary pullback inside a new mid-term descending impulse or a continuation of the ascending correction? Despite breaking the support line of the correctional channel, the price returned into it. However, the convergence on MACD saw it coming. By now, the correctional impulse to the upside has reached the retracement of 50.0%, which happens quite often. If a new descending impulse manages to break the support line at 1.1335, fix below it and then test the fractal support at 1.1289, the price will form a mid-term wave to the downside. The first target of this wave may be the key low at 1.1215.
As we can see in the H1 chart, the pair is trading inside the “overbought zone”, which may indicate a new short-term pullback. Another signal for further decline is “Black cross” on Stochastic Oscillator. The target of this decline is the support line at 1.1335. At the same time, one shouldn’t exclude a possible rebound from this area towards the retracement of 61.8% at 1.1463.
Disclaimer
Any predictions contained herein are based on the authors’ particular opinion. This analysis shall not be treated as trading advice. RoboForex shall not be held liable for the results of the trades arising from relying upon trading recommendations and reviews contained herein.