Author Archive for InvestMacro – Page 292

The Analytical Overview of the Main Currency Pairs on 2019.01.31

Analytics by JustForex

The EUR/USD currency pair

Technical indicators of the currency pair:
  • Prev Open: 1.14303
  • Open: 1.14782
  • % chg. over the last day: +0.47
  • Day’s range: 1.14781 – 1.15141
  • 52 wk range: 1.1214 – 1.2557

Yesterday USD was weakened against the other world currencies. The Federal Reserve, as expected, kept the key interest range at 2.25-2.50%. The regulator noted the they do not expect to increase the rate soon and will base their decision on the future economic reports. Right now the quotes are consolidating around 1.14750-1.15100. EUR has decent growth prospects. You should open positions from the key leveles.

The Economic News Feed for 31.01.2019:

  • – Labour Market Report (GER) – 10:55 (GMT+2:00);
  • – GDP Report (EU) – 12:00 (GMT+2:00);
  • – Primary Retail Sales (US) – 17:00 (GMT+2:00).
EUR/USD

The price fixed above 50 MA and 200 MA which points to the power of the buyers.

The MACD histogram is in the positive zone but below the signal line which gives a weak signal to buy EUR/USD.

The Stochastic Oscillator is in the neutral zone, the %K line is below the %D line which points to the corrective movement of the EUR/USD quotes.

Trading recommendations
  • Support levels: 1.14750, 1.14450, 1.14100
  • Resistance levels: 1.15100, 1.15500

If the price fixes above1.15100 expect the quotes can grow toward 1.15500-1.15700.

Alternatively the quotes can correct toward 1.14500-1.14300.

The GBP/USD currency pair

Technical indicators of the currency pair:
  • Prev Open: 1.30638
  • Open: 1.31067
  • % chg. over the last day: +0.36
  • Day’s range: 1.30983 – 1.31562
  • 52 wk range: 1.30983 – 1.31562

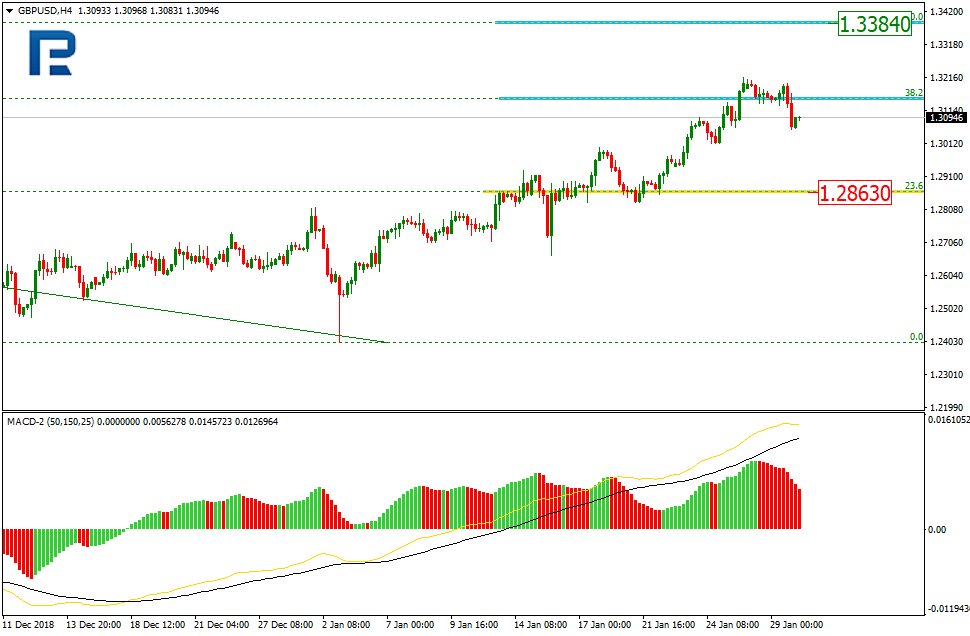
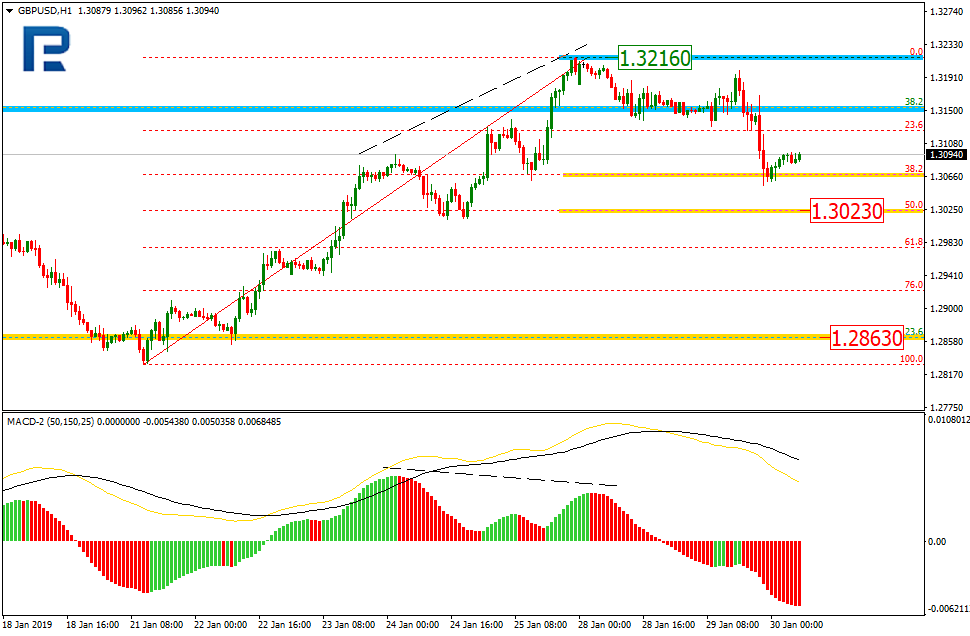
GBP/USD keeps consolidating. There is no single defined trend. The investors are waiting for the new data regarding the Brexit process. USD remains under pressure after the Federal Reserve meeting. The local support and resistance levels are 1.30900 and 1.31350. You should open positions from these levels.

The Economic News Feed for 31.01.2019 is calm.

GBP/USD

The indicators do not provide precise signals, the price has crossed 50 MA.

The MACD histogram is in the positive zone and keeps rising, which gives a strong signal to buy GBP/USD.

The Stochastic Oscillator is in the neutral zone, the %K line is below the %D line which points to a bearish mood.

Trading recommendations
  • Support levels: 1.30900, 1.30500, 1.30000
  • Resistance levels: 1.31350, 1.32000

If the price fixes below 1.3000 consider looking for the market entry points to open short positions. The movement will tend to 1.30500-1.30200.

Alternatively, the quotes can grow toward 1.31750-1.32200.

The USD/CAD currency pair

Technical indicators of the currency pair:
  • Prev Open: 1.32669
  • Open: 1.31473
  • % chg. over the last day: -0.96
  • Day’s range: 1.31203 – 1.31527
  • 52 wk range: 1.2248 – 1.3664

USD/CAD began to descend again after aggressive sell-offs yesterday. The CAD is strengthened against the USD by more than 100 points and is consolidating around 1.31200-1.31550. It is additionally upported by the positive oil quotes dynamics. The trading instrument has a tendency to descend. We are waiting for important economic reports.

The Economic News Feed for 31.01.2019:

  • – GDP Report (CAD) – 15:30 (GMT+2:00);
USD/CAD

The price fixed below 50 MA and 200 MA which points to the power of the sellers.

The MACD histogram is in the negative zone but above the signal line which gives a weak signal to sell USD/CAD.

The Stochastic Oscillator is in the neutral zone, the %K line is above the %D line which points towards a corrective movement.

Trading recommendations
  • Support levels: 1.31200, 1.30750
  • Resistance levels: 1.31550, 1.31900, 1.32100

If the price fixes below 1.31200 expect the quotes to descend toward 1.30700-1.30500.

Alternatively the quotes can recover toward 1.31800-1.32000.

The USD/JPY currency pair

Technical indicators of the currency pair:
  • Prev Open: 109.254
  • Open: 109.035
  • % chg. over the last day: -0.38
  • Day’s range: 108.591 – 109.066
  • 52 wk range: 104.56 – 114.56

USD/JPY is showing an aggressive sell-off and updating the local minimums. The demand for the USD is significantly weakened after the Federal Reserve meeting and decision not to increase the insterest rates. The quotes are testing the local support at 108.600 and resistance at 108.900. USD/JPY has prospects to descend lower.

The Economic News Feed for 31.01.2019 is calm.

USD/JPY

The indicators point to the power of the sellers, the price has fixed below 50 MA and 200 MA.

The MACD histogram is in the negative zone and below the signal line which gives a strong signal to sell USD/JPY.

The Stochastic Oscillator is in the neutral zone, the %K line is crossing the %D line. There are no signals at the moment.

Trading recommendations
  • Support levels: 108.600, 108.300, 108.000
  • Resistance levels: 108.900, 109.150, 109.450

If the price fixes below 108.600 the quotes can fall futher toward 108.300-108.000.

Alternatively the quotes can recover toward 109.000-109.150.

Analytics by JustForex

Dollar Is Declining After the Fed Meeting

by JustForex

The US dollar weakened against a basket of major currencies after the Fed meeting. The US Federal Reserve kept the key interest rate range at 2.25-2.50% and said it would be patient with its possible increase this year. Fed Chairman, Jerome Powell, also confirmed signals that the regulator would take into account future economic reports and would not rush into a further tightening of monetary policy. The US dollar index (#DX) closed in the negative zone (-0.51%).

Also yesterday, ambiguous statistics from the US were published. Thus, the ADP nonfarm employment change increased to 213K in January, while experts expected 180K. However, data for January were revised downward from 271K to 263K. The pending home sales index declined by 2.2% in December, while investors expected an increase of 0.8%.

The bullish sentiment is prevailing in the “black gold” market. At the moment, futures for the WTI crude oil are testing the mark of $54.50 per barrel. Positive data on economic activity in the manufacturing sector in China also support oil quotes.

Market Indicators

Yesterday, the aggressive purchases were observed in the US stock market: #SPY (+1.58%), #DIA (+1.82%), #QQQ (+2.54%).

The 10-year US government bonds yield fell significantly. Currently, the indicator is at the level of 2.67-2.68%.

Economic Data on 31.01.2019:

– Statistics on the German labor market at 10:55 (GMT+2:00);
– Eurozone GDP data at 12:00 (GMT+2:00);
– Report on Canada GDP at 15:30 (GMT+2:00);
– New home sales in the US at 17:00 (GMT+2:00).

by JustForex

ADP Numbers and the US Fed Hit the Launch Button

By TheTechnicalTraders.com

Get ready for a potential blastoff in the US stock market as all-stars are beginning to line up for an incredible upside price rally.   The Fed, taking a warning from the markets and the global economy, has decided to leave rates unchanged for now.  It appears they have moved to a more cautious stance in an attempt to foster continued economic growth over rate increases.  The purpose of this is clear to anyone watching what is happening across the planet – the US is the strongest, most mature economy on the planet.  The US fed can’t risk creating another debt/credit collapse at this time.  It is better to move in measured steps than to move “all-in” over a short period of time.

Additionally, ADP released their Jobs numbers for December 2018 today with an expected 271k jobs number.  This is an incredible number for December.  Our interpretation of December employment numbers is that the Christmas hiring has already ended and many companies are have already shipped/supplied product for the holiday season.  By December, we expect to see weaker jobs data with the expectation that firms are downsizing payroll while planning for the Spring sales season to get started.  This does not take into consideration the weather events that typically plague December.

The only things left for this rally to really blast off would be strong earning data and some resolution to the China trade issues.  If either of these “booster rockets” hit the news cycles over the next 30 days, we could easily see the US stock market rally toward all-time highs in a matter of weeks – not months.


Pay attention to the way price is setting up and take special note of the fact that the US economy and stock market are really the biggest, and safest location on the planet, right now, for any capital.  As long as these numbers keep pouring in like this and the US Fed doesn’t hit the “panic button”, there is a very good chance that the US markets will continue to rally until some type of foreign market event deflates this move.

Have you been suckered into shorting this rally over the past few weeks?

We have been expecting this rally since the end of December and we do feel it will continue to trade sideways or higher for a couple more months, at which time we will need to reevaluate the state of the market. The Feds move was bullish for stocks and it could be enough to send the market substantially higher, but it also means they know the economy is not as strong as they thought and didn’t feel it would be good to raise rates.

The chart below shows what could happen if stocks can rally and close above last weeks high. It could spark another run-up in stock prices to new highs.


Overall, the stock market is at a critical tipping point much like the December 2000 market top, April of 2008 market top, and the two continuation moves during October 2011 correction and rally, October 2015 correction and rally. What happens over the next couple of months will determine where your long-term investments should be placed.

Visit TheTechnicalTraders.com to see how we’ve been calling these moves. We’re not perfect at making calls – that would be completely unreasonable to think we can predict the future 100% of the time.  But we are confident that our daily videos, proprietary price modeling tools, and detailed global market research will provide you with the advantage you need to create more success – Join Now!

Chris Vermeulen

By TheTechnicalTraders.com

US Equity Market Recovery Hinges On The Next Move

By TheTechnicalTraders.com

The research team, at The Technical Trades Ltd., has been calling this market move quite accurately.  We made predictions on September 17, 2018, that called for a -5~8% downside market rotation, followed by price support just before the November 2018 US elections.  After that, we called for a deep “Ultimate Low” price rotation to setup followed by a strong price rally.  Even though we under-estimated the ultimate low-price rotation which was much deeper, our trend predictions from 120 days earlier are playing out quite accurately.

Currently, we are writing this message to all our followers to inform them that the Feb 1 Jobs report, as well as other critical earnings and economic data, are the “unknown factors” that have stalled this upside market move.  At this time, it is our belief that capital has already started re-entering the US stock market and that a good portion of these investors are waiting for further evidence that a resurgence of price appreciation will continue without any new crisis events unfolding.  Our September 17, 2018 analysis suggested that the US markets would find support after a “revaluation event” and continue an upward price bias.  As this point, we believe we have reached the “momentum launchpad”.

Custom Technology Index on a Weekly Chart

This first chart shows our Custom Technology Index on a Weekly basis. Our opinion is that Technology will likely continue to rotate a bit lower over the next few weeks, setting up a support level near or above December 2018 lows.  This “setup” will likely prompt a new momentum base for Technology and the broader US equities markets to begin a renewed upside price rally.  It makes sense that earning data, forward expectations, geopolitical news and renewed future guidance would prompt a price rotation near these current lows before capital comes rushing back into this sector attempting to ride the next wave higher.

I should note that we have been getting bearish signals on many of the leading tech stocks this week and when the majors sell off it pulls the indexes down as well. Tech stocks lead the bull market but are now underperforming and the smart money is now flowing into new sectors of the market with precious metals being the market leader. Its traders market now meaning you can’t just go buying big brand name stocks and make money, rather you need to be nimble and move to sectors and stocks that have investors money pouring into them.


Smart Capital Index Weekly Chart

Our Smart Capital Index, shown below on a Weekly basis, highlights the recent resurgence in buying in the US markets as well as highlights the current resistance near the RED line on this chart.  This level represents a lower boundary that is acting like a temporary ceiling.  A decent jobs number, continued strong earnings and economic data, as well as moderately strong future guidance, should see this level breached in early February or early March.  In other words, even with reduced forward earnings guidance and income, the US equities markets are still the only game in town for global capital to avoid currency, economic and political risks that seem to be everywhere.

You can see from this Smart Capital Index that we’ve seen a massive revaluation event unfold from January 2018 to January 2019.  Even though the US markets stayed relatively flat throughout this time, comparatively, our global Smart Capital Index showed the global markets were revaluing equity investments with a tremendous -26% price decline.  That’s right, over the past 12 months, the global equities markets have declined by over 26% in a revaluation event that was initiated by global market concerns in China, Asia, Europe, and the Emerging Markets.

Our opinion is that a “reversion event” will likely take place over the next 12+ months where the strongest economies in the planet will recover to near or above the middle/upper levels on the Smart Capital Index chart.  This would represent an 18~30% price recovery on this chart – or a 20~30% price recovery from December 2018 price lows for the US major indexes.


We have to remember that the US markets have become a leader in global markets and a safe-haven for global investors.  Even though our Smart Capital Index has shown a massive price decline of -26%, the Dow Jones only decreased by -18% over that same time-span.  Thus, if we are expecting a +18~30% price recovery on this chart, the Dow Jones may easily recover by 20~30% or more throughout this event.

The next 2~4 weeks will likely play out where Technology rotates lower and sets up a momentum base before starting to move higher.  Our opinion is that the US Major Markets will likely base as well over this time.  We believe a renewed buying interest will begin after February 16th as global investors continue to seek returns and safety for the remainder of 2019.  We strongly believe the continued capital shift into the US markets will take place as soon as this momentum base sets up and price support is clearly evident to traders.  This means we have about 2~4 weeks to plan for and set up strategic trades in preparation for this move to the upside.

Want to learn how we can help you find and execute incredible trading opportunities in 2019?  Want to learn how our incredible proprietary price modeling systems can help you stay ahead of these market moves?  Our researchers continue to call market moves 60, 90, 120+ days in advance.  Visit TheTechnicalTraders.com to learn more about what we do and how we can help you create greater success.

Chris Vermeulen


Forex Technical Analysis & Forecast 30.01.2019 (EURUSD, GBPUSD, USDCHF, USDJPY, AUDUSD, USDRUB, GOLD, BRENT)

Article By RoboForex.com

EURUSD, “Euro vs US Dollar”

EURUSD is still consolidating at the top around 1.1424. Possibly, the pair may form one more ascending structure to expand the range towards 1.1456 (an alternative scenario). According to the main scenario, the instrument may start plummeting to reach 1.1410 at any moment. If later the market breaks this level to the downside, the price may continue trading inside the downtrend with the target at 1.1381.

EURUSD
Risk Warning: the result of previous trading operations do not guarantee the same results in the future

GBPUSD, “Great Britain Pound vs US Dollar”

GBPUSD is forming the third descending structure; it has already reached 1.3083 and completed the first half of this wave. Today, the pair may start a new consolidation range around the above-mentioned level between 1.3117 and 1.3055. According to the main scenario, the instrument is expected to break the range to the downside and resume falling with the short-term target of the third wave at 1.3000.

GBPUSD
Risk Warning: the result of previous trading operations do not guarantee the same results in the future

USDCHF, “US Dollar vs Swiss Franc”

USDCHF has broken 0.9935 upwards; right now, it is growing. Possibly, the pair may expand the range up to 0.9967 and the form a new descending structure to reach 0.9946. Later, the market may rebound from this level and form one more ascending structure towards 0.9990. However, if the instrument breaks 0.9935 to the downside, the price may start a new decline with the target at 0.9890.

USDCHF
Risk Warning: the result of previous trading operations do not guarantee the same results in the future

USDJPY, “US Dollar vs Japanese Yen”

USDJPY is consolidating around 109.33. According to the main scenario, the instrument is expected to fall with the short-term target at 108.90. Later, the market may resume growing to reach 109.33 and then form a new descending structure with the first target at 108.80.

USDJPY
Risk Warning: the result of previous trading operations do not guarantee the same results in the future

AUDUSD, “Australian Dollar vs US Dollar”

AUDUSD is trading to rebound from 0.7155. Possibly, today the pair may break 0.7200 upwards and continue growing with the target at 0.7285. After that, the instrument may resume falling to return to 0.7200 and then form one more ascending structure towards 0.7350.

AUDUSD
Risk Warning: the result of previous trading operations do not guarantee the same results in the future

USDRUB, “US Dollar vs Russian Ruble”

USDRUB is trading to rebound from 66.37. Today, the pair may reach 66.00. Later, the market may form one more ascending structure towards 66.40 and then start a new decline to return to 65.45. After that, the instrument may form a new correction with the target at 66.40.

USDRUB
Risk Warning: the result of previous trading operations do not guarantee the same results in the future

XAUUSD, “Gold vs US Dollar”

Gold is moving upwards; it has broken 1305.95 upwards and may continue growing to reach 1319.76. After that, the instrument may form a new descending structure to return to 1305.95 and then start a new growth with the target at 1331.80.

GOLD
Risk Warning: the result of previous trading operations do not guarantee the same results in the future

BRENT

Brent has reached the short-term downside target and then returned to 61.75; right now, it is consolidating below this level. If later the instrument breaks this range to the upside, the price may form one more ascending structure up to 62.62; if to the downside – resume falling with the target at 59.40 and then start a new growth towards 63.95.

BRENT
Risk Warning: the result of previous trading operations do not guarantee the same results in the future

Article By RoboForex.com

Attention!
Forecasts presented in this section only reflect the author’s private opinion and should not be considered as guidance for trading. RoboForex LP bears no responsibility for trading results based on trading recommendations described in these analytical reviews.

Fibonacci Retracements Analysis 30.01.2019 (GBPUSD, EURJPY)

Article By RoboForex.com

GBPUSD, “Great Britain Pound vs US Dollar”

As we can see in the H4 chart, GBPUSD is forming a short-term descending correction inside the uptrend. After finishing the correction, the pair may form one more ascending impulse to reach the retracement of 50.0% at 1.3384. The support level is close to the retracement of 23.6% at 1.2863.

GBPUSD1
Risk Warning: the result of previous trading operations do not guarantee the same results in the future

In the H1 chart, the pair has been corrected by 38.2%. The next target may be the retracement of 50.0% at 1.3023. If the price breaks the resistance level at 1.3216, the instrument may continue the mid-term uptrend.

GBPUSD2
Risk Warning: the result of previous trading operations do not guarantee the same results in the future

EURJPY, “Euro vs. Japanese Yen”

As we can see in the H4 chart, EURJPY is still trading sideways between the retracements of 38.2% and 50.0%, and may reach the latter level yet in the nearest future. After breaking it, the instrument may continue growing towards the retracement of 61.8% at 127.32. The support level is at 123.76.

EURJPY1
Risk Warning: the result of previous trading operations do not guarantee the same results in the future

In the H1 chart, the pair is forming the Triangle pattern. In the future, the price may break the pattern’s upside border and reach the retracement of 50.0% at 125.55.

EURJPY2
Risk Warning: the result of previous trading operations do not guarantee the same results in the future

Article By RoboForex.com

Attention!
Forecasts presented in this section only reflect the author’s private opinion and should not be considered as guidance for trading. RoboForex LP bears no responsibility for trading results based on trading recommendations described in these analytical reviews.

The Analytical Overview of the Main Currency Pairs on 2019.01.30

Analytics by JustForex

The EUR/USD currency pair

Technical indicators of the currency pair:
  • Prev Open: 1.14253
  • Open: 1.14303
  • % chg. over the last day: +0.03
  • Day’s range: 1.14243 – 1.14497
  • 52 wk range: 1.1214 – 1.2557

EUR/USD keeps consolidating around 1.42000-1.14450. Investors are waiting for the Federal Reserve meeting and the US economic reports. It is expected that the Fed will keep the key interest rate around 2.25-2.50%, but earlier the regulator called for making the monetary policy more aggressive. Keep an eye on the comments and rhetorics by the Central Bank representatives.

The Economic News Feed for 30.01.2019:

  • – Preliminary Labour Market Report by ADP (US) – 15:15 (GMT+2:00);
  • – GDP Report (US) – 15:30 (GMT+2:00);
  • – Real Estate Unfinished Sales Index (US) – 15:30 (GMT+2:00);
  • – Federal Reserve Decision on Key Interest Rate (US) – 21:00 (GMT+2:00);
EUR/USD

There are no precise signals, the price is testing 50 MA.

The MACD histogram is close to 0.

The Stochastic Oscillator is in the neutral zone, the %K line is below the %D line, which gives a signal to sell EUR/USD.

Trading recommendations
  • Support levels: 1.14200, 1.13900, 1.13700
  • Resistance levels: 1.14450, 1.15000

If the price fixes above 1.14450 the quotes will grow toward 1.14800-1.15000.

Alternatively the quotes can correct toward 1.13900-1.13700.

The GBP/USD currency pair

Technical indicators of the currency pair:
  • Prev Open: 1.31520
  • Open: 1.30638
  • % chg. over the last day: -0.63
  • Day’s range: 1.30605 – 1.31213
  • 52 wk range: 1.2438 – 1.4378

GBP/USD started to descend. The pound is under pressure due to the Brexit conundrum. The financial market participants are evaluating the new Brexit bill passed in the UK yesterday. The quotes are recovering around 1.30600-1.31300. You should open positions from these levels and keep an eye on the US News Feed.

The Economic News Feed for 30.01.2019 is calm.

GBP/USD

The indicators do not provide precise signals, the price fixed between 50 MA and 200 MA.

The MACD histogram is in the negative zone but above the signal line which gives a weak signal to sell GBP/USD.

The Stochastic Oscillator is in the neutral zone, the %K line is above the %D line which points to the bullish mood.

Trading recommendations
  • Support levels: 1.30600, 1.30000
  • Resistance levels: 1.31300, 1.32000, 1.32500

If the price fixes below 1.30600, the quotes are expected to fall towards 1.30000.

Alternatively they can grow toward 1.31800-1.32200.

The USD/CAD currency pair

Technical indicators of the currency pair:
  • Prev Open: 1.32592
  • Open: 1.32669
  • % chg. over the last day: +0.06
  • Day’s range: 1.32447 – 1.32812
  • 52 wk range: 1.2248 – 1.3664

The CAD keeps being traded in a flat. There is no single defined trend. The key support is 1.32400 and 1.32650. The key instrument has a tendency to recover. The investors are waiting for the federal reserve meeting. You should open the positions from the key levels.

The Economic News Feed for 30.01.2019 is calm.

USD/CAD

The indicators do not provide precise signals, the price has crossed 50 MA.

The MACD histogram is in the negative zone which indicates a bearish mood.

The Stochastic Oscillator is in the oversold zone, the %K line is crossing the %D line. There are no signals at the moment.

Trading recommendations
  • Support levels: 1.32400, 1.32200, 1.32000.
  • Resistance levels: 1.32650, 1.32850, 1.33150

If the price fixes below 1.32400 expect the quotes to fall further, at least to 1.32000.

Alternatively the quotes can grow toward 1.32800-1.33000.

The USD/JPY currency pair

Technical indicators of the currency pair:
  • Prev Open: 109.317
  • Open: 109.254
  • % chg. over the last day: -0.03
  • Day’s range: 109.211 – 109.441
  • 52 wk range: 104.56 – 114.56

Safe have currency keeps consolidating around 109.150-109.450. The quotes have a tendency to descend. Keep an eye on the economic reports and US Treasury bonds yield. Open positions from the key levels.

During the Asian trading session, Japan published positive retail sales reports.

USD/JPY

The indicators do not provide precise signals, the price has crossed 50 MA and 200 MA.

The MACD histogram is close to 0.

The Stochastic Oscillator is in the neutral zone, the %K line is above the %D line, which gives a signal to buy USD/JPY.

Trading recommendations
  • Support levels: 109.150, 108.900, 108.700
  • Resistance levels: 109.400, 109.600, 109.850

If the price fixes below the local support of 109.150 expect the qutoes to fall toward 108.900-108.700.

Alternatively, they can correct toward 109.700-109.850.

Analytics by JustForex

Investors Assess the Results of the Brexit Vote. We Expect the Fed Meeting

by JustForex

The US dollar slightly strengthened against a basket of major currencies during yesterday’s trading session. The US dollar index (#DX) closed in the positive zone (+0.10%). Financial market participants expect the Fed interest rate decision, as well as signals on the further development of trade relations between the US and China. It is expected that the regulator will keep the key marks of monetary policy at the same level. It should be recalled that earlier the Central Bank signaled a slowdown in raising interest rates in the current year. We recommend paying attention to the comments by the Fed representatives.

Last night the UK Parliament voted on the Brexit deal. Several amendments were proposed. We would like to mention some of them. So, the House of Commons voted against the amendment to postpone Brexit for up to 9 months if EU and Great Britain don’t close a deal. Also, members of the House of Commons voted for the amendment to prevent Brexit without an agreement with the EU. Thus, a British Labour Party politician, Yvette Cooper, proposes to adopt a bill, according to which British Prime Minister, Theresa May, will be obliged to delay Brexit if members of the British parliament do not close a deal with the EU until February 26.

Also yesterday, the US consumer confidence index was published, which counted to 120.2 in January and turned out to be worse than the forecasted value of 124.7. The figure for December was also revised downward from 128.1 to 126.6. This index allows assessing the sentiment of the US consumers relative to current economic conditions. Today, during the Asian trading session, optimistic data on inflation have been published in Australia, which supported Ozzie.

The bullish sentiment is prevailing in the “black gold” market. At the moment, futures for the WTI crude oil are testing the mark of $53.40 per barrel. At 17:30 (GMT+2:00), a report on crude oil inventories will be published in the US.

Market Indicators

Yesterday, there was a variety of trends in the US stock market: #SPY (-0.13%), #DIA (+0.25%), #QQQ (-0.94%).

The 10-year US government bonds yield has continued to decline. Currently, the indicator is at the level of 2.71-2.72%.

Economic Data from the US on 30.01.2019:

– ADP nonfarm employment change at 15:15 (GMT+2:00);
– GDP data at 15:30 (GMT+2:00);
– Pending home sales at 17:00 (GMT+2:00);
– Fed interest rate decision at 21:00 (GMT+2:00).

by JustForex

The Yen is getting a little bit stronger. Overview for 29.01.2019

Article By RoboForex.com

On Tuesday morning, USDJPY is trading downwards; demand for the USD is reducing.

The Japanese Yen is strengthening against the USD on Tuesday. The current quote for the instrument is 109.28.

Yesterday, the Bank of Japan released its Monetary Policy Meeting Minutes, which didn’t contain anything principally new. The regulator’s major goal is the stable inflation. So far, it was impossible due to different reasons: low consumer spending and controversial outlooks for positive dynamics in the future didn’t help to make the country’s inflation stable.

This week, there will be the first meeting of the US Federal Reserve in 2019, but no one is expecting any rate changes. Right now, investors are discussing another issue: they believe that the regulator is selling its assets much slower than it was expected to earlier. This move is thought to be some kind of climbdown on the part of the regulator to the White House. Market players do want to know more details, because they expected the Fed to be more aggressive in selling its assets and absorbing the USD liquidity. This issue keep investors on their toes.

The Yen is still acting as a “safe haven” asset, even despite the Government Shutdown in the USA is put on hold.

Article By RoboForex.com

Attention!
Forecasts presented in this section only reflect the author’s private opinion and should not be considered as guidance for trading. RoboForex LP bears no responsibility for trading results based on trading recommendations described in these analytical reviews.

45 Days Until A Multi Year Breakout In Precious Metals

By TheTechnicalTraders.com

Today is the day we want to warn our followers that we expect the precious metals to continue to base with a fairly narrow price range for about 45 to 65 more days before upside pricing pressures start to take hold of the markets.  There has been quite a bit of chatter about Gold breaking above $1300 recently.  Many people have been expecting it to move much higher fairly quickly.  We don’t believe that will be the case – but expect it have another significant rally in April, May or June.

Monthly Gold Forecast Chart – Posted October 2018

Back in early October 2018, we shared this chart with all of our followers suggesting that Gold and precious metals would rally to above $1300 near December/January using our Adaptive Dynamic Learning predictive modeling system.  We’ve been suggesting to our followers for many months that Gold, Silver, and miners would begin a new upside price swing, yet we knew the big breakout moves were still many months away.

Pay very close attention to the DASH lines on the chart and the GREEN and RED arrows we drew to help our followers understand what we expected to see happen in the future.


Todays Updated Monthly Gold Chart

Now, take a look at the current Gold chart below with the same ADL levels displayed on it.  Notice how price moved towards the DASHED lines almost perfectly in alignment with our predictive modeling results?  Yes, the move in December was a bigger upside swing compared to the previous few months, but that is what happens when a “price anomaly” sets up with the ADL system.  When the price falls “out of alignment” with the ADL predictions, we call this a “price anomaly”.  This is when the price may quickly rally or sell-off, depending on the direction of the anomaly, to attempt to catch up to the mathematically predicted price levels.

Currently, we expect the price of Gold to stay between $1250 and $1320 for the next few months while it consolidates towards the $1260~1275 range near early April or early May 2019.  And that will be all she wrote, folks.  Because once price settles near this level near the April/May timeline, this should be the basing formation that will launch massive new momentum to the upside.  Our opinion is that it would be best NOT to wait till the last minute to prepare for this move.  Even though we expect this move to start near April/May of 2019, it could start to melt-up earlier than we expect – this is why we are warning you today that we have about 45 days left to plan and prepare for this trade. Subscribers entered a long GDXJ position down near the lows at $27.52 a while back slowly preparing for this major market bottom.


Daily SP500 Index Chart

If our analysis is correct, the US markets will settle into a melt-up format where global capital continues to pour into the US stock market in an attempt to avoid risks associated with global market slowdowns and events.  This “capital shift” will continue to play out for the first 2 quarter of 2019 without much interruption.  Our ADL predictive modeling system is suggesting that by May/June of 2019, precious metals should start to rally above $1400 and that means something is going to cause fear in the markets.  It could be the US Presidential election cycle spinning up or it could be something external – we don’t know yet.  We do know that the Brexit date, March 29, 2019, is likely to spark some renewed fears in the global markets and we are eagerly watching the news cycles to see what is next.

The current support levels in the ES is between 2525 and 2645.  We recently posted a public article sharing our research regarding our opinion that rotation near 2670 was likely and that the GREEN support zone should act as a floor for current price rotation.  Our Fibonacci price modeling system is suggesting there is a vast array of support in this zone where the price should base, build power and begin a continued upside “melt-up” over the next 60~90+ days.


Why is it important to understand that this stock market may continue to rally as Gold and precious metals begin a breakout upside move?  It is important to understand how fear rotates through the markets as a result of “origin”.  The origin of the event or crisis that is generating this fear in the markets tends to shift perception as to the extent this fear/event will reach other economies.  With the 2008-09 credit market crisis, the origin was the US and global financial institutions – the biggest institutions on the planet.  We believe the new crisis event may be “regional” to Asia/China and Europe.  Thus, the origins and reach of these events may be more isolated than last time.

Also, we know that the once leaders of a market (tech) become the dogs, and the unwanted assets become market leaders. Commodity/resource stocks (precious metals) tend to outperform the USA stock market in the final few months before the bull market ends and that could be what is happening right now. Tech stocks are lagging while the precious metals sector is one of the strongest.

We believe 2019 is going to be the year where skilled traders can make a fortune if you know what you are doing and can see these moves in advance.  Our team of traders and researchers at TheTechnicalTraders.com are dedicated to helping you find and execute better trades.  Visit our web site and see how we can help you build for a greater future.  I will drop one little hint before the news hits the wires, we are building a new client services portal that will blow your minds in terms of ease of live intraday analysis, trading opportunities from day trading, to swing trades, and even our own long term investment signals).  This new client portal will allow you to more actively engage with our team and fellow traders of our service.  Get started now as we are only a few weeks away from launching these new member tools.

Chris Vermeulen