Author Archive for InvestMacro – Page 291

The Trade Week Ahead – Around The World

By FPMarkets.com

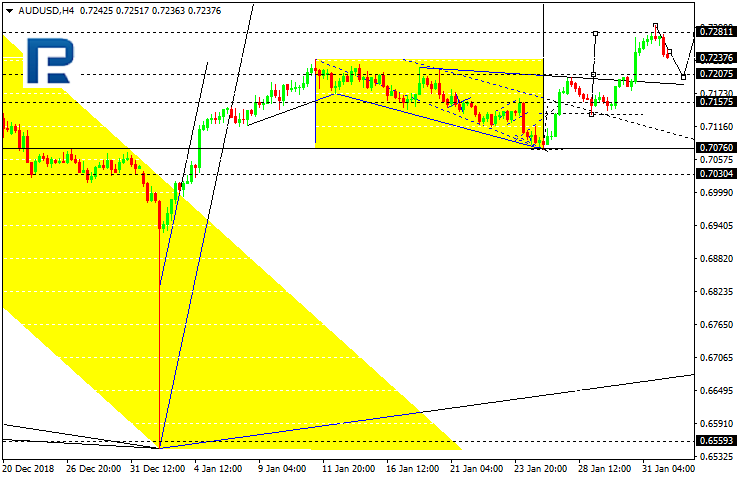
AUD: Price action in the AUD and domestic economics are clearly not aligned. Domestic activity over the past two weeks has, in the main, been weak, especially the NAB business confidence numbers. The fact ‘conditions’ have plummeted to a 7-year low and across the subsectors shows this isn’t just a ‘retail’ or ‘mining’ et. al. issue this is an economic wide sentiment view. The collapse in employment, profitability and trading conditions are a concern. Couple this with the accelerating declines in housing and it explains why there is general nervousness domestically. Thus, looking to the week ahead, Tuesday’s RBA meeting, the first for 2019 is forecasted to see it dropping its hiking bias to be a neutral as possible. This should be AUD negative clearly.

However, price action should remind us all that Australian domestic economics is only a very small part of the leavers that drive the AUD. There are clearly three other leavers currently:

  1. Iron ore being well above forecast and then spiking higher on the Brazilian disaster, clear terms of trade benefit.
  2. The US-China trade war is moving into a more ‘constructive’ phase. The AUD is highly correlated with the China/Emerging Markets trade.
  3. There are two-sides to a trading pair and the ‘patient’ Fed coupled with easing financial conditions are benefits for AUDUSD.

Don’t be surprised if the AUD natural drifts up to 73cents on USD weakness and other global positives.

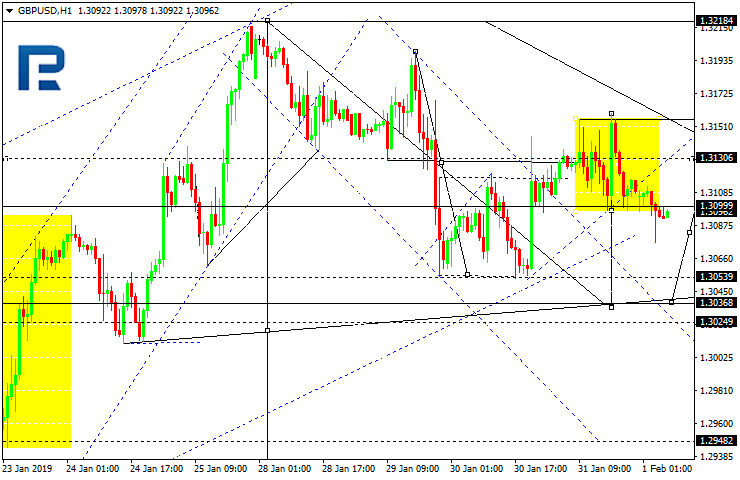
GBP: Short term risks are becoming way to high – moving out positions and sitting on the sidelines. Brexit negotiations are moving into a new phase, I still see a deal of sorts being done the question is ‘when’. The March 29 deadline is becoming tight and it’s likely that Article 50 will have to be extended, this means the EU is now a key player and with it playing hard ball and Parliament playing politics it is causing GBP gyrations. Its adding to much trade risk to the coming few weeks – still have a net view of a higher GBP over the coming half year but am out of GBP crosses for now.

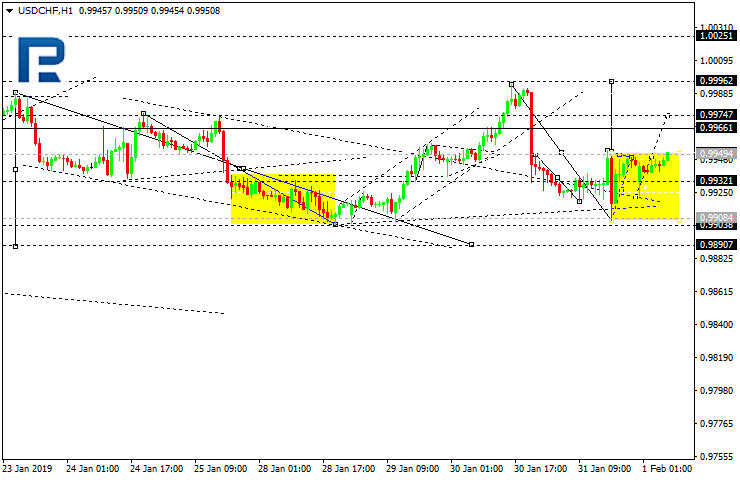
USD: The shift in the Fed shows two key things:

  1. It can be influenced by the markets – the spreads in the corporate debt markets and the changes in financial conditions have brought this on.
  2. The Federal Funds Rate is probably at the neutral cash rate.

The market pricing of the Federal Funds rate now has the possibility of a 25bps rate rise by December at 15% – the conclusion is the Fed is out of the market.

This creates an interesting scenario in the USD. I have expected USD moderation in 2019 and still expect this with the Fed pivoting to a neutral stance. However, with US growth holding up reasonably well it provides some attraction and could see flows shifting away from currencies with domestic or theme weakness back to US investment and thus moderation could shift slightly to a higher USD over the next few weeks.

By Evan Lucas, FPMarkets.com


Get Ready For The Next Big Upside Leg In Metals and Miners

By TheTechnicalTraders.com

We recently closed our GDXJ trade for a 10.5% total profit with our members.  We are preparing for a lower price rotation over the next 45+ days that will allow us to plan for new long.  Our research indicates the metals/miners should enter a downside price rotation over the next 45+ days as the US stock markets continue to rally.  Give this expectation, it is important to understand how we are timing this move for our members and attempting to take advantage of strategic trade deployment.

With Gold recently breaking above $1300, many analysts have been calling for a continued breakout move to the upside as well as a massive market correction in the US stock market.  We’ve been calling for just the opposite to happen – a pause in the metals/miners near this $1300~1320 level.

If our analysis is correct, a renewed capital shift will continue to unfold over the next 30~45 days where foreign capital will move into the US stock market (including technology, financial, medical/biotech, blue chips, mid-caps, and others) as global investors chase the safety and returns of the US Dollar and the US stock market.  This process of deploying capital into the US stock market will relieve upside pressure in the metals/miners for a brief period of time – resulting in a price pullback.  Our expectations are that the GDXJ price will rotate back below $31 and likely target a support level near $30.50~30.65.  This is near where we intend to look for new Long entry trades.


ADLC – Advanced Dynamic Price Cycle Projection


ADLC – Advanced Dynamic Learning Prediction Projection


Weekly Longer Term View of Projection


The opportunity of the next leg higher in the metals/miners is exciting.  Take a look at this Weekly GDXJ chart showing the upside price targets near $42 and $45.  These represent a 37% to 47% upside price objective once this rotation completes as we expect.

In short, if you want to gain access to our proprietary price modeling systems, a dedicated research team, daily video analysis, and help you find and execute better trades, then please visit TheTechnicalTraders.com.  If you want to know how and when we are trading these markets to help our members, then consider becoming a member and enjoying all the benefits we offer our subscribers.  This is going to be an incredible year for skilled traders who can move around and trade the hot pockets of stocks and commodities.

Chris Vermeulen


Forex Technical Analysis & Forecast 01.02.2019 (EURUSD, GBPUSD, USDCHF, USDJPY, AUDUSD, USDRUB, GOLD, BRENT)

Article By RoboForex.com

EURUSD, “Euro vs US Dollar”

EURUSD has completed the consolidation range at the top, broken it downwards, and may start a new correction to reach 1.1431; right now, it is consolidating near the lows of the third descending wave. If later the instrument breaks this range to the upside, the price may return to 1.1472; if to the downside – reach 1.1431 first and then return to 1.1472.

EURUSD
Risk Warning: the result of previous trading operations do not guarantee the same results in the future

GBPUSD, “Great Britain Pound vs US Dollar”

GBPUSD has broken 1.3099; right now, it is consolidating around this level. Today, the pair may form a new descending structure to reach 1.3037 and resume growing with the target at 1.3130.

GBPUSD
Risk Warning: the result of previous trading operations do not guarantee the same results in the future

USDCHF, “US Dollar vs Swiss Franc”

USDCHF is trading to break 0.9949. Possibly, today the pair may form one more ascending structure to reach 0.9974 and then start a new decline to return to 0.9949.

USDCHF
Risk Warning: the result of previous trading operations do not guarantee the same results in the future

USDJPY, “US Dollar vs Japanese Yen”

USDJPY has finished the ascending impulse along with the correction. Today, the pair may resume growing to break 109.00 and then continue trading inside the uptrend with the short-term target at 109.28. Later, the market may form a new descending structure to return to 109.00.

USDJPY
Risk Warning: the result of previous trading operations do not guarantee the same results in the future

AUDUSD, “Australian Dollar vs US Dollar”

AUDUSD is trading downwards to reach 0.7207. After that, the instrument may form one more ascending structure towards 0.7350.

AUDUSD
Risk Warning: the result of previous trading operations do not guarantee the same results in the future

USDRUB, “US Dollar vs Russian Ruble”

USDRUB has reached its downside target. Today, the pair may grow to break 65.73 and then continue trading upwards to 66.37. Later, the market may start a new decline with the target at 64.80.

USDRUB
Risk Warning: the result of previous trading operations do not guarantee the same results in the future

XAUUSD, “Gold vs US Dollar”

Gold is trading downwards. Possibly, the pair may reach 1310.55 and then start a new growth towards 1334.40.

GOLD
Risk Warning: the result of previous trading operations do not guarantee the same results in the future

BRENT

Brent has broken 61.47. Possibly, today the pair may be corrected towards 60.37 and then form one more ascending structure to return to 61.47. After that, the instrument may resume falling with the target at 61.00.

BRENT
Risk Warning: the result of previous trading operations do not guarantee the same results in the future

Article By RoboForex.com

Attention!
Forecasts presented in this section only reflect the author’s private opinion and should not be considered as guidance for trading. RoboForex LP bears no responsibility for trading results based on trading recommendations described in these analytical reviews.

Fibonacci Retracements Analysis 01.02.2019 (BITCOIN, ETHEREUM)

Article By RoboForex.com

BTCUSD, “Bitcoin vs US Dollar”

As we can see in the H4 chart, the correctional downtrend has reached the retracement of 76.0% and may continue falling towards the low at 3121.90. However, there is a convergence on MACD, which may indicate a possible pullback towards the resistance level at 3678.00.

BTCUSD1
Risk Warning: the result of previous trading operations do not guarantee the same results in the future

In the H1 chart, after finishing the short-term correctional uptrend, the pair is forming a new descending impulse. If the price breaks the low at 3342.70, the instrument may fall towards the post-correctional extension area between the retracements of 138.2% and 161.8% at 3294.00 and 3262.00 respectively. The local resistance is the high at 3472.50.

BTCUSD2
Risk Warning: the result of previous trading operations do not guarantee the same results in the future

ETHUSD, “Ethereum vs. US Dollar”

As we can see in the H4 chart, the downtrend has slowed down; the pair is trading between the retracements of 61.8% and 76.0% at 111.25 and 100.00 respectively. The key downside target is the low at 80.86. At the same time, there is a convergence on MACD, which may indicate a possible pullback in the short-term.

ETHUSD1
Risk Warning: the result of previous trading operations do not guarantee the same results in the future

In the H1 chart, the pair is forming a new descending impulse with the closest target at 101.00. If the price breaks this level, the instrument may continue falling towards the post-correctional extension area between the retracements of 138.2% and 161.8% at 97.55 and 95.38 respectively.

ETHUSD2
Risk Warning: the result of previous trading operations do not guarantee the same results in the future

Article By RoboForex.com

Attention!
Forecasts presented in this section only reflect the author’s private opinion and should not be considered as guidance for trading. RoboForex LP bears no responsibility for trading results based on trading recommendations described in these analytical reviews.

The Analytical Overview of the Main Currency Pairs on 2019.02.01

Analytics by JustForex

The EUR/USD currency pair

Technical indicators of the currency pair:
  • Prev Open: 1.14782
  • Open: 1.14461
  • % chg. over the last day: -0.29
  • Day’s range: 1.14344 – 1.14510
  • 52 wk range: 1.1214 – 1.2557

USD partically recovered from the Wednesday`s collapse but remains under pressure. Yesterday Federal Reserve decided not to increase the interest rates this year. The quotes are consolidating in the narrow range 1.14350-1.14500. The investors are waiting for the January labour market report in the US and expect worsened indicators. Keep an eye on the difference between the factual and the forecasted values of the indicators. You should open positions from the key levels.

The Economic News Feed for 01.02.2019:

  • – Industrial PMI Report (GER) – 10:55 (GMT+2:00);
  • – Preliminary Inflation Report (EU) – 12:00 (GMT+2:00);
  • – Labour Market Report (US) – 15:30 (GMT+2:00);
  • – ISM`s Industrial PMI Report (US) – 17:00 (GMT+2:00).
EUR/USD

The indicators don’t provide precise signals, the price fixed between 50 MA and 200 MA.

The MACD histogram is in the negative zone but above the signal line which gives a weak signal to sell EUR/USD.

The Stochastic Oscillator is in the neutral zone, the %K line is above the %D line which points to the growth of the EUR/USD quotes.

Trading recommendations
  • Support levels: 1.14350, 1.14100, 1.13900
  • Resistance levels: 1.14500, 1.14750, 1.15100

If the price fixes below 1.14350 expect the quotes to fall further toward 1.14000-1.13600.

Alternatively, expect them to rise toward 1.15000.

The GBP/USD currency pair

Technical indicators of the currency pair:
  • Prev Open: 1.31067
  • Open: 1.31010
  • % chg. over the last day: -0.05
  • Day’s range: 1.30770 – 1.31148
  • 52 wk range: 1.2438 – 1.4378

The pound remains in the long flat, the technical picture is ambiguous. The local support and resistance levels are 1.30900 and 1.31350. The Brexit conundrum is still in the spotlight. The financial market participants are going to review the US labour market report today, which is bound to affect GBP/USD. You should open positions from the key levels.

At 11:30 (GMT+2) the Great Britain will publish the PMI indexes.

  • – Economic Event (GB) – 00:00 (GMT+2:00);
  • – Economic Event (GB) – 00:00 (GMT+2:00);
  • – Economic Event (GB) – 00:00 (GMT+2:00);
GBP/USD

The indicators do not provide precise signals, the price has crossed 50 MA and 200 MA.

The MACD histogram is close to 0.

The Stochastic Oscillator is near the overbought zone, the %K line is crossing the %D line. There are no signals at the moment.

Trading recommendations
  • Support levels: 1.30900, 1.30550, 1.30000
  • Resistance levels: 1.31350, 1.31800, 1.32150

If the price fixes below 1.30900 consider selling GBP/USD. The movement will tend toward 1.30300-1.30000.

Alternatively the quotes can recover toward 1.31750-1.32000.

The USD/CAD currency pair

Technical indicators of the currency pair:
  • Prev Open: 1.31473
  • Open: 1.31213
  • % chg. over the last day: -0.19
  • Day’s range: 1.31204 – 1.31573
  • 52 wk range: 1.2248 – 1.3664

Right now the CAD is consolidating after a long fall. The USD/CAD quotes are testing the 1.31200-1.31550 key range and can descend further. The US Labour Market report is in the spotlight. Keep an eye on the oil quotes dynamics and open positions from the key levels.

The Economic News Feed for 01.02.2019 is calm.

USD/CAD

The indicators do not provide precise signals, the price is close the 50 MA which acts as a strong dynamic resistance.

The MACD histogram is close to 0.

The Stochastic Oscillator is in the neutral zone, the %K line is below the %D line which points to the further descend of the USD/CAD quotes.

Trading recommendations
  • Support levels: 1.31200, 1.30750
  • Resistance levels: 1.31550, 1.31900, 1.32100

If the price fixes below 1.31200, expect the quotes to fall further toward 1.30700-1.30500.

Alternatively. the quotes can correct toward 1.13800-1.32000.

The USD/JPY currency pair

Technical indicators of the currency pair:
  • Prev Open: 109.035
  • Open: 108.859
  • % chg. over the last day: -0.17
  • Day’s range: 108.725 – 108.969
  • 52 wk range: 104.56 – 114.56

USD/JPY is stabilizing after a long fall. Right now the yen is consolidating. The quotes are testing the local support and resistance levels of 108.750 and 109.000. We expect reports from the US. Open positions from the key levels.

The Economic News Feed for 01.02.2019 is calm.

USD/JPY

The indicators do not provide signals, the price is testing 50 MA.

The MACD histogram is close to 0.

The Stochastic Oscillator is in the neutral zone, the %K line is crossing the %D line. There are no signals at the moment.

Trading recommendations
  • Support levels: 108.750, 108.500
  • Resistance levels: 109.000, 109.150, 109.400

If the price fixes below 108.750 expect the quotes to fall further toward 108.400-108.200.

Alternatively, the quotes can grow toward 109.300-109.500.

Analytics by JustForex

The US Currency Recovered Some Losses. Labor Statistics from the US Is in the Focus of Attention

by JustForex

The US dollar is recovering against a basket of major currencies after a decline the day before. Investors are closely monitoring the trade relations between the US and China. Yesterday, the US President, Donald Trump, announced that he planned to meet with Chinese President, Xi Jinping, to reach a final agreement. Donald Trump expects an agreement to be reached by March. The US dollar index (#DX) closed in the positive zone (+0.29%). Today, investors’ attention is focused on a report on the US labor market for January. Economists expect that key indicators may worsen. We recommend paying attention to the difference between the actual and forecasted values.

Yesterday, economic data were published in Germany, the Eurozone, Canada and the US. Thus, the unemployment rate in Germany decreased by 2K in January, while investors expected a decrease of 11K. Eurozone GDP counted to 1.2% (y/y) in December, as the experts expected. Canada GDP fell by 0.1% in November, which matched the investors’ forecasts. New home sales in the US counted to 657K in November instead of 560K. Today, during the Asian trading session, Chinese Caixin manufacturing PMI has been published, which has counted to 48.3 and has been worse than the expected value of 49.5.

The “black gold” prices are consolidating. At the moment, futures for the WTI crude oil are testing the mark of $53.75 per barrel.

Market Indicators

Yesterday, there was a variety of trends in the US stock market: #SPY (+0.88%), #DIA (-0.02%), #QQQ (+1.50%).

The 10-year US government bonds yield fell again. At the moment, the indicator is at the level of 2.62-2.63%.

Economic Data on 01.02.2019:

– German manufacturing PMI at 10:55 (GMT+2:00);
– Preliminary data on inflation in the Eurozone at 12:00 (GMT+2:00);
– Data on the US labor market at 15:30 (GMT+2:00);
– ISM manufacturing PMI in the US at 17:00 (GMT+2:00).

by JustForex

EURUSD: bulls dealt a blow by Weidmann

By Matthew Anthony, Alpari

Previous:

On Thursday the 31st of January, the euro pared nearly all the gains it made it the aftermath of the FOMC meeting. The pair suffered a sharp drop on the back of comments made by Bundesbank President Jens Weidmann. He said that the German economic growth rate will be significantly slower than the 1.5% predicted leading into 2019. The euro dropped to 1.1436 in response to these remarks.

Day’s news (GMT+3):

  • 11:30 Switzerland: real retail sales (Dec), SVME – PMI (Dec).
  • 11:50 France: Markit manufacturing PMI (Jan).
  • 11:55 Germany: Markit manufacturing PMI (Jan).
  • 12:00 Eurozone: Markit manufacturing PMI (Jan).
  • 12:30 UK: Markit manufacturing PMI (Jan).
  • 13:00 Eurozone: CPI (Jan).
  • 16:30 US: nonfarm payrolls (Jan), unemployment rate (Jan), average hourly earnings (Jan), average weekly hours (Jan).
  • 17:45 US: Markit manufacturing PMI (Jan).
  • 18:00 US: ISM manufacturing PMI (Jan), Michigan consumer sentiment index (Jan).
  • 21:00 US: Baker Hughes US oil rig count.

Fig 1. EURUSD hourly chart.

Current situation:

My expectations yesterday that the euro would drop were met in full. The only thing that I didn’t imagine is that the euro would drop any lower than 1.1470 ahead of the payrolls report.

In Asia, the rate dropped below the trend line drawn from 1.1290, testing the 67th degree. I reckon that the rate is going to stop around this level, and will stay there until the payrolls report is released.

US employment data is the centre of attention today. The payrolls report has a strong, albeit short-lived effect on the Forex market. Traders will also have their eyes on the talks taking place between the US and China.

Liu He, vice premier of the State Council of the People’s Republic of China, has announced that China is set to sign a trade deal with the United States. US President Donald Trump has also said that the US is hoping to reach a final deal with China by the 1st of March.

Without taking the NFP report into account, cycles indicate that the pair will rise until the end of the day, and will then revisit Friday’s low on Monday. We’ll see whether or not the NFP fits in with the cycles. The LB balance line is providing resistance at 1.1457. If the NFP report is weak, we can expect a jump to 1.1490. If it’s strong, expect a drop to 1.1400. These levels are only rough estimates, because speculators take a lot of the report’s aspects into account. Moreover, this payrolls report is coming out soon after an FOMC meeting, so the reaction to it could be muted and remain within a 50-pip range.

The Yen is attacking. Overview for 31.01.2019

Article By RoboForex.com

USDJPY is “sliding” downwards; the USD is getting cheaper due to the US regulator’s rhetoric.

The Japanese Yen is rising against the USD on Thursday more and more actively. The current quote for the instrument is 108.72.

The instrument started falling after the US Federal Reserve reaffirmed its position to be patient about further policy firming. The currency market players decided that it was a sign of long pauses between rate hikes, thus making the American currency go down.

Due to this, today’s statistics from Japan were put on the back burner, although the numbers were worth paying attention to. According to the preliminary report, the Industrial Production seems to have improved: in December, the indicator lost only 0.1% m/m after plummeting by 1.0% m/m in November. The expected reading was -0.5% m/m. in fact, the number is good, even considering it is a preliminary one.

If the Industrial Production is ready to recover, then there is a flash of optimism in the domestic demand as well. Later, one should pay attention to the Retail Sales report. If these positive numbers are confirmed, it can be said that negative economic trends are over at least for now.

The Japanese Real Estate market also revived in January and that’s a good sign. The Housing Starts expanded by 2.1% y/y this month after losing 0.6% y/y in December. The indicator was really expected to recover, but not as much as it did.

Article By RoboForex.com

Attention!
Forecasts presented in this section only reflect the author’s private opinion and should not be considered as guidance for trading. RoboForex LP bears no responsibility for trading results based on trading recommendations described in these analytical reviews.

Play our New Financial Market Forecasting Game

By Zac @countingpips

So I am really into the financial markets, constantly reading, analyzing and studying the markets. It is fun but trading and investing can also be a very solitary activity. But it doesn’t have to be! With this idea, I wanted to invite you to join in our new Financial Market Forecasting Game. Once a month, submit your predictions on what the monthly closing price will be for some of the major financial markets like the USD Index, EURUSD, SP500, Bitcoin & the US 10-Year Bond Yield.

Join up with other traders, investors and market enthusiasts in what we hope will be a fun addition for all the visitors to our site. There will be leaderboards that will show the highest scoring players in the game and will be updated monthly.

At the end of the day, we also hope that this game will help improve all of our trading and investing skills going forward.

Join our Forecasting Game Here.

Murrey Math Lines 31.01.2019 (USDCHF, GOLD)

Article By RoboForex.com

USDCHF, “US Dollar vs Swiss Franc”

In the H4 chart, USDCHF is expected to rebound from the 5/8 level and resume growing towards the resistance at the 7/8 one.

USDCHF1
Risk Warning: the result of previous trading operations do not guarantee the same results in the future

In the H1 chart, the pair may test the 0/8 level, rebound from it, and, as a result, resume trading upwards to reach the resistance at the 5/8 one.

USDCHF2
Risk Warning: the result of previous trading operations do not guarantee the same results in the future

XAUUSD, “Gold vs US Dollar”

In the H4 chart, XAUUSD may break the 4/8 level and then continue trading downwards to reach the support at the 3/8 one.

GOLD1
Risk Warning: the result of previous trading operations do not guarantee the same results in the future

As we can see in the H1 chart, the pair is trading inside the “overbought zone”. In this case, the price is expected to break the 8/8 level and, as a result, continue falling towards the support at the 5/8 one.

GOLD2
Risk Warning: the result of previous trading operations do not guarantee the same results in the future

In the M15 chart, the pair may break the downside line of the VoltyChannel indicator and, as a result, continue moving downwards.

GOLD3
Risk Warning: the result of previous trading operations do not guarantee the same results in the future

Article By RoboForex.com

Attention!
Forecasts presented in this section only reflect the author’s private opinion and should not be considered as guidance for trading. RoboForex LP bears no responsibility for trading results based on trading recommendations described in these analytical reviews.