Author Archive for InvestMacro – Page 286

WTI oil – only one support left

By Tomasz Wisniewski, Alpari

Time to update our traders about the situation on WTI oil, where in our opinion, the correction that started in December is coming to an end. Buyers had a good run but it looks like it is time for them to exit the market and look for proper trading occasions elsewhere.

The bullish correction started in the second half of December and the price managed to climb almost 14 USD higher. That is definitely a nice score and buyers can be happy with themselves. Time to close the door and say goodbye I guess. What we see on the chart is a Head and Shoulders pattern (yellow) where we can see the top of the bullish correction. This formation has now been completed (giving out a sell signal) as on Thursday, we broke the neckline of this pattern (blue). On Friday, the price tested the broken support as a closest resistance, which gave clear confirmation of bearish strength.

WTI H1

You may be right in remaining unconvinced as of yet. If we want to talk about a clear bearish situation, we’ve got one more support to break. That support is the purple line connecting recent important higher lows. Closing the day below that line would provide a proper sell signal with a potential target at December’s lows. So basically, we are talking about another decline here and a trade with a marvelous risk to reward ratio.

Trump’s Quest to Undermine Multilateral Development Banks

By Dan Steinbock

In the postwar era, the multilateral development banks were created to facilitate global trade. Today, they are ‘America First’ targets.

Recently, the White House has been pushing its America First stance in the World Trade Organization (WTO) by controversial appeals to a “national security exception.” In response to the Trump tariffs, several WTO members have brought dispute settlement cases against the U.S.

World Bank is next in the firing line. Reportedly, the White House will announce David Malpass as the nominee for President of the World Bank, after Jim Yong Kim’s resignation well before the end of his five-year term in 2022.

In the 2016 election, Malpass served as Trump’s economic advisor. A year later he was appointed Undersecretary for International Affairs in the U.S. Department of the Treasury. But he is an odd choice to head the World Bank – a bit like selecting a coal CEO to head the struggle against climate change.

An ‘America First’ World Bank

Like U.S. Representative of Trade Robert Lighthizer,  Malpass began his political career in the 1980s Reagan administration seeking to contain the rise of Japan through the Section 301 of the 1974 Trade Act; the same unilateral legislation Trump is exploiting against China in the current trade dispute.

During his 15 years as chief economist at Bear Stearns, Malpass was not known for his economic foresight. A year before the global crisis, he wrote that “housing- and debt-market corrections will probably add to the length of the U.S. economic expansion.” And amidst lingering crisis, he urged for higher interest rates.

During his tenure as Under Secretary of the Treasury for International Affairs, Malpass has taken an aggressive position against China. In early 2018, he slammed China’s “non-market behavior” advocating stronger responses. When Trump tariff wars began, some 20 career staff quit Malpass’s unit in less than a year opposing the administration’s unilateral trade policies and Malpass’s poor leadership style.

To Malpass, the World Bank is a “giant sprawl” of international organizations that create “mountains of debt without solving problems.” He promotes a new “debt-transparency initiative” that would shed more light on the international liabilities of the world’s governments. Such an initiative would not target America’s $22 trillion pile of sovereign debt, but China’s Belt and Road Initiative (BRI). Should he walk the talk, that could cause a fatal rift in World Bank.

As of November 2018, the largest recipients of World Bank loans were India ($859 million in 2018) and China ($370 million in 2018). Malpass could subject China and its loans into a politicized scrutiny, effectively extending U.S. investment reviews through the Bank. In that view, his nomination has done nothing to diminish China’s concerns that the existing international institutions will not accommodate it.

Toward ‘America First’ IMF

Since the Bretton Woods, the president of the World Bank has been an American, while the International Monetary Fund (IMF) has been led by a European. Both institutions are located in Washington, D.C. and work closely with each other, as international extensions of the U.S. Department of the Treasury – as critics contend.

Amid the 2008 crisis fall, IMF chief Dominique Strauss-Kahn managed to achieve G20 cooperation that contained the global free-fall. In exchange, advanced economies pledged commitment to global governance reforms in multilateral development banks. Yet, those reforms were ignored after Strauss-Kahn was replaced with French Finance Minister Christine Lagarde. As global managing partner of U.S.-headquartered Baker & McKenzie, Lagarde lived full-time in Chicago until 2005. Through the nomination process, she was subject of a legal investigation over alleged abuse of power in the “Tapie Affair.” In 2016, a French court found her guilty of negligence, but did not impose a penalty. That’s how Lagarde was re-appointed for another five-year term at IMF.

IMF’s economic stance is shifting toward Washington as well. Recently, Lagarde appointed Gina Gopinath as the IMF Chief Economist to succeed Maurice Obstfeld. Gopinath is a veteran U.S. economist and co-director at National Bureau of Economic Research. In her most recent work, she has been an outspoken advocate of the U.S. dollar whose dominance she expects to continue largely undisturbed. She has cooperated with former IMF Economic Counselor Kenneth Rogoff, who has for years criticized China’s debt – as opposed to U.S. debt – as a global risk.

Since 2011, BRICS economies (Brazil, Russia, India, China, and South Africa) have stressed that the selection of the IMF chief on the basis of nationality undermines its international legitimacy. In a 2015 interview, even Jim Yong Kim predicted that “you will never again see an IMF or a World Bank election without very strong contention, coming especially from the developing world.”

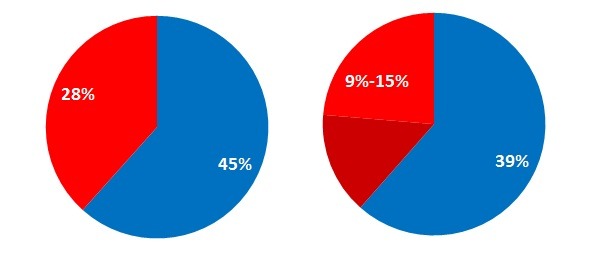
Despite the 2010 cosmetic reforms, advanced economies continue to dominate World Bank voting shares over emerging economies. Today, the seven major advanced economies account for 45% and the largest seven emerging economies almost 30% of the world economy. Nevertheless, advanced countries still control nearly 40% of World Bank voting shares, as opposed to only 9 to 15% by emerging economies (Figure).

Figure   Advanced and Emerging Economies: Economic Versus Voting Power*

Nominal GDP, 2019 Voting Power, 2019 (IBRD, IDA, World Bank)*

*

Red: The share of seven largest emerging economies of total votes.

Blue: The share of seven largest advanced economies of total vote.

The World Bank comprises the International Bank for Reconstruction and Development (IBRD), which provides loans to middle-income economies, and the International Development Association (IDA), which targets low-income economies.


There is a gap between the economic share of emerging economies and their voice in the international community. And the gap is deepening. Since emerging economies are growing relatively faster, their economic share will exceed that of advanced economies within a decade or two.

From reforms to retrenchment

Since the early 2010s, China has been promoting the huge, multi-decade Belt and Road Initiative (BRI), which seeks to energize industrialization and modernization in many large emerging and developing economies. The Obama administration took a skeptical view of the initiative, which the Trump administration has branded as a “national security risk” to America.

In October 2013, China proposed creating a new multilateral development bank, the Asian Infrastructure Investment Bank (AIIB). In the Obama era, the White House stayed out of the AIIB and tried – but failed – to prevent its partners and allies from joining the Bank.

A year later, Brazil, Russia, India, China and South Africa launched the New Development Bank (NDB) to accelerate lending on infrastructure projects. The Obama White House sought to marginalize it, while the Trump administration sees cooperative activities with “potential Eurasian hegemons” as a national security risk.

As the World Bank may face a divisive political struggle, U.S. interests are growing more prominent at the IMF, while the WTO has been targeted by trade hawks. Attempts by emerging and developing economies to help themselves are shunned as security threats to American interests. Meanwhile, the West’s multilateral development banks are bailing out rich European economies, targeting poorer ones and sanctioning those that oppose Washington’s unilateralism.

The gap between the multipolar 21st century world economy and aging West, which created its prosperity through colonial plunder in the 19th century, is progressively deepening. That serves neither America’s nor emerging powers’ long-term interests.

About the Author:

Dr. Dan Steinbock is the founder of Difference Group and has served at the India, China and America Institute (US), Shanghai Institute for International Studies (China) and the EU Center (Singapore). For more, see http://www.differencegroup.net/ 

The original commentary was published by China-US Focus on February 11, 2019


Our May Tech Stock Market Prediction – PART II

By TheTechnicalTraders.com

If you missed PART 1 (SP500 Price Forecast) be sure to read it here.

Here is PART II let’s take a look at the NQ Weekly chart with the ADL predictive price modeling.

We are going to include predictions made by our Adaptive Dynamic Learning (ADL) price modeling system that originated from December 2017 going all the way forward through to the end of May 2019.

At this point, we are going to highlight our earlier predictions (all of 2018 and into Q1/Q2 of 2019) and show you what the market has done since these calls were made back in September 2018.  Pay attention to this weekly chart and pay attention to the YELLOW ARROWS on this chart.  We have highlighted key predictive price modeling points with these yellow arrows on the chart to show you what our ADL predictive modeling system suggested would happen back in December 2017.

Now, take a look at the NQ Weekly chart with the ADL predictive price modeling results displayed onto it.  Pay attention to the similarities in the price patterns and the rotational modeling differences between the two charts.  The ES ADL modeling predictions from “Part I” are similar to this NQ chart, but the differences really tell us about how the technology-heavy NASDAQ (NQ) will react in a different manner than the Blue-Chip heavy ES.

Also, pay attention to the right side of this chart where the ADL predictive modeling system is suggesting price weakness will roll into the NQ near May 2018 and how this may become an issue for some traders.

Remember, the differences between these two charts really show you where strengths and weakness apply to the different sectors of the US stock market.  One sector may be trending upward while another sector may see weakness.  All of this plays into how we find and see opportunities for our members and decide on trading opportunities for success.


Think about how powerful this predictive price modeling system really is to be able to call this market moves 10~20+ months in advance.  Certainly, it is not perfect in every prediction, but the advanced knowledge and resources it provides is has proven to be a powerful tool for insight into future price direction.

It is not too often that we share this level of research with the general public. We issued the September 2018 research post because we wanted to warn our followers that a massive price decline/rotation was about to unfold.  You can read all of our free research posts.  Today, we are sharing with you our ADL predictive price modeling results for the next 3~4 months for the NQ – how valuable is that?  If you save or print this article, you will be able to reference it going forward for the next 90+ days and compare the real price action to our ADL predictive modeling results.  We believe the results will be similar to what our ADL is suggesting and we can see these ADL results for any instrument traded throughout the world.

We believe 2019 will be an incredible year for skilled traders and we believe the markets will set up numerous trade setups for fantastic profits.  We are already hard at work developing new member tools, research models and algo trading systems to help our members take advantage of these incredible market moves.  Please take a minute to see how our researchers and traders at  TheTechnicalTraders.com can assist you this year.  We will be launching an incredible new member tool in about 30~60 days.  You won’t want to miss this fantastic new software utility to help you find and execute great trades.  See you in the member’s section of our site.

Chris Vermeulen
Technical Traders Ltd.


What are the three key drivers for Bitcoin’s price rebound?

By George Prior

Bitcoin is finally on the verge of breaking out of the bearish sentiment that has gripped the cryptocurrency market, affirms the CEO of one of the world’s largest independent financial advisory organizations.

The comments from Nigel Green, chief executive of deVere Group, follow surging Bitcoin prices at the end of last week.  On Friday, the world’s largest and original digital currency jumped around 10 per cent within 24 hours, pushing past $3,700 for the first time in three weeks.

He observes: “It was a relatively sudden jump, and, of course, positive news for those holding Bitcoin.

“However, the price only reached the top of the trading range and investors should not be popping champagne corks just yet.”

Mr Green continues: “There are three likely drivers of Bitcoin’s price spike.

“First, there are widely published reports that according to a leaked interview with a commissioner, a Bitcoin ETF could imminently secure approval from the U.S. securities watchdog.

“Second, the development of the lightning network which will dramatically improve Bitcoin’s well-documented scalability issues, allowing it to move towards mass adoption.

“And third, the 2020 Bitcoin halving.  The code for mining Bitcoin halves around every four years and the next one is set for May 2020. When the code halves, miners receive 50 per cent fewer coins every few minutes.  History shows that there is typically a considerable Bitcoin surge resulting from halving events.”

The deVere CEO concludes: “Bitcoin is the flagship cryptocurrency and, as such, we can expect when its values climb, it will drive prices of other major digital currencies such as Ethereum and XRP.”

About:

deVere Group is one of the world’s largest independent advisors of specialist global financial solutions to international, local mass affluent, and high-net-worth clients.  It has a network of more than 70 offices across the world, over 80,000 clients and $12bn under advisement.

EURGBP gets ready for another leg down

By Tomasz Wisniewski, Alpari

Monday starts for us with a very nice and technical setup on the EURGBP pair. The situation there is pretty clear and neat without any unnecessary fireworks. Before we get into the details here, let me first show you what happened with our previous analysis of this instrument. This was on the 14th of January, when the pair was trading at 0.892. Back then, we had a bearish outlook, and I wrote the following:

“As long as we stay below the lower green line, sentiment is negative, and we should see a further decline. Our target is on the yellow horizontal support, so 270 pips lower. Quite promising, right?”

EURGBP H4

270 pips, right? On the 25th of January, the price was around 300 pips lower and that is our local low for now. We’re usually very modest, but you have to admit that this was a great call! Since making that low, we’ve been seeing bullish correction. The initial phase of the correction was shaped like a wedge (blue) and did not surprise traders because it ended with a bearish breakout. After that, the price created another wedge, but this time significantly smaller (purple). This one should end up with a bearish breakout too and that is our latest outlook on this instrument.

If you want to play it safe and you are not totally convinced by the sell signal, you can wait for a breakout of the light blue horizontal support first. As for a target, we can look towards the green line around 0.863, i.e. the lows from January. The sell signal will be cancelled if the rate breaks above the top of the blue wedge, which is currently not very likely to happen.

Forex Technical Analysis & Forecast 11.02.2019 (EURUSD, GBPUSD, USDCHF, USDJPY, AUDUSD, USDRUB, GOLD, BRENT)

Article By RoboForex.com

EURUSD, “Euro vs US Dollar”

EURUSD is still trading downwards; right now, it is forming another consolidation range near the lows. Possibly, today the pair may reach 1.1313 and then resume growing to break 1.1338. Later, the market may break this level and then continue trading upwards with the first target at 1.1365.

EURUSD
Risk Warning: the result of previous trading operations do not guarantee the same results in the future

GBPUSD, “Great Britain Pound vs US Dollar”

GBPUSD is consolidating around 1.2937. Today, the pair may fall to reach 1.2903 and then form one more ascending structure with the target at 1.2953. After that, the instrument may start a new decline towards 1.2883.

GBPUSD
Risk Warning: the result of previous trading operations do not guarantee the same results in the future

USDCHF, “US Dollar vs Swiss Franc”

USDCHF has reached the key upside target; right now, it is quickly falling towards 0.9970. Later, the market may start a new correction with the target at 1.0010.

USDCHF
Risk Warning: the result of previous trading operations do not guarantee the same results in the future

USDJPY, “US Dollar vs Japanese Yen”

USDJPY is forming the Flag correctional pattern; right now, it is expanding the consolidation range upwards. According to the main scenario, the pair is expected to fall with the target at 109.50. After that, the instrument may start a new growth towards 110.30.

USDJPY
Risk Warning: the result of previous trading operations do not guarantee the same results in the future

AUDUSD, “Australian Dollar vs US Dollar”

AUDUSD has completed the ascending correction. Today, the pair may form a new descending structure towards 0.7080. If later the instrument breaks 0.7115 to the upside, the price may continue the correction to reach 0.7137; if 0.7080 to the downside – resume trading inside the downtrend with the target at 0.7044.

AUDUSD
Risk Warning: the result of previous trading operations do not guarantee the same results in the future

USDRUB, “US Dollar vs Russian Ruble”

USDRUB has returned to 65.78. Possibly, today the pair may form one more ascending structure to reach 66.37. Later, the market may continue trading inside the downtrend with the short-term target at 62.90.

USDRUB
Risk Warning: the result of previous trading operations do not guarantee the same results in the future

XAUUSD, “Gold vs US Dollar”

Gold is moving downwards. Today, the pair may reach 1308.15. After that, the instrument may break this level and then continue trading inside the downtrend with the short-term target at 1299.44.

GOLD
Risk Warning: the result of previous trading operations do not guarantee the same results in the future

BRENT

Brent is trading downwards as well; in fact, it is forming the Flag correctional pattern. Possibly, today the pair may form the fifth structure of the pattern with the target at 60.45. Later, the market may continue trading upwards towards the key target at 63.95.

BRENT

Article By RoboForex.com

Attention!
Forecasts presented in this section only reflect the author’s private opinion and should not be considered as guidance for trading. RoboForex LP bears no responsibility for trading results based on trading recommendations described in these analytical reviews.

Our May Stock Market Prediction – PART I

By TheTechnicalTraders.com

As we enter the final stage of our market predictions from nearly 5 months ago, we thought it would be a good time to revisit these predictions and to update all of our followers with some timely and, apparently, accurate market data.  We hope that many of you remember out predictions from September 2018 where we called for a 5~8% market decline, followed by a basing market headed into the November 2018 US elections, followed by a deep “Ultimate Low” price rotation before we called for an incredible upside price rally?  The reason it is so important to watch for and understand all of our research is that we are attempting to provide great value and insight to our followers as well as help them protect their open positions from unknown risks.

As a bonus to all of this, we are going to include predictions made by our Adaptive Dynamic Learning (ADL) price modeling system that originated from December 2017 going all the way forward through to the end of May 2019.  Can you imagine what it would be like to have a tool that could show you what is likely to happen going forward 6 months, 12 months or even 24 months into the future?  Well, that is what we have with the ADL predictive price modeling system and we are going to show you how well it has been able to pick the future of the markets for the past 15+ months.  Here we go.

At this point, we are going to highlight our earlier predictions (all of 2018 and into Q1/Q2 of 2019) and show you what the market has done since these calls were made back in September 2018.  Pay attention to this Weekly ES (S&P 500 chart) and pay attention to the YELLOW ARROWS on this chart.  We have highlighted key predictive price modeling points with these yellow arrows on the chart to show you what our ADL predictive modeling system suggested would happen back in December 2017.

If you follow these arrows from left to right, you’ll see how the ADL system predicted an early price breakdown in 2018 – we call this a “Price Anomaly” where price moves against the predicted price targets, then reverts back to near these targets.  These can be incredibly profitable trading opportunities for skilled traders as well.  That early 2018 breakdown in price was a -318 pt move (-10.95%) and we were alerted to it well before it happened.

The next phase of the ADL price modeling system was to suggest that Q1 and Q2 2018 would settle into an extended basing pattern with a moderate upside price bias.  You can see how accurate the timing of this ADL prediction was and how price reacted to this basing phase through June 2018.

The next phase of the ADL price model showed a Q3 price rally/uptrend with a potential upside move of about +210 pts (+8%). The real price move from these points (basing end to top) was +197 pts (+7.19%).  The actual price top (another Price Anomaly pattern) happened on September 17/24, 2018.

Pay attention to that last date: September 17, 2018, and read this post from that date.  This is the research post that issued our latest warning/predictions that cover the past 5+ months.

You can clearly see that our ADL predictive modeling system was calling for a -5~8% price decline in August, September 2018.  Again, this type of early warning feature provided by the ADL also sets up Price Anomaly patterns – when price moves against the ADL predictive modeling system and allows for a reversion trade setup.  This is just such an event.  As we were aware of the potential for a downside price event, yet price continued to push higher till October 1, 2018.  When price did, finally, break lower, we can see how quickly the -5~8% ADL prediction became true.  It only took 6 weeks for the price to break downward -326 pts (-11.15%), then begin to base.

This is where things start to get interesting for us and our readers/followers.  Our analysis on September 17, 2018, suggested that the US stock markets would base and trade sideways before the November 6, 2018, US elections, then break lower to establish an “Ultimate Low” price pattern.  What we didn’t expect was the size and scope of the “Ultimate Low” price rotation that happened in the markets.  Our ADL modeling system suggested a -115 pt (-4.45%) downward price rotation was likely.  What really happened was the markets collapsed -453 pts (-16.17%).

After the Ultimate Low price setup, the ADL predicted an upside price rally in excess of 400 pts (+17.5%) and what has recently transpired, so far, is an upside price rally of 421 pts (+18.17%).

Think about how powerful this predictive price modeling system really is to be able to call this market moves 10~20+ months in advance.  Certainly, it is not perfect in every prediction, but the advanced knowledge and resources it provides is has proven to be a powerful tool for insight into future price direction.

What should we expect going forward?  Take a look at the yellow lines drawn into the future of this chart.  If our ADL price model is correct, then we should continue to see more moderate upside price bias with prices trading a bit more narrowly in a “melt-up” type of environment through the middle/end of June 2019.  Want to know what our ADL predictive price model is showing for the rest of the year and into early 2020, then visit TheTechnicalTraders.com and learn why our members benefit from our tools and research in far more detail than we deliver in these public posts.

It is not too often that we share this level of research with the general public. We issued the September 2018 research post because we wanted to warn our followers that a massive price decline/rotation was about to unfold.  You can read all of our public free research posts.  Today, we are sharing with you our ADL predictive price modeling results for the next 3~4 months for the SP500 – how valuable is that?  If you save or print this article, you will be able to reference it going forward for the next 90+ days and compare the real price action to our ADL predictive modeling results.  We believe the results will be similar to what our ADL is suggesting and we can see these ADL results for any instrument traded throughout the world.

We believe 2019 will be an incredible year for skilled traders and we believe the markets will set up numerous trade setups for fantastic profits.  We are already hard at work developing new member tools, research models and algo trading systems to help our members take advantage of these incredible market moves.  Please take a minute to see how our researchers and traders at TheTechnicalTraders.com can assist you this year.  We will be launching an incredible new member tool in about 30~60 days.  You won’t want to miss this fantastic new software utility to help you find and execute great trades.  See you in the member’s section of our site.

Chris Vermeulen
Technical Traders Ltd.


Oil Volatile Again

By Dmitriy Gurkovskiy, Chief Analyst at RoboForex

On Monday, February 11, Brent is trading close to 61.50 USD and falling, although bulls were dominating the instrument last Friday.

The number of oilrigs in the USA added 4 units over a week by February 8, up to 1049. In Canada, the same indicator lost 3 units and now equals to 240.

After Baker Hughes published these numbers last Friday, oil prices were still rising slowly, although they had to fall, because the readings were rather bearish.

Everything was quite simple: there were speculations on the oil market, which pushed the price upwards. The US Congress has plans to review a draft law allowing the USA to accuse other countries members of the OPEC in manipulating oil prices. The idea is not new and the Congress discussed it in the past one way or another, but this time this law has more chances to be approved – everyone knows that the US President Donald Trump is very aggressive when it comes to the OPEC.

So, what does the US Congress may really do? In case it is really necessary, the Congress may deprive the OPEC members of sovereign immunity, thus making them vulnerable to accusations in different conspiracies. This is what makes oil prices go up.

As we can see in the H4 chart, the mid-term tendency is still moving upwards, while the short-term one is trying to go in the opposite direction. The short-term tendency is confirmed by the divergence on MACD, which may indicate the start of a new bearish phase. The closest downside target will be the support line of the mid-term trend at 60.20. If the price breaks this level, the descending tendency may continue to reach the next target at 58.55 (38.2% Fibo). At the same time, the instrument may yet break the local resistance at 62.55 and continue growing towards the mid-term one at 64.20.

In the H1 chart, the price is steadily trading downwards, but there is a convergence on Stochastic Oscillator. In this light, the price may break the resistance line at 62.55.

Disclaimer

Any predictions contained herein are based on the authors’ particular opinion. This analysis shall not be treated as trading advice. RoboForex shall not be held liable for the results of the trades arising from relying upon trading recommendations and reviews contained herein.

Fibonacci Retracements Analysis 11.02.2019 (GOLD, USDCHF)

Article By RoboForex.com

XAUUSD, “Gold vs US Dollar”

As we can see in the H4 chart, the divergence made XAUUSD start a new descending correction, which is heading towards the retracement of 23.6% at 1287.00. The next targets of this pullback may be the retracements of 38.2% and 50.0% at 1262.75 and 1243.20 respectively. The resistance level is the high at 1326.23.

GOLD1
Risk Warning: the result of previous trading operations do not guarantee the same results in the future

In the H1 chart, there are two possible scenarios. According to the first one, the pair has reached the retracement of 50.0% and right now is finishing the local pullback due to the convergence on MACD. The second scenario implies that the price may form a new rising impulse towards the retracements of 61.8% and 76.0% at 1317.20 and 1320.60 respectively, or even break the high. The support level is at 1302.74. If the instrument breaks it, the pair may continue the long-term downtrend.

GOLD2
Risk Warning: the result of previous trading operations do not guarantee the same results in the future

USDCHF, “US Dollar vs Swiss Franc”

As we can see in the H4 chart, USDCHF completed a quick and volatile rising impulse, broke the previous high, but then returned to the downside. The mid-term support is at 0.9874. If the price breaks the previous high, the pair may continue growing towards the post-correctional extension area between the retracements of 138.2% and 161.8% at 1.0285 and 1.0383 respectively. The resistance level is the high at 1.0149.

USDCHF1
Risk Warning: the result of previous trading operations do not guarantee the same results in the future

In the H1 chart, after finishing the rising impulse, the pair started a new pullback, which has already reached the retracement of 38.2%. In the future, the uptrend may continue towards the retracements of 50.0% and 61.8% at 0.9932 and 0.9881 respectively.

USDCHF2
Risk Warning: the result of previous trading operations do not guarantee the same results in the future

Article By RoboForex.com

Attention!
Forecasts presented in this section only reflect the author’s private opinion and should not be considered as guidance for trading. RoboForex LP bears no responsibility for trading results based on trading recommendations described in these analytical reviews.

The Analytical Overview of the Main Currency Pairs on 2019.02.11

Analytics by JustForex

The EUR/USD currency pair

Technical indicators of the currency pair:
  • Prev Open: 1.13383
  • Open: 1.13191
  • % chg. over the last day: -0.10
  • Day’s range: 1.13146 – 1.13300
  • 52 wk range: 1.1214 – 1.2557

EUR stabilized after a long fall since the beginning of the month. Right now EUR/USD quotes are consolidating. The key support and resistance levels are 1.13150 and 1.13350. A US/China trading conflict is in the spotlight. Keep in mind that the countries made a truce until March 1 to find a compromise. The investors are waiting for the next round, set to commence this week. Keep an eye on the relevant intel regarding and open positions from the key levels.

The Economic News Feed for 11.02.2019 is calm.

EUR/USD

The price fixed below 50 MA and 200 MA which points to the power of the sellers.

The MACD histogram is in the negative zone but above the signal line, which gives a weak signal to sell EUR/USD.

The Stochastic Oscillator is in the neutral zone, the %K line is crossing the %D line. There are no signals at the moment.

Trading recommendations
  • Support levels: 1.13150, 1.13000, 1.12500
  • Resistance levels: 1.13350, 1.13600, 1.13800

If the price fixes below the local support 1.13150, expect the quotes to fall toward 1.12800-1.12600.

Alternatively, the quotes can recover toward 1.13600-1.13800.

The GBP/USD currency pair

Technical indicators of the currency pair:
  • Prev Open: 1.29480
  • Open: 1.29289
  • % chg. over the last day: -0.05
  • Day’s range: 1.29075 – 1.29386
  • 52 wk range: 1.2438 – 1.4378

GBP/USD has an ambiguous technical picture. The pound is being traded in a flat. The key range is 1.29000-1.29450. The financial market participants are waiting for new information regarding Brexit. This week the UK will publish some important reports which may change the GBP/USD balance in the short-term. Open the positions from the key levels.

The Economic News Feed for 11.02.2019:

  • – GDP Report (GB) – 11:30 (GMT+2:00);
  • – Volume of Industrial Production (GB) – 11:30 (GMT+2:00);
GBP/USD

The price fixed below 50 MA and 200 MA, which points to the power of the sellers

The MACD histogram is in the negative zone and below the signal line, which points to the bearish mood.

The Stochastic Oscillator is near the oversold zone, the %K line is below the %D line which gives a weak signal to sell GBP/USD.

Trading recommendations
  • Support levels: 1.29000, 1.28600
  • Resistance levels: 1.29450, 1.29750, 1.30000

If the price fixes below the round 1.29000 consider selling GBP/USD. The movement will tend toward 1.28600-1.28400.

Alternatively, the quotes can grow toward 1.29750-1.30000.

The USD/CAD currency pair

Technical indicators of the currency pair:
  • Prev Open: 1.32979
  • Open: 1.32630
  • % chg. over the last day: -0.23
  • Day’s range: 1.32629 – 1.32965
  • 52 wk range: 1.2248 – 1.3664

USD/CAD had a little sell-off on Friday and updated the local minimums. The demand on the CAD grew after an optimistic Labour Market report and the primary construction data. Right now USD/CAD is consolidating around 1.32600-1.32950 and can correct further. Open the positions from the key levels.

The Economic News Feed for 11.02.2019:= is calm.

USD/CAD

The indicators do not provide precise signals, the price has crossed 50 MA.

The MACD histogram is close to 0.

The Stochastic Oscillator is in the neutral zone, the %K line is below the %D line, which gives a signal to sell USD/CAD.

Trading recommendations
  • Support levels: 1.32600, 1.32300, 1.32000
  • Resistance levels: 1.32950, 1.33250

If the price fixes below 1.32600 expect the quotes to correct toward 1.32300-1.32000.

Alternatively the quotes can grow toward 1.33250-1.33500.

The USD/JPY currency pair

Technical indicators of the currency pair:
  • Prev Open: 109.790
  • Open: 109.736
  • % chg. over the last day: -0.07
  • Day’s range: 109.722 – 110.028
  • 52 wk range: 104.56 – 114.56

USD/JPY keeps trading in a long flat. There is no single defined trend. The financial market participants are waiting for additional drivers. The USD/JPY quotes are testing the 110.000-110.150 zone. The local support is 109.750. You should open positions from the key levels and keep an eye on the US/China trading conflict.

Today the trading activity and volatility on USD/JPY may be smaller than usual due to the celebrations in Japan.

USD/JPY

The price fixed above 50 MA and 200 MA which points to the power of the buyers.

The MACD histogram is in the positive zone and keeps rising which points to a bullish mood.

The Stochastic Oscillator is in the overbought zone, the %K line is crossing the %D line. There are no signals at the moment.

Trading recommendations
  • Support levels: 109.750, 109.550, 109.200
  • Resistance levels: 110.000, 110.150, 110.500

If the price fixes above 110.150, expect it to grow toward 110.500-110.700.

Alternatively, the price can fall toward 109.500-109.300.

Analytics by JustForex