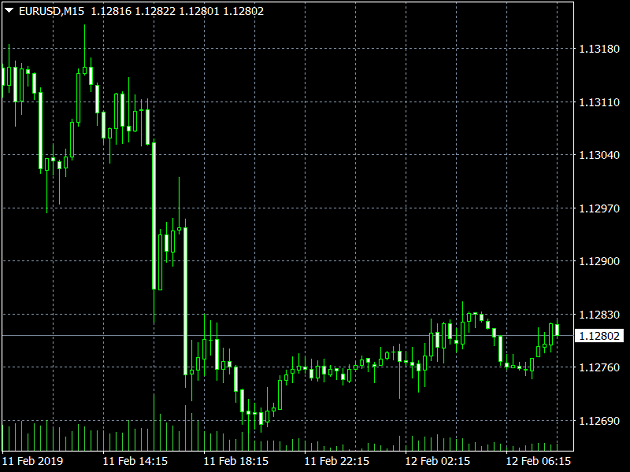
The EUR/USD currency pair
- Prev Open: 1.12742
- Open: 1.13249
- % chg. over the last day: +0.50
- Day’s range: 1.13129 – 1.13414
- 52 wk range: 1.1214 – 1.2557
Yesterday, the USD index (#DX) retreated from the monthly maximums and closed in the red. The US/China trading conflict remains in the spotlight. The demand for the high-risk assets grew after the statement by Donald Trump. The US president claimed that he is ready to prolong the truce between the countries. The key support and resistance levels are 1.13000 and 1.13400. You should open positions from these levels. EUR has a tendency to correct further.
The Economic News Feed for 13.02.2019:
- – GDP report (EU) – 12:00 (GMT+2:00);
- – Inflation report (US) – 15:30 (GMT+2:00);

The indicators do not provide precise signals. The price fixed between 50 MA and 200 MA which act as dynamic support and resistance levels.
The MACD histogram is in the positive zone but below the signal line, which gives a weak signal to buy EUR/USD.
The Stochastic Oscillator is in the neutral zone, the %K line is below the %D line, which points to a bearish mood.
- Support levels: 1.13000, 1.12600
- Resistance levels: 1.13400, 1.13800, 1.13400
If the price fixed above 1.13400, expect the quotes to recover toward 1.13800-1.14000.
Alternatively, the quotes can fall toward 1.12700-1.12500.
The GBP/USD currency pair
- Prev Open: 1.28535
- Open: 1.28910
- % chg. over the last day: +0.31
- Day’s range: 1.28901 – 1.29227
- 52 wk range: 1.2438 – 1.4378
GBP/USD retreated from the monthly maximums, which was caused by the technical factors. The demand for high-risk assets has grown, which provided the pound with some support. The financial market participants keep watching the Brexit situation. The GBP/USD quotes are consolidating around 1.28850-1.29250. You should open positions from these levels and wait for more reports.
At 11:30 (GMT+2:00) the UK will publish an inflation report.

The indicators do not provide precise signals, the price fixed between 50 MA and 200 MA.
The MACD histogram is in the positive zone and above the signal line, which gives a strong signal to buy GBP/USD.
The Stochastic Oscillator is in the neutral zone, the %K line is below the %D line, which points to a bearish mood.
- Support levels: 1.28850, 1.28500
- Resistance levels: 1.29250, 1.29750, 1.30000
If the price fixes above 1.29250, expect the quotes to correct toward 1.29700-1.30000.
Alternatively, the quotes can fall toward 1.28300-1.28500.
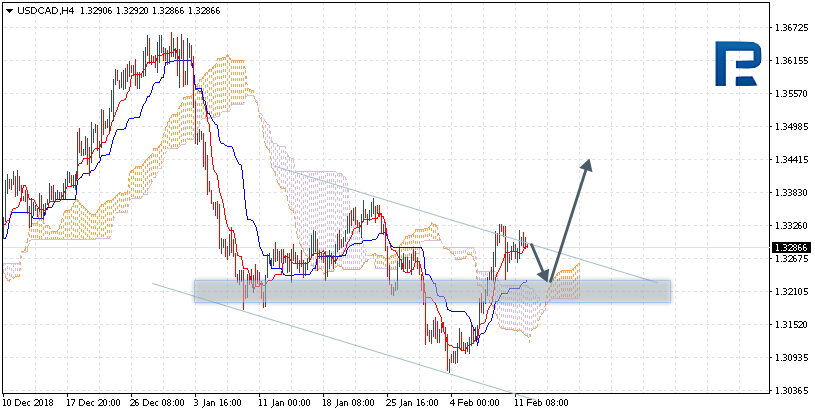
The USD/CAD currency pair
- Prev Open: 1.32941
- Open: 1.32360
- % chg. over the last day: -0.55
- Day’s range: 1.31961 – 1.32376
- 52 wk range: 1.2248 – 1.3664
The USD/CAD started to descend. During the last two days of trading, the CAD strengthened against USD by more than 80 points and updated the key extremums. Right now the quotes are consolidating around 1.32000-1.32400. The trading instrument has a tendency for future correction. You should open positions from these levels.
The Economic News Feed for 13.02.2019 is calm.

The indicators do not provide precise signals, the price fixed between 50 MA and 200 MA.
The MACD histogram is in the negative zone but above the signal line which gives a weak signal to sell USD/CAD.
The Stochastic Oscillator is in the neutral zone, the %K line is above the %D line, which points to a bullish mood.
- Support levels: 1.32000, 1.31600
- Resistance levels: 1.32400, 1.32650, 1.32950
If the price fixes below 1.32000, expect the quotes to fall toward 1.31600-1.31400.
Alternatively, the quotes can recover toward 1.32700-1.33000.
The USD/JPY currency pair
- Prev Open: 110.333
- Open: 110.458
- % chg. over the last day: +0.12
- Day’s range: 110.417 – 110.767
- 52 wk range: 104.56 – 114.56
USD/JPY remains in a bullish mood. Right now the trading instrument is testing the resistance at 110.750. 110.400 acts as the key support. The demand on the high-risk assets remains high. You should open positions from the key levels. Keep an eye on the US economic reports.
The Economic News Feed for 13.02.2019 is calm.

The price fixed above 50 MA and 200 MA which points to the power of the buyers.
The MACD histogram is in the positive zone and keeps rising which points to a bullish mood.
The Stochastic Oscillator is in the neutral zone, the %K line is crossing the %D line. There are no signals at the moment.
- Support levels: 110.400, 110.000, 109.600
- Resistance levels: 110.750, 111.000
If the price fixes above 110.750, expect the quotes to grow toward 111.000-11.250.
Alternatively, the quotes can descend toward 110.150-110.000.