Last week, the US dollar strengthened against currency majors. On Friday, February 8, the dollar index (#DX) updated monthly highs and closed in the positive zone (+0.13%). The trade conflict between Washington and Beijing is still in the spotlight. Today, there will be a meeting between representatives of the US and China delegations in Beijing. The US delegation will continue to insist on the fulfillment of Washington’s requirements regarding the protection of intellectual property.
Quite optimistic statistics from Canada were published on Friday. Thus, the employment rate improved in January and counted to 66.8K, while experts expected 8.0K. However, the unemployment rate rose to 5.8% in January instead of 5.7%. Housing starts counted to 208.0K and exceeded market expectations at the level of 205.0K.
Today, a number of important economic data from the UK is expected. Investors’ attention is also focused on Brexit. Prime Minister, Theresa May, should make significant progress in the Brexit negotiations by February 13, otherwise, the government will come up with an amendment that will allow parliamentarians to control more the Brexit process.
The “black gold” prices show negative dynamics due to the growth of drilling activity in the United States. At the moment, futures for the WTI crude oil are testing a mark of $52.25 per barrel.
Market Indicators
On Friday, there was a variety of trends in the US stock market: #SPY (+0.12%), #DIA (-0.23%), #QQQ (+0.20%).
The 10-year US government bonds yield fell slightly. Currently, the indicator is at the level of 2.64-2.65%.
The UK news feed on 11.02.2019:
– GDP data at 11:30 (GMT+2:00); – Manufacturing production at 11:30 (GMT+2:00).
EURUSD has been doing pretty terribly over the past few days. A quick look on the charts will tell you that the last six trading days have all been bearish. The last time this happened was at the end of September and the beginning of October, 2018. Back then, 6 days was enough and the pair went on to make a small bullish correction. History can repeat itself now and we have one strong reason for believing that it will.
The bullish window comes from the fact that the pair is currently approaching a very important technical level. This is the lower line of the long-term symmetrical triangle pattern (purple). The symmetrical triangle has been forming here since September 2018, and is causing the overall volatility to drop. Triangles are very good and reliable patterns to trade, but not when the price is still inside. What trend followers love to do is to wait for the price to break from this formation and they trade in the direction of the breakout. This is a very common price action technique used by thousands of traders.
As we’ve mentioned, EURUSD is currently on the lower line of this pattern. The price can either bounce or break that line. What price action enthusiasts do at times like these is wait. Any bullish candlestick on that line, like a hammer or engulfing, will be a signal to buy. On the other hand, the price closing the day below the lower line of the triangle will be a strong signal to do the opposite and sell.
As we enter the final stage of our market predictions from nearly 5 months ago, we thought it would be a good time to revisit these predictions and to update all of our followers with some timely and, apparently, accurate market data. We hope that many of you remember out predictions from September 2018 where we called for a 5~8% market decline, followed by a basing market headed into the November 2018 US elections, followed by a deep “Ultimate Low” price rotation before we called for an incredible upside price rally? The reason it is so important to watch for and understand all of our research is that we are attempting to provide great value and insight to our followers as well as help them protect their open positions from unknown risks.
As a bonus to all of this, we are going to include predictions made by our Adaptive Dynamic Learning (ADL) price modeling system that originated from December 2017 going all the way forward through to the end of May 2019. Can you imagine what it would be like to have a tool that could show you what is likely to happen going forward 6 months, 12 months or even 24 months into the future? Well, that is what we have with the ADL predictive price modeling system and we are going to show you how well it has been able to pick the future of the markets for the past 15+ months. Here we go.
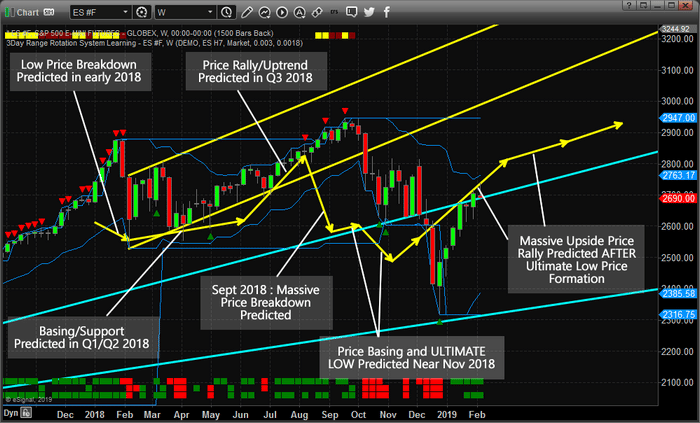
At this point, we are going to highlight our earlier predictions (all of 2018 and into Q1/Q2 of 2019) and show you what the market has done since these calls were made back in September 2018. Pay attention to this Weekly ES (S&P 500 chart) and pay attention to the YELLOW ARROWS on this chart. We have highlighted key predictive price modeling points with these yellow arrows on the chart to show you what our ADL predictive modeling system suggested would happen back in December 2017.
If you follow these arrows from left to right, you’ll see how the ADL system predicted an early price breakdown in 2018 – we call this a “Price Anomaly” where price moves against the predicted price targets, then reverts back to near these targets. These can be incredibly profitable trading opportunities for skilled traders as well. That early 2018 breakdown in price was a -318 pt move (-10.95%) and we were alerted to it well before it happened.
The next phase of the ADL price modeling system was to suggest that Q1 and Q2 2018 would settle into an extended basing pattern with a moderate upside price bias. You can see how accurate the timing of this ADL prediction was and how price reacted to this basing phase through June 2018.
The next phase of the ADL price model showed a Q3 price rally/uptrend with a potential upside move of about +210 pts (+8%). The real price move from these points (basing end to top) was +197 pts (+7.19%). The actual price top (another Price Anomaly pattern) happened on September 17/24, 2018.
Pay attention to that last date: September 17, 2018, and read this post from that date. This is the research post that issued our latest warning/predictions that cover the past 5+ months.
You can clearly see that our ADL predictive modeling system was calling for a -5~8% price decline in August, September 2018. Again, this type of early warning feature provided by the ADL also sets up Price Anomaly patterns – when price moves against the ADL predictive modeling system and allows for a reversion trade setup. This is just such an event. As we were aware of the potential for a downside price event, yet price continued to push higher till October 1, 2018. When price did, finally, break lower, we can see how quickly the -5~8% ADL prediction became true. It only took 6 weeks for the price to break downward -326 pts (-11.15%), then begin to base.
This is where things start to get interesting for us and our readers/followers. Our analysis on September 17, 2018, suggested that the US stock markets would base and trade sideways before the November 6, 2018, US elections, then break lower to establish an “Ultimate Low” price pattern. What we didn’t expect was the size and scope of the “Ultimate Low” price rotation that happened in the markets. Our ADL modeling system suggested a -115 pt (-4.45%) downward price rotation was likely. What really happened was the markets collapsed -453 pts (-16.17%).
After the Ultimate Low price setup, the ADL predicted an upside price rally in excess of 400 pts (+17.5%) and what has recently transpired, so far, is an upside price rally of 421 pts (+18.17%).
Think about how powerful this predictive price modeling system really is to be able to call this market moves 10~20+ months in advance. Certainly, it is not perfect in every prediction, but the advanced knowledge and resources it provides is has proven to be a powerful tool for insight into future price direction.
What should we expect going forward? Take a look at the yellow lines drawn into the future of this chart. If our ADL price model is correct, then we should continue to see more moderate upside price bias with prices trading a bit more narrowly in a “melt-up” type of environment through the middle/end of June 2018. Want to know what our ADL predictive price model is showing for the rest of the year and into early 2020, then visit www.TheTechnicalTraders.com and learn why our members benefit from our tools and research in far more detail than we deliver in these public posts.
It is not too often that we share this level of research with the general public. We issued the September 2018 research post because we wanted to warn our followers that a massive price decline/rotation was about to unfold. You can read all of our public free research posts. Today, we are sharing with you our ADL predictive price modeling results for the next 3~4 months for the SP500 – how valuable is that? If you save or print this article, you will be able to reference it going forward for the next 90+ days and compare the real price action to our ADL predictive modeling results. We believe the results will be similar to what our ADL is suggesting and we can see these ADL results for any instrument traded throughout the world.
We believe 2019 will be an incredible year for skilled traders and we believe the markets will set up numerous trade setups for fantastic profits. We are already hard at work developing new member tools, research models and algo trading systems to help our members take advantage of these incredible market moves. Please take a minute to see how our researchers and traders at www.TheTechnicalTraders.com can assist you this year. We will be launching an incredible new member tool in about 30~60 days. You won’t want to miss this fantastic new software utility to help you find and execute great trades. See you in the member’s section of our site.
Russia’s central bank kept its key interest rate unchanged at 7.75 percent, as largely expected, but warned inflation is likely to rise further in coming months and future policy decisions will hinge on whether last year’s two rate hikes were sufficient to bring inflation back to the target in 2020. In December the Bank of Russia raised its rate by 25 basis points in what it described as a proactive move to limit elevated risks to inflation following a similar-sized hike in September. These two rate hikes came after the central bank had been on a steady path of policy easing from January 2015 to April 2018 during which the key rate was cut by a total of 9.75 percentage points. But a combination of higher import prices from ruble depreciation, higher food prices, and a rise in consumer prices ahead of the January 1 rise in value-added-taxes (VAT) to 20 percent from 18 percent pushed up inflation steadily in the second half of last year to 5 percent in December. Inflation remained unchanged at 5.0 percent in January, the central bank said, adding the contribution of the VAT rise to inflation last month was moderate and the full impact of the VAT increase can not be fully captured until April. “The balance of risks remains skewed towards pro-inflationary risks, especially over a short-term horizon, driven by the VAT increase and price movements in individual food products,” the central bank said, adding there is also uncertainty over external conditions and their impact on financial assets while there is a high risks of the supply of oil exceeding demand this year. The central bank expects inflation to temporarily accelerate and peak in the first half of this year before easing to 5.0 – 5.5 percent by the end of this year and then return to the target of 4.0 percent in the first half of 2020 as the effects of the ruble’s weakening and the VAT rise disappear. The first estimates of Russia’s economic growth last year show 2.3 percent, above the central bank’s estimates of 1.5 – 2.0 percent, but it added the growth in economic activity had slowed in recent months and there was a decline in the growth rate industrial production, construction, real wages and retail sales in December. However, the central bank maintained its forecast for 2019 growth of 1.2 – 1.7 percent as government spending will help boost investment this year, offsetting some of the constraining impact from the VAT rise. Russia’s ruble, which fell in the first half of 2018 and then bounced back following the central bank’s September rate hike, firmed in response to the central bank’s policy decision today and was trading at 65.8 to the U.S. dollar to be up 5.8 percent this year.
The Bank of Russia released the following press release:
“The Bank of Russia keeps the key rate at 7.75% per annum
On 8 February 2019, the Bank of Russia Board of Directors decided to keep the key rate at 7.75% per annum. In January 2019, annual inflation held at the lower bound of the Bank of Russia expectations. Inflation expectations of households and businesses increased somewhat. The contribution of the VAT increase to annual consumer price growth in January was moderate. The effect of the VAT increase on inflation can be fully assessed no sooner than this April. There persists uncertainty over future external conditions and certain food price dynamics. The balance of risks remains skewed towards pro-inflationary risks, especially over a short-term horizon. Given the decision taken, the Bank of Russia forecasts annual inflation to range between 5.0 and 5.5% by the end of 2019 and return to 4% in the first half of 2020.
In its key rate decision-making, the Bank of Russia will determine if the increases of the key rate in September and December 2018 were sufficient to bring annual inflation back to the target in 2020, taking into account inflation and economic performance against the forecast, as well as the risks associated with external conditions and financial markets’ response to them.
Inflation dynamics. In January 2019, annual inflation held at the lower bound of the Bank of Russia expectations.Annual consumer price growth rose to 5.0% in January (vs 4.3% in December 2018). The contribution of the VAT increase to annual consumer price growth in January was moderate. The effect of the VAT increase on inflation can be fully captured no sooner than this April. Faster growth of food prices to 5.5% (vs 4.7% in December 2018) played a significant role in the inflation rise in January. The acceleration of food inflation is substantively attributable to the recovery after its considerable drop in the second half of 2017 and the first half of 2018. Furthermore, prices are completing their adjustment to the ruble’s weakening of the second half of 2018. Annual inflation of prices of non-food goods and services was below that of food prices during the last 12 months.
In January, price expectations of businesses increased on the back of the earlier weakening of the ruble and the VAT increase. Household inflation expectations rose only slightly.
According to the Bank of Russia forecast, the VAT increase and the 2018 weakening of the ruble will temporarily accelerate annual inflation, which will peak in the first half of 2019 and run at 5.0-5.5% by the end of 2019. Quarterly year-on-year consumer price growth is set to decelerate to 4% as early as the second half of 2019. Annual inflation will return to 4% in the first half of 2020 when the effects of the ruble’s weakening and the VAT rise peter out.
Monetary conditions. Monetary conditions have seen no significant changes since the last Board meeting. Interest rates in individual segments of the domestic financial market have showed mixed trends. OFZ yields have declined as external financial markets regained a stable footing. Interest rates in the deposit and credit market have risen slightly. Sustained positive real interest rates are set to support the attractiveness of bank deposits and bonds and balanced growth in consumption.
Economic activity. Rosstat’s flash estimate shows that 2018 GDP growth totalled 2.3%, which exceeds the Bank of Russia’s forecast of 1.5-2%. However, recent months have seen slower growth in economic activity. December recorded a decline of growth rates in industrial production, construction volumes, real wages and retail sales. The Bank of Russia maintains its 2019 GDP growth forecast in the range of 1.2-1.7%. The VAT increase might have a slight constraining effect on business activity, mostly early in the year. The newly received budgetary funds will be used to raise government spending including investment as early as 2019. Subsequent years might see higher economic growth rates as the planned structural measures are implemented.
Inflation risks. The balance of risks remains skewed towards pro-inflationary risks, especially over a short-term horizon, driven by the VAT increase and price movements in individual food products. Uncertainty remains over future external conditions and their impact on financial asset prices. Despite the oil price growth in January 2019, the risks of supply exceeding demand in the 2019 oil market remain high.
The revisions of the expected paths of monetary policy tightening by the US Federal Reserve and other central banks in developed markets reduce the risks of persistent capital outflows from emerging markets. At the same time, geopolitical factors might lead to strengthened volatility in commodity and financial markets, affecting exchange rate and inflation expectations.
The Bank of Russia leaves mostly unchanged its assessment of risks associated with wage movements, possible changes in consumer behaviour and budget expenditures. These risks remain moderate.
In its key rate decision-making, the Bank of Russia will determine if the increases of the key rate in September and December 2018 were sufficient to bring annual inflation back to the target in 2020, taking into account inflation and economic performance against the forecast, as well as the risks associated with external conditions and financial markets’ response to them.
The Bank of Russia Board of Directors will hold its next rate review meeting on 22 March 2019. The press release on the Bank of Russia Board decision is to be published at 13:30 Moscow time.”
EURUSD has completed the ascending impulse along with the correction. Possibly, today the pair may form a new descending structure towards 1.1330 and then resume growing to break 1.1363. Later, the market may form one more ascending structure with the short-term target at 1.1395.
GBPUSD, “Great Britain Pound vs US Dollar”
GBPUSD has finished the ascending impulse; right now, it is being corrected. Possibly, the pair may fall to reach 1.2926 and then form one more ascending structure with the target at 1.3010.
USDCHF, “US Dollar vs Swiss Franc”
USDCHF has completed the first descending impulse along with the correction. Today, the pair may start a new decline to break 1.0000 and start a new correction with the target at 0.9970. After that, the instrument may continue trading upwards to reach 1.0003.
USDJPY, “US Dollar vs Japanese Yen”
USDJPY is forming the Flag correctional pattern. Possibly, today the pair may continue forming the fifth structure of the pattern with the target at 109.50. Later, the market may start a new growth towards 110.30.
AUDUSD, “Australian Dollar vs US Dollar”
AUDUSD is trading downwards; it has already reached 0.7070. Today, the pair may form a new descending structure towards 0.7045 and then start a new correction with the target at 0.7137.
USDRUB, “US Dollar vs Russian Ruble”
USDRUB has reached the short-term upside target. Possibly, today the pair may resume falling towards 65.78 and then form one more ascending structure to reach 66.37. Later, the market may start a new decline to break 64.90 and then continue trading inside the downtrend with the short-term target at 62.90.
XAUUSD, “Gold vs US Dollar”
Gold is moving downwards. Today, the pair may reach 1301.17. After that, the instrument may resume growing towards 1309.00 and then form a new descending structure with the target at 1297.50.
BRENT
Brent is trading downwards as well; in fact, it is forming the Flag correctional pattern. Possibly, today the pair may form the fifth structure of the pattern with the target at 60.42. Later, the market may continue trading upwards towards the key target at 63.95.
Attention! Forecasts presented in this section only reflect the author’s private opinion and should not be considered as guidance for trading. RoboForex LP bears no responsibility for trading results based on trading recommendations described in these analytical reviews.
As we can see in the H4 chart, the correctional downtrend continues; the pair keeps updating the lows. After reaching the retracement of 76.0%, BTCUSD may continue falling towards the low at 3121.90. However, there is a convergence on MACD, which may indicate a possible pullback towards the retracement of 61.8% at 3547.00.
In the H1 chart, the pair is consolidating and testing the lows. If the price breaks the previous low and fixes below it, the instrument may continue falling towards the post-correctional extension area between the retracements of 138.2% and 161.8% at 3286.00 and 3251.00 respectively.
ETHUSD, “Ethereum vs. US Dollar”
As we can see in the H4 chart, after reaching the retracement of 76.0%, ETHUSD is starting a new pullback towards the retracement of 61.8% at 111.30. In the future, the price may break the low and continue falling towards the post-correctional extension area between the retracements of 138.2% and 161.8% at 97.50 and 95.40 respectively.
In the H1 chart, after reaching the retracement of 76.0%, the price is forming a new correction to the upside.
Attention! Forecasts presented in this section only reflect the author’s private opinion and should not be considered as guidance for trading. RoboForex LP bears no responsibility for trading results based on trading recommendations described in these analytical reviews.
EUR/USD remains in a bearish mood. Yesterday EUR updated the local minimums again. Right now the quotes are consolidating. The local support and resistance levels are 1.13250 and 1.13450 respectively. The trading relationships between the US and China are once again on the edge. The EU worsened the expectations for 2019. The currency pair has prospects for further descend. You should seek market entry points at the key levels.
The Economic News Feed for 08.02.2019 is calm.
The price fixed below 50 MA and 200 MA which points to the power of the buyers.
The MACD histogram is in the negative zone but above the signal line which gives a weak signal to sell EUR/USD.
The Stochastic Oscillator is in the neutral zone, the %K is below the %D line which points to bearish mood.
Trading recommendations
Support levels: 1.13250, 1.13000, 1.12500
Resistance levels: 1.13450, 1.13650, 1.13800
If the price fixes below 1.13250 expect the further descend toward 1.13000-1.12750.
Alternatively, the quotes can correct toward 1.13750-1.14000.
The GBP/USD currency pair
Technical indicators of the currency pair:
Prev Open: 1.29296
Open: 1.29480
% chg. over the last day: +0.11
Day’s range: 1.29251 – 1.29582
52 wk range: 1.2438 – 1.4378
Yesterday GBP/USD had shown a lot of trading activity and volatility. As expected, the Bank of England kept the key interest rate at 0.75%. The regulator worsened the UK economic growth forecast. At the same time, the Bank does not exclude slow growth of the interest rates should the Brexit succeed. Right now the quotes are consolidating around 1.29250-1.29650. You should open positions from these levels.
The Economic News Feed for 08.02.2019 is calm.
The indicators do not provide precise signals, the price has crossed 50 MA.
The MACD histogram is close to 0.
The Stochastic Oscillator is in the neutral zone, the %K line is crossing the %D line. There are no signals at the moment.
Trading recommendations
Support levels: 1.29250, 1.28850
Resistance levels: 1.29650, 1.30000, 1.30500
If the price fixes below 1.29250 consider selling GBP/USD. The movement will tend toward 1.28850-1.28500.
Alternatively, the price can recover toward 1.30000.
The USD/CAD currency pair
Technical indicators of the currency pair:
Prev Open: 1.32099
Open: 1.32979
% chg. over the last day: +0.74
Day’s range: 1.32978 – 1.33291
52 wk range: 1.2248 – 1.3664
Yesterday USD/CAD started to show a positive dynamic. The CAD is weakened against the USD by more than 100 points. The trading instrument updated the key extremums. The quotes are testing the range of 1.32850-1.33250. The currency pair has good growth prospects. An addtional pressure on the CAD is caused by the poor oil quotes dynamics.
At 15:30 (GMT+2:00) Canada will publish a Labour Market report.
The price fixed above 50 MA and 200 MA which shows the power of the buyers.
The MACD histogram is in the positive zone but below the signal line which gives a weak signal to buy USD/CAD.
The Stochastic Oscillator is in the neutral zone, the %K line is crossing the %D line. There are no signals at the moment.
Trading recommendations
Support levels: 1.32850, 1.32500, 1.32300
Resistance levels: 1.33250, 1.33600
If the price fixed above the local resistance of 1.33250, expect the quotes to grow further. The movement will tend toward 1.33600-1.33800.
Alternatively, the quotes can descend toward 1.32600-1.32400.
The USD/JPY currency pair
Technical indicators of the currency pair:
Prev Open: 109.964
Open: 109.790
% chg. over the last day: -0.20
Day’s range: 109.648 – 109.898
52 wk range: 104.56 – 114.56
The safe haven currency keeps moving sideways. There is no single defined trend. The local levels are 109.550-109.700 and 110.000-110.150. The demand for the safe assets remains due to Washington/Beijing trading dispute. Keep an eye on it and open positions from the key levels.
The Economic News Feed for 08.02.2019 is calm.
The indicators do not provide precise signals, the price has crossed 50 MA.
The MACD histogram is close to 0.
The Stochastic Oscillator is in the neutral zone, the %K line is above the %D line, which gives a signal to buy USD/JPY.
Trading recommendations
Support levels: 109.550, 109.200, 109.000
Resistance levels: 110.000, 110.150, 110.500
If the price fixes above 110.150 expect the quotes to grow toward 110.500-110.700.
Alternatively the quotes can correct toward 109.400-109.200.
Yesterday, the US dollar strengthened again relative to a basket of major currencies. The dollar index (#DX) updated monthly highs and closed in the positive zone (+0.14%). Investors’ attention is focused on trade relations between the US and China. The conflict may escalate again. The US President, Donald Trump, said that he did not plan to meet with China’s President, Xi Jinping, before March 1, the date before which countries were supposed to conclude an agreement. Moreover, Trump intends to sign an executive order to ban Chinese telecom equipment from the US wireless networks.
The European Commission has worsened the Eurozone’s GDP growth forecast for 2019 from 1.9% to 1.3%. According to the European Commission, the forecast is reduced due to the uncertainty regarding the Brexit, as well as a slowdown in the growth of the Chinese economy. Yesterday, the Bank of England said that the UK economy in 2019 could show the slowest growth rate in 10 years. It is also associated with the complex Brexit process and the slowdown of the global economy. The regulator lowered the forecast for the country’s economic growth in 2019 from 1.7% to 1.2%. The Central Bank left the interest rate unchanged at 0.75%. At the same time, the Bank of England does not rule out a gradual increase in interest rates in case of a successful Brexit.
The Australian dollar is still under pressure. The Reserve Bank of Australia lowered its GDP growth forecast from 3.25% to 2.5%.
The “black gold” prices have been declining. At the moment, futures for the WTI crude oil are testing the mark of $52.45 per barrel.
Market Indicators
Yesterday, the bearish sentiment prevailed in the US stock market: #SPY (-0.95%), #DIA (-0.78%), #QQQ (-1.34%).
The 10-year US government bonds yield fell. Currently, the indicator is at the level of 2.65-2.66%.
Economic Data on 08.02.2019:
– Report on the labor market in Canada at 15:30 (GMT+2:00).
On Thursday the 7th of February, trading on the EURUSD pair closed down. The pair slid to 1.1325 during the European session. The euro came under pressure after the release of economic growth forecasts from the European Commission for 2019 and 2020.
The GBPUSD pair has dropped to 1.2855, after pressure was piled on the pound in the wake of economic forecasts for the UK published by the Bank of England.
The pound and euro both managed to partially recover their losses in the US session. The dollar took a hit after news that US President Donald Trump and Chinese President Xi Jinping are unlikely to meet before the 2nd of March, at which time new tariffs may come into effect. White House economic advisor Larry Kudlow said in an interview with Fox Business Network that the US and China still have “miles to go” in terms of reaching a trade deal.
Despite rising to 1.1360, Thursday’s trading on the EURUSD pair closed at 1.1343.
Day’s news (GMT+3):
10:00 Germany: current account (Dec).
16:15 Canada: housing starts (Jan).
16:30 Canada: unemployment rate (Jan), net change in employment (Jan).
21:00 US: Baker Hughes US oil rig count.
Current situation:
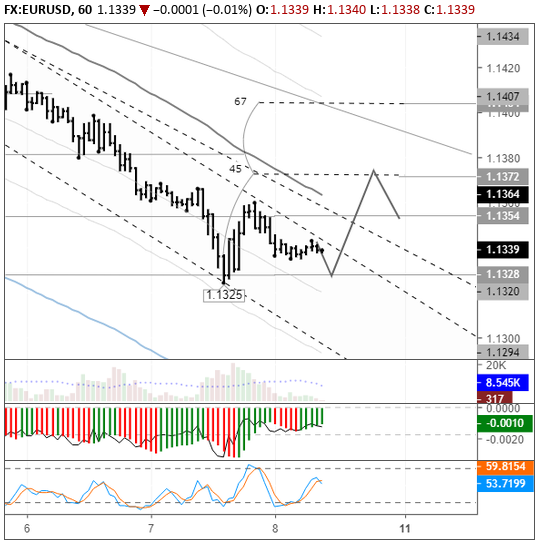
My expectations of a price drop yesterday were met in full. The pair slid to the 135th degree. Despite the fact that there’s a key support at 1.1308, I think we’re going to get an upwards reversal from current levels. At the time of writing, the euro is trading at 1.1337. In my forecast, I expect the 135th degree to be tested, followed by an upwards rebound and a breakout of two trend lines projected from the highs at 1.1488 and 1.1434. For now, I’m expecting a rise to the 45th degree at 1.1374. If everything goes according to plan, we can then expect a breakout of 1.1360. Once the bulls gain a foothold above this level, we’ll get confirmation of a double bottom. After successfully testing this level, we can set our sights on 1.1405.
Thursday’s trading session is expected to be very volatile for GBPUSD; investors are focused on the meeting of the BoE and its Inflation Report.
The British Pound remains weak against the USD on Thursday. The current quote for the instrument is 1.2934.
Thursday’s trading session can be called the Bank of England Day, because the British regulator is the major newsmaker today. The regulator is going to have another meeting today and market expectations relating to the benchmark rate imply no changes as it is believed to remain at 0.75%, the same as before. At the same time, monetary policymakers are scheduled to vote on the Quantitative Easing volume. In fact, the program “ran out of steam” few years ago, but it is still operating on a pro forma basis. A little bit later, the BoE Governor Mark Carney will speak, while the regulator is going to publish the Monetary Policy Summary and the Inflation Report.
It may well be that Carney is going to speak about the Brexit complications and say that the talks proceed no matter what. Yesterday, S&P published an analytical note saying that chances for the United Kingdom and the European Union to agree on the “soft” Brexit scenario were very high even after the deadline. The Brexit date is March 29th, but no documents have been ready yet.
If the Bank of England focuses today on the Brexit complications, the inflation slowdown, and the business activity reduction, the Pound will get under additional pressure. However, if the regulator is rather neutral and speaks mostly about monetary issues, GBPUSD may continue trading near its current levels.
Attention! Forecasts presented in this section only reflect the author’s private opinion and should not be considered as guidance for trading. RoboForex LP bears no responsibility for trading results based on trading recommendations described in these analytical reviews.