Article By RoboForex.com
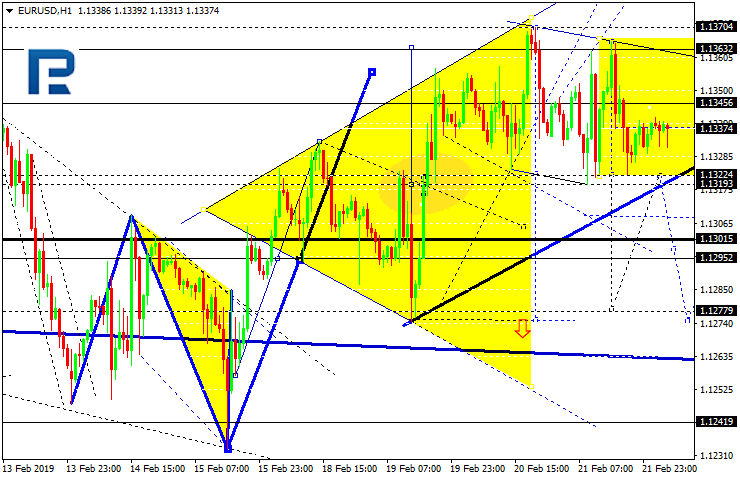
EURUSD, “Euro vs US Dollar”
EURUSD is forming another descending structure towards 1.1309. Possibly, the pair may continue forming the third descending wave to reach 1.1280 and then resume growing with the target at 1.1310. Later, the market may continue trading inside the downtrend towards 1.1300.

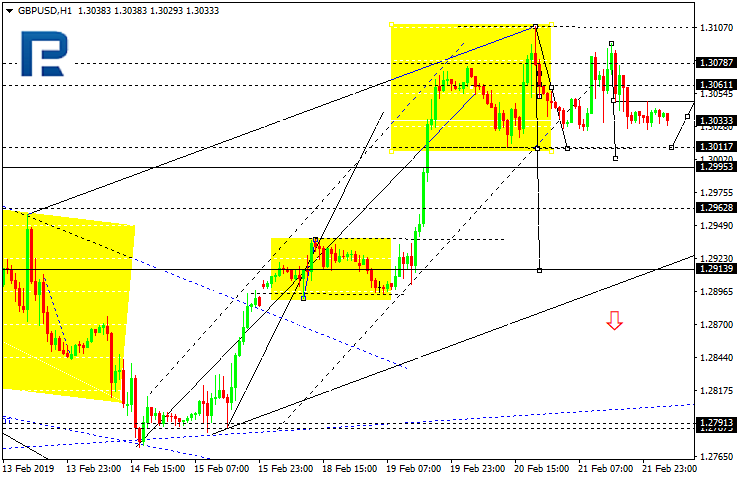
GBPUSD, “Great Britain Pound vs US Dollar”
GBPUSD is forming a new descending structure towards 1.3000. After that, the pair may start a new growth to reach 1.306 and then resume falling with the short-term target at 1.2963.
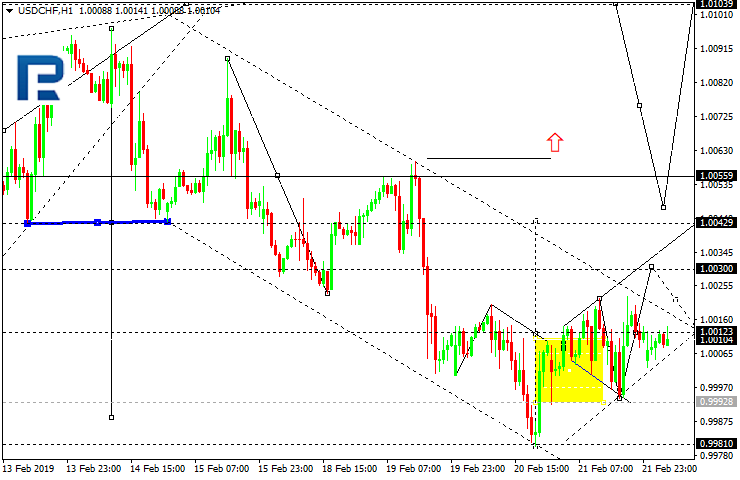
USDCHF, “US Dollar vs Swiss Franc”
USDCHF is forming a new ascending impulse towards 1.0030. Later, the price may start another decline to reach 1.0010 and then resume trading upwards with the first target at 1.0043.
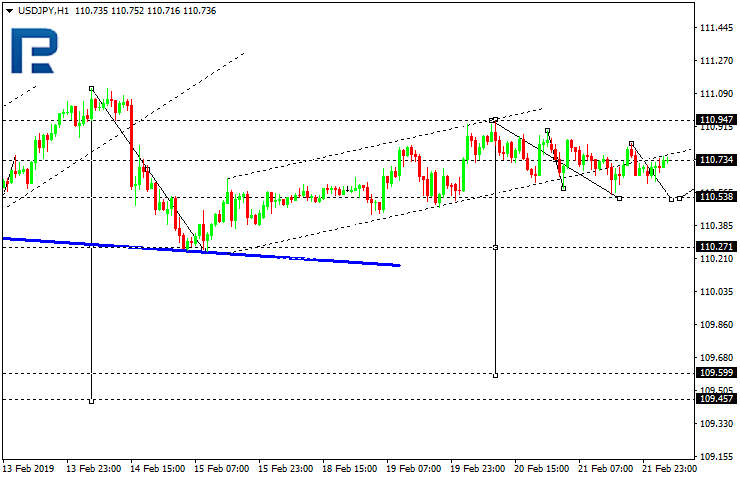
USDJPY, “US Dollar vs Japanese Yen”
USDJPY is forming another descending structure with the target at 110.53. Later, the market may resume trading upwards to reach 110.73 and then start a new decline to break 110.53. After that, the instrument may continue moving downwards with the short-term target at 110.27.
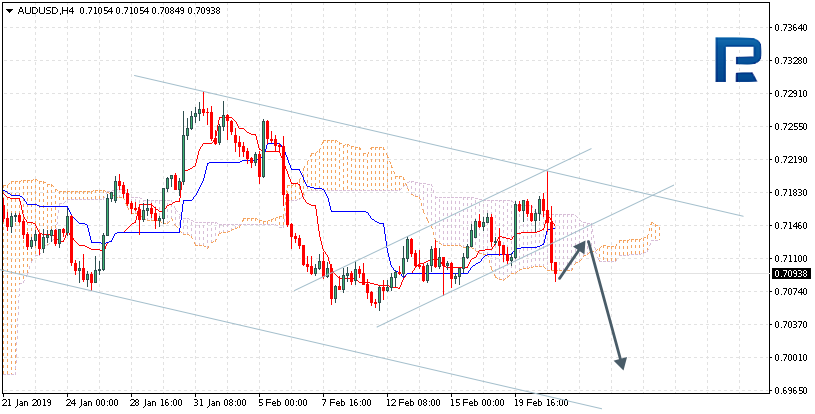
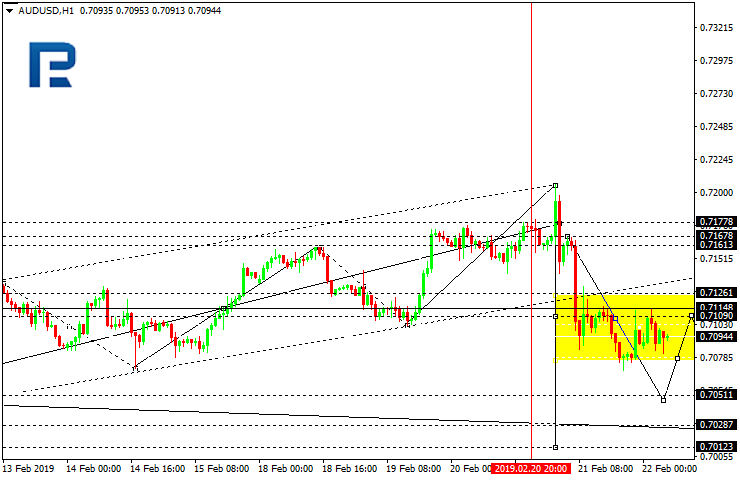
AUDUSD, “Australian Dollar vs US Dollar”
AUDUSD is forming the descending impulse towards 0.7051. After that, the instrument may move upwards with the target at 0.7109 and then resume trading inside the downtrend to reach 0.7030.
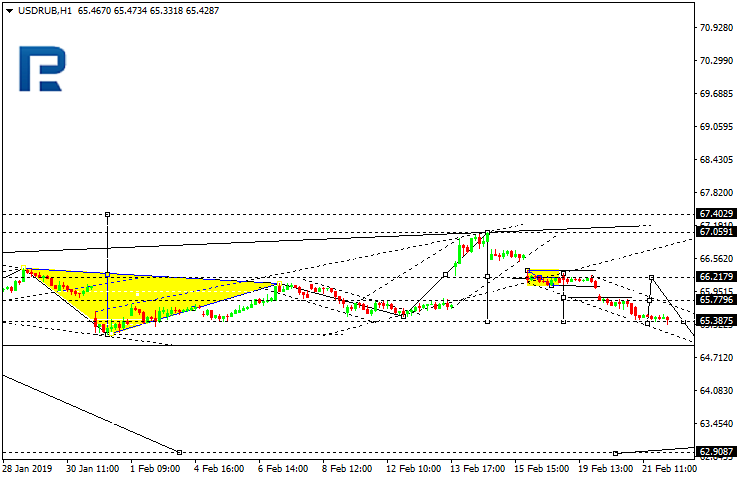
USDRUB, “US Dollar vs Russian Ruble”
USDRUB is consolidating above 65.38. According to the main scenario, the pair may fall to reach the target at 64.50. An alternative scenario implies that the price may be corrected towards 66.20 first and then resume falling with the above-mentioned target.
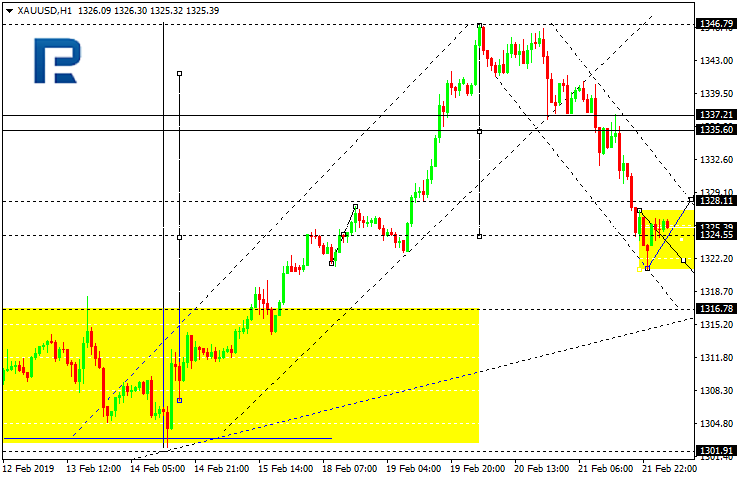
XAUUSD, “Gold vs US Dollar”
Gold has returned to 1324.50; right now, it is consolidating. Possibly, the pair may form one more descending structure to reach 1316.80. If the price breaks 1328.00 upwards, the instrument may start a new correction with the target at 1335.50.
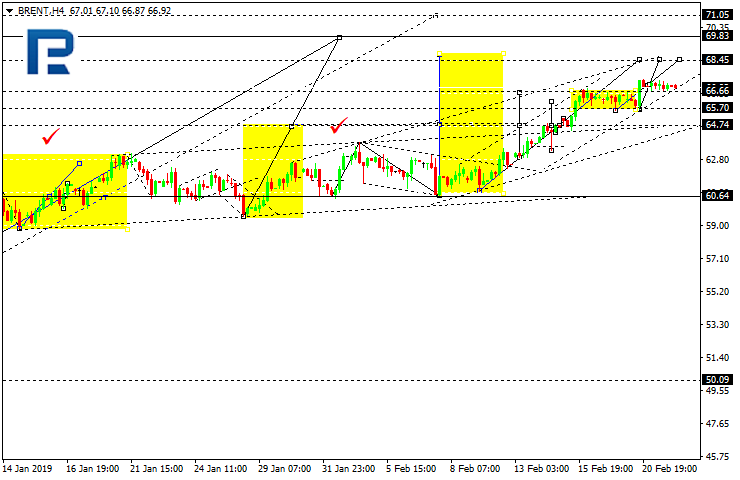
BRENT
Brent is consolidating above 66.66. According to the main scenario, the pair may continue growing with the target at 68.45. However, if the price continues falling and breaks 65.70, the instrument may be corrected towards 60.65.
Article By RoboForex.com
Attention!
Forecasts presented in this section only reflect the author’s private opinion and should not be considered as guidance for trading. RoboForex LP bears no responsibility for trading results based on trading recommendations described in these analytical reviews.