The Forex market has been really quiet over the past few days. Of course there are some instruments where we can find strong and significant movements, but the vast majority of currency pairs are in a short-term sideways trend. In our current environment, one of the best setups can be found on the EURGBP pair. When we analysed this pair two weeks ago, we said this:
“If you want to play it safe and you are not totally convinced by the sell signal, you can wait for a breakout of the light blue horizontal support first. As for a target, we can look towards the green line around 0.863, i.e. the lows from January.”
Those who played it safe, i.e. the more patient traders, got it right. Immediately after those words were written, the price went a bit higher, but eventually broke the blue horizontal support and continued downwards. That breakout from the 19th of February was indeed a proper sell signal. If you missed that drop from Tuesday, EURGBP provided another opportunity on Friday to jump into this trade by forming a shooting star candlestick. That candlestick has a long wick, which was meant to test the blue line as the closest resistance. The shooting star gives us confirmation of the bearish sentiment here and is a direct signal to go short.
The sell signal is ON as long as we stay below the blue line. As for the target, yes, it remains the same as in our previous piece; the lows from January, but I think that we can go even lower.
The Australian Dollar is trading a little bit upwards against the USD early in the week. The Aussie is slowly recovering after quite significant losses before.
Last week, the Chinese customs service in Dàlián imposed restrictions on the import of Australian coil and announced its intentions to significantly limit the total import of coil that comes from Australia until the end of 2019. The scope of limitations is about 12M tons. Apart from this, it became known about possible delays of the customs processing of coil from Australia, which now might take up to 40 days.
From the fundamental pint of view, this news is awful for Australia and the Aussie, because it adds even more complications to the current political tensions between China and Australia. China has always been the key trade and economic partner for the Green continent and any deteriorations in their relations are a real time bomb.
The point is that earlier Australia rejected an offer from China, which implied an acquisition of a large Australian company by its partners from China. Another thing is that even before that, in August 2018, Australia stopped buying equipment for 5G mobile networks produced by Huawei and ZTE, because it believed that it was unsafe from the point of view of global security in the country. China responded to this in its usual way, which was really good: it started an investigation into Australian barley suspecting dumping schemes and then turned to coil.
In fact, that’s just the tip of the iceberg. The imported Australian coil covers only some part of the Chinese needs for it. No matter how important China is for Australia, the import of coil to China was only 22% of the total number last year. So, one can say that there is some kind of conflict between these two countries, but not very serious. So far.
In the H4 chart, AUDUSD is forming a rising impulse, but the pair is trading inside the descending channel so far. The closest upside target is at 0.7212, which is a bit below the resistance level of the mid-term channel. After reaching this area, the instrument will have to decide on what to do next: either break it and continue growing towards the projected resistance lien at 0.7355, or test the area, rebound from it, and resume falling towards the support level at 0.7077 or even 0.6977.
Disclaimer
Any predictions contained herein are based on the authors’ particular opinion. This analysis shall not be treated as trading advice. RoboForex shall not be held liable for the results of the trades arising from relying upon trading recommendations and reviews contained herein.
EURUSD is consolidating around 1.1335; it seems like the price is forming the Triangle pattern. Possibly, today the pair may fall to break 1.1330 and then continue trading inside the downtrend with the first target at 1.1300.
GBPUSD, “Great Britain Pound vs US Dollar”
GBPUSD has finished two descending impulses. Today, the pair may form the third one with the target at 1.2952. After that, the pair may start a new growth to reach 1.3030 and then resume falling with the short-term target at 1.2800.
USDCHF, “US Dollar vs Swiss Franc”
USDCHF has failed to fix above 1.0022; right now, it is trading downwards. Possibly, the pair may reach 0.9980 and then start another growth towards 1.0022, thus forming a new consolidation range between these levels.
USDJPY, “US Dollar vs Japanese Yen”
USDJPY is moving downwards. Possibly, the pair may reach 110.34 and then form a new ascending structure towards 110.62. Later, the market may resume falling with the target at 110.30.
AUDUSD, “Australian Dollar vs US Dollar”
AUDUSD has completed the descending impulse towards 0.7067 along with the correction at 1.7160. Possibly, today the pair may form one more descending structure to reach 0.7030 and then resume trading upwards with the target at 0.7111.
USDRUB, “US Dollar vs Russian Ruble”
USDRUB is consolidating above 65.30. According to the main scenario, the pair may fall to reach the target at 64.50. An alternative scenario implies that the price may be corrected towards 66.20 first and then resume falling with the above-mentioned target.
XAUUSD, “Gold vs US Dollar”
Gold is growing towards 1333.65. Today, the pair may reach this level; and then resume falling to break 1321.00. After that, the instrument may continue moving downwards with the short-term target at 1310.85.
BRENT
Brent is consolidating above 66.66. According to the main scenario, the pair may continue growing to break 67.77. The target is at 70.00. However, if the price continues falling and breaks 65.65, the instrument may start a new correction with the first target at 63.55.
Attention! Forecasts presented in this section only reflect the author’s private opinion and should not be considered as guidance for trading. RoboForex LP bears no responsibility for trading results based on trading recommendations described in these analytical reviews.
As we can see in the H4 chart, the divergence made XAUUSD reverse and start a new descending tendency. The downside targets are the retracements of 23.6%, 38.2%, 50.0%, and 61.8% at 1311.23, 1289.33, 1271.39, and 1253.75 respectively. The resistance level is the current high at 1346.68. If the price breaks it, the correction may continue towards 1375.15.
In the H1 chart, the pair is forming a short-term correction upwards. After that, the price may resume falling to reach retracement of 23.6% at 1311.23.
USDCHF, “US Dollar vs Swiss Franc”
As we can see in the H4 chart, after finishing a quick ascending impulse, the divergence made USDCHF start a new decline, which has stopped at the retracement of 38.2%. The next downside targets are the retracements of 50.0% and 61.8% at 0.9933 and 0.9881 respectively. The resistance level is the high at 1.0149.
In the H1 chart, the convergence made the pair start a new pullback, which has already reached the retracement of 38.2%. If the price breaks the low at 0.9981, the downtrend may continue towards the retracement of 50.0% at 0.9933.
Attention! Forecasts presented in this section only reflect the author’s private opinion and should not be considered as guidance for trading. RoboForex LP bears no responsibility for trading results based on trading recommendations described in these analytical reviews.
EUR keeps trading in a long flat. The market participants are waiting for addtional drivers. The negotiations between the Washington and Beijing remain in the spotlight. On Sunday, Donald Trump claimed that he is ready postpote the increase of the fee on Chinese wares after productive negotiations. Keep and eye on the subject and open positions from the key levels of 1.13400 and 1.13650.
The Economic News Feed for 25.02.2019 is calm.
The indicators do not provide precise signals, the price is consolidating next to 50 MA and 200 MA, which act as dynamic support and resistance levels.
The MACD histogram is in the positive zone, which gives a weak signal to buy EUR/USD
The Stochastic Oscillator is in the neutral zone, the %K line is crossing the %D line. There are no signals at the moment.
Trading recommendations
Support levels: 1.13400, 1.13200, 1.13000
Resistance levels: 1.13650, 1.14000
If the price fixes at the 1.13650 level. expect the quotes to grow toward the round 1.14000.
Alternatively, the quotes can descend toward 1.13200-1.13000.
The GBP/USD currency pair
Technical indicators of the currency pair:
Prev Open: 1.30251
Open: 1.30704
% chg. over the last day: +0.11
Day’s range: 1.30439 – 1.30991
52 wk range: 1.2438 – 1.4378
GBP/USD remains ambiguous. There is no defined trend, the investors are closely watching the Brexit situation. The British government reviews different options to postpone the separation, should Theresa May fail to reach an aggreement until March 12. The GBP/USD quotes are testing the 1.31000. 1.30400 acts as the key support. You should open positions from these levels.
Keep an eye on the statements by the Head of the Bank of England.
The price fixed above 50 MA and 200 MA which points to the power of the buyers.
The MACD histogram is in the positive zone and keeps rising, which points to the bullish mood.
The Stochastic Oscillator is near the overbought zone, the %K line is crossing the %D line. There are no signals at the moment.
Trading recommendations
Support levels: 1.30400, 1.29800, 1.29400
Resistance levels: 1.31000, 1.31500
If the price fixes above the round 1.31000, expect the quotes to grow toward 1.31400-1.31600.
Alternatively, GBP/USD can correct toward 1.30200-1.29800.
The USD/CAD currency pair
Technical indicators of the currency pair:
Prev Open: 1.32252
Open: 1.31342
% chg. over the last day: -0.72
Day’s range: 1.31216 – 1.31455
52 wk range: 1.2248 – 1.3664
USD/CAD started to descend. The demand for the commodity currencies grew due to the progress in the US/China negotiations. On Friday, February 22, CAD strengthened against the USD by 100 points and updated the key extremums. The quotes are testing the key support of 1.31250 with 1.31600 acting as the mirror resistance. The quotes have prospects for further descend, you should open positions from the key levels.
The Economic News Feed for 25.02.2019 is calm.
The indicators point to the power of the buyers: the price fixed above 50 MA and 200 MA.
The MACD histogram is in the negative zone but above the signal line, which gives a weak signal to sell USD/CAD.
The Stochastic Oscillator is in the neutral zone, the %K line is below the %D line which points to the bearish mood.
Trading recommendations
Support levels: 1.31250, 1.30750
Resistance levels: 1.31600, 1.32000, 1.32400
If the price fixes below the local support of 1.31250, expect the quotes to fall toward 1.30800-1.30600.
Alternatively, the quotes can grow toward 1.31800-1.32000.
The USD/JPY currency pair
Technical indicators of the currency pair:
Prev Open: 110.689
Open: 110.650
% chg. over the last day: -0.01
Day’s range: 110.577 – 110.861
52 wk range: 104.56 – 114.56
USD/JPY keeps moving in a flat. The technical picture is ambiguous. The financial market participants are waiting for additional drivers. The quotes are testing the support and resistance levels of 110.600 and 110.850 and have a tendency to descend. Keep an eye on the US Treasury bonds yield and open positions from the key levels.
The Economic News Feed for 25.02.2019 is calm.
The indicators provide no signals, the price has crossed over 50 MA and 200 MA.
The MACD histogram is in the negative zone, which points to the bullish mood.
The Stochastic Oscillator is in the neutral zone, the %K line is above the %D line which gives a signal to buy USD/JPY.
Trading recommendations
Support levels: 110.600, 110.450, 110.250
Resistance levels: 110.850, 111.100, 111.500
If the price fixes below 110.600, expect the quotes to move toward 110.400-110.250.
Alternatively, the quotes can correct toward 111.100-111.400.
Welcome to Part IV of our multi-part research post delving into the global markets, global opportunities and the current “revaluation” even that is taking place. We started this quest from a simple question, “are the Doomsayers correct in their analysis that the US and global markets would collapse in a spectacular form in the near future?”. We wanted to dig into this in more detail to prove they were right or to prove our analysis was correct and the markets are simply “re-balancing” in the process of developing greater opportunity.
So far, we’ve covered topics related to globalization, central banks, global GDP and capital asset deployment forms. We’ve highlighted how the transition from regional economies into global inter-connected economies is now nearly complete and we’ve highlighted how we believe a collapse event could only take place if the largest global economies were to experience some type of massive crisis event. Unless these types of massive crisis events unfold, the most likely outcome is what we have been proposing all along – a re-balancing/revaluation event cycle that is preparing current market valuations for a momentum breakout rally in the future.
Let’s continue our research.
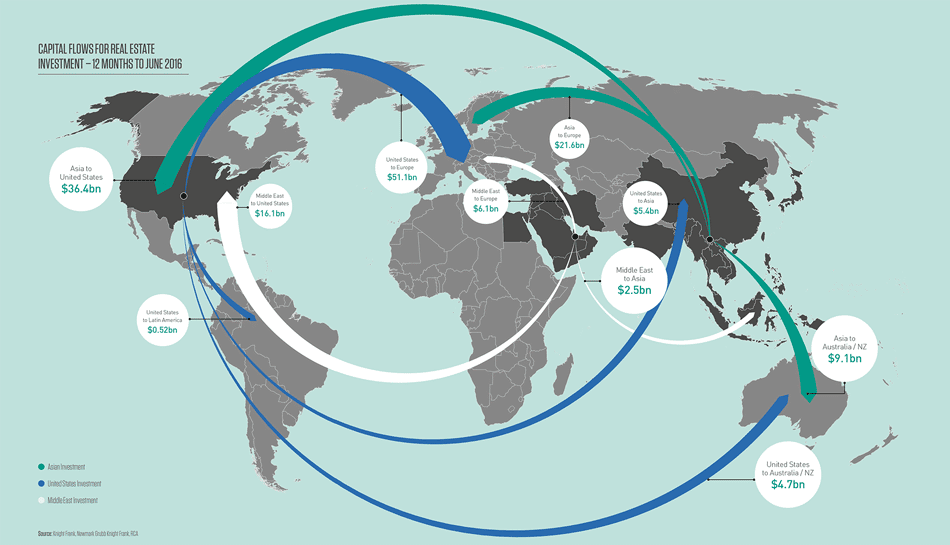
The chart, below, highlights just how critical global capital flow is in today’s world. Imagine, back in the 1950s and 1960s – the process of money flowing around the planet in an instant for investment purposes and global central bankers being able to capitalize on various global economies was very difficult to achieve. Now, with the speed of fiber-optics, these transactions can be completed in seconds and traders/investors can move capital across the planet multiple times throughout a single 24-hour span of time.
In our opinion, the reason the September 11, 2001 market crisis and the 2009~2014 market crisis events were so catastrophic and REAL was because they targeted the US economy (the biggest economy on the planet and the leader of growth throughout the planet) as well as the extended credit, debt and derivatives markets that were formed as the total globalization process expanded. When this “froth” began to implode, the underlying value of the assets supporting this “frothy fringe investment” imploded at dramatic rates.
The current issues that should concern investors are China and Europe. We believe a re-balancing of capital and expectations are currently taking place within these regions that could result in a “de-frothing” process in the near future. We would like it to be orderly and structured, but we don’t always get what we want – right? This process of revaluing the future expectations and opportunities within these global markets could create some issues for fringe elements as well (Russia, SE Asia, South America and Africa). Remember, many of these nations are operating on a “capital high” right now after seeing many decades of “easy money” and extreme growth. This is the reason for being cautiously optimistic. We have not completely transitioned into the “total global growth mode” yet.
The one thing that we believe is taking place at the moment is the positioning of capital in preparation for the final revaluation event. Capital is currently shifting towards safer and more secure global markets in preparation for this last revaluation event cycle. Our interpretation of this event is that a shakeup of banking/finance institutions as well as larger scale infrastructure projects (Belt Road) and economic coalitions (EU) will result in a more solid and rooted opportunity to build upon success for our future.
A “de-frothing” economic event will likely continue throughout the next 2~5+ years where localized markets will attempt to eliminate the “at risk” top and bottom end players. Think of this as a process of re-establishing core values and core opportunities. In an ecosystem, living organisms operate in two separate modes: survival and expansion. When the environment is hostile and difficult, the organism falls into “survival mode”. This is where froth and at-risk elements are terminated because the important aspect for the organism is “to survive the environment”. If the environment improves and becomes more “friendly and supportive”, then the organism will transition into “expansion mode” where it will try to grow, expand and “flower”. This is where the organism becomes very healthy and is able to begin taking on new risk/froth elements.
Currently, we believe the global economy is nearing the end of the de-frothing/revaluation phase and will begin to establish new growth footing over the next 2~5+ years. Our hypothesis is that the 2009~2014 Global Credit Market crisis started a massive global de-frothing process that is currently working through the global markets. Intentional or unintentional, we don’t know. But we do understand that the process of “survival or expansion” is key to the long term economic events that continue to work through the global markets. Let’s look over some charts.
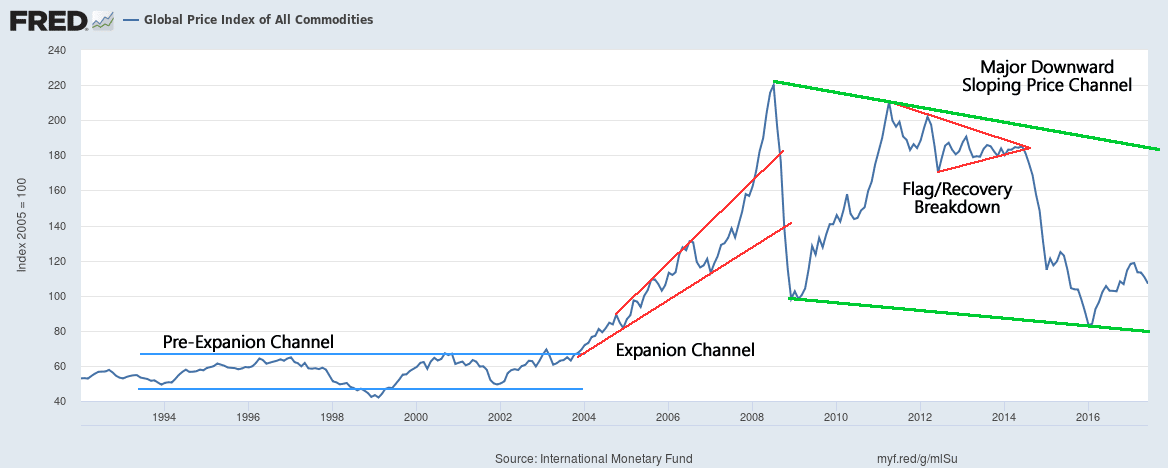
One element typically happens near the early/middle stage of economic expansion is a Commodities price increase. Looking at the larger picture of the global price of all commodities, we can see that an expansion channel existed between 2004 and the peak near 2008 and, since then, global commodities have been within a Major Downward sloping price channel. It is our opinion that global commodities will stay near the lower range of this price channel as the revaluation/re-balancing phase continues. Eventually, global commodities will likely attempt to setup a Flag/Pennant formation before attempting a true price advance after the froth/risk has been sufficiently eliminated from the global markets.
Additionally, this chart showing total international debt securities of all countries clearly shows WHEN the global markets entered the revaluation/re-balancing phase. It all started with the 2009~2014 global credit market crisis – not with the September 11, 2001, terrorist attacks. This information supports the process that the global economy was much healthier in 2001 as a result of the expanded opportunities supported by the new Internet/technology boom. The crisis event in 2001 was dangerous as it could have resulted in a global economic contraction, yet it appears the expansion in commodities prices and the continuous expansion of debt was unabated.
The 2009~2014 global credit crisis event was a completely different story for the markets. This event consisted of a core element implosion that touched nearly every corner of the planet and started a “de-risking” event that is still taking place. True economic expansion will not begin until this event is completed. The process of revaluing the markets is currently taking place and a true “capital shift” is still underway where capital is being deployed in the safest and most secure markets on the planet in order to secure proper ROI as well as seeking “speculative ROI” from undervalued international markets.
We continue to expect debt consolidation to continue throughout most of the established world. The single purpose of this Revaluation event is to find and secure proper valuation levels for the entire global market before true expansion can begin. We’ve already experienced a massive revaluation process across most of the planet and the only thing left to complete are the proper valuation levels of the most frothy and unhinged global markets on the planet.
This process may not be pretty at times, but it certainly will provide skilled traders and investors with incredible opportunities for profits. You won’t want to miss these moves over the next 3~5+ years.
Don’t miss Part V of this incredible research post as we’ll show you exactly what to expect over the next 24~30+ months in the US markets and who you why skilled and professional research, like this, is key to understanding where opportunity really exists in these markets.
If you want to learn how our proprietary price modeling systems, a dedicated research team, daily videos, and more resources will help you find and execute better trades, then please visit TheTechnicalTraders.com to learn how we can assist you. If you want to know how and when we are trading these markets to help our members, then consider becoming a member and enjoying all the benefits we offer our subscribers. This is going to be an incredible year for skilled traders. Isn’t it time you invested in something that can really help you develop greater success?
On Friday, the US dollar fell slightly against a basket of major currencies, as demand for risky assets increased. Investors continue to monitor the negotiations between the US and China closely. So far, negotiations are succeeding. President Donald Trump said on Sunday that he would postpone tariff increases for Chinese goods in the US. This week, the leaders of the two countries will hold a summit at which a deal can be signed. On Friday, the dollar index (#DX) closed the trading session with a slight decrease (-0.10%).
Investors are also focused on Brexit. It became known that if the parliamentarians did not approve the agreement on the British exit from the EU before March 12, the Brexit process could be postponed.
On Friday, important economic reports from the Eurozone were published. The German IFO business climate index fell to 98.5 and was worse than the expected 99.0. The Eurozone consumer price index counted to 1.4% (y/y) in January, as experts forecasted. Statistics Canada published weak retail sales data for December: the core retail sales index fell by 0.5%; the volume of retail sales in the country decreased by 0.1%.
Market Indicators
On Friday, the bullish sentiment was observed in the US stock market: #SPY (+0.62%), #DIA (+0.63%), #QQQ (+0.74%).
The 10-year US government bonds yield is at 2.65-2.66%.
The news feed on 25.02.2019:
Today, the publication of important economic news is not expected. We recommend paying attention to the speech by the Bank of England Governor Carney.
On Friday the 22nd of February, trading on the single currency against the US dollar showed mixed dynamics. By the end of the European session, the pair had recovered to 1.1356. In the US session, the pair slumped to 1.1317.
A drop in US bond yields exerted pressure on the dollar. This decline may have been brought about by the Fed’s report on economic growth in 2018 submitted to Congress. Growth in 2018 was estimated to be slightly below 3%, which has caused concern among investors.
Day’s news (GMT+3):
13:00 UK: BoE Governor Mark Carney’s speech.
Current situation:
At the time of writing, the euro is trading at 1.1345. The situation hasn’t changed much over the last couple of weeks. The pair remains in a sideways trend, with the upper boundary expanding slightly to 1.1371. Volatility has subsided over the last 3 days, with the pair not even reaching the 45th degree. It’s currently trading around the balance line within a downwards channel.
In my forecast, I expect the pair to test the 45th degree (1.1313) from a high of 1.1366. Judging by the indicators on the H1 and H4 timeframes, there is still potential for growth, but for today, I’m going to go by the hourly cycles, which suggest that the pair will start a substantial upwards movement during the US session on the 26th of February.
Buyers have recovered Friday’s losses. Judging by trading volumes, we can surmise that there is an ongoing accumulation of long positions. If we’re going to get an upwards surge, we should, in theory, first revisit recent lows. As the stop levels of the smaller players get triggered, the limit orders of the bigger players will kick in. The big players need to exploit the smaller ones in order to enter more lucrative long positons.
The USD 2018 rally was always unlikely to continue to into 2019. However, the release of the January Fed Minutes suggests that USD’s likely ‘moderation’ in 2019 may actually turn more bearish move.
The Fed has clearly been spooked by the market, the movements in the bond market in particular has moved the dial. Then there are the ‘risks’ in the US economy which are pointing to slowing growth. All this is has seen the Board move almost 180 in its views on the Fed Funds rate and its view on GDP.
However, what has become clear from a currency perspective is possible actions that this 180 might cause the Fed to do 2019.
Here are the four key points from the January FOMC meeting that are USD sensitive:
Most member stated growth as ‘solid’ down from the ‘strong’ and expect growth to “step down somewhat” due to: softer sentiment, a weaker global outlook, and ‘materially tighter financial conditions’. This final point has been a clear trigger for the market to starting to discount rises in the Federal Funds rate.
Inflation ‘remained near 2 percent’ however the Minutes note members discussed recent “softness” in inflation is now persisting, and the ‘hoped’ upward inflation is not ‘more muted’. The Minutes also note that market-based measures of inflation had lowered in recent months, yet survey-based measures of inflation expectations were ‘little changed’. This is the Fed mandate that has realistically never been meet and again feeds into why the Federal Funds rate is likely to remain on hold for 2019.
Most members agreed with replacing its hiking bias communication with a ‘patient and flexible approach’. Again, the reasoning: tighter financial conditions, softer inflation, slower foreign growth, and trade policy uncertainty as justifying a patient approach to policy. But what did differ was the adjustment to the Federal Funds rate in the back end of the year ‘several’ members stated increases were necessary ‘only if’ inflation was higher than in their ‘baseline’ (aka 2%) while ‘several’ others indicated that hikes would be appropriate if the economy evolved as they expected. Suggesting that we now have a split on the board around rate rises. The baseline however is rates are on hold with a slight hike bias – a mild USD positive.
The balance sheet: this was the most interesting part of the statement, almost all Board members thought it would be necessary to announce that the FOMC will stop reducing the Fed’s balance sheet sometime in the back-end of this year. The balance sheet topped out at US$4.5 trillion its likely to be US$4 trillion in size come June. This is substantially bigger than forecast and ‘enormous’ when compared to the balance sheet pre – GFC. The suggestion from members was that Quantitative Tightening (QT) might be influencing financial markets, and thus policy needs to be ‘flexible in principle’. The end of QT at a much higher level than forecasted suggests market ‘support’ is not out of the question – USD dampener.
Based on all of this, one would expect the Fed to announce these ‘changes’ to policy in the upcoming March meeting. This would put a weight into USD G10 pairs – pencil this event into the diary now.
Welcome back, If you’ve missed any part of this multi-part research post, please visit www.TheTechnicalTraders.com/FreeResearch/ to review and read our previous posts. This, Part III, of our multi-part research post where we are attempting to rationalize the continued bearish analysis of some other analysts as well as review some key data that may support our interpretation that the global markets are transitioning through a “revaluation phase” right now – headed for a breakout rally eventually will continue with more detailed information. Our premise is that global investors and traders should stay cautiously optimistic at the moment and prepare for some volatility as this “revaluation phase” continues to play out. Our overall analysis suggests that the US Federal Reserve and global central banks have “primes the cylinders” of the global economic engine sufficiently and that a spark is all that is needed to see massive new valuation and GDP increases within the next 10~20+ years.
Within the previous sections of this article, we’ve discussed how Globalization has expanded and normalized the global economic activities over the past 50+ years. We’ve also discussed how this process of globalization has created a series of crisis events as localized central banks are now dealing with total globalization and the new risks that are associated with this transition. Our position is that the economies of the planet are now more interconnected than ever before and, thus, the concept of a massive collapse event is less likely than ever before. The only way a massive collapse event could take place, in our opinion, would be a global war between super-economies or a total collapse of multiple super-economies because of some catalyst event. Otherwise, we believe the proper thinking is that of a “revaluation phase” not a “collapse event”.
Let’s dig further into the data and continue our research.
In the past, we’ve suggested that capital operates like a living organism, always in search of the healthiest environment to reside within and always attempting to identify and mitigate risk factors where they reside. In other words, global capital is always seeking out the best, safest and most secure (immune from risk) returns possible at all times. The recent globalization process creates a unique environment where capital can “transition” from one global market to another in an instant. Risks can be identified and mitigated within minutes, hours or days now where, in the past, these risks could have been catastrophic in nature.
Within this new “instant” environment for capital and global markets, new risks persist. Because huge amounts of capital can now move freely across global platforms and economies, volatility is likely to continue at 2x to 5x historical norms. This also means that catastrophic regional economic events will likely result in more severe price rotation and speculation. The end result is that capital is now flowing across the planet more efficiently than ever before and this creates a whole new playing field for investors and traders.
Consider the Global Gross Capital Flows below and pay very close attention to the change in how capital moved and was deployed prior to 2008 and on/after 2008. If you read this chart as our research team sees it, we have entered a period (from 2000 onward) where massive amounts of capital have been dumped into the global markets. Much of this capital has been deployed into infrastructure and supporting global banking and credit markets over the past 18+ years. Yet a very large portion of this capital has yet to become fully activated in the global markets and this can clearly be seen by the reduced GDP output on this graph. 2015 Global GDP levels have dramatically changed and are very near pre-2001 levels in scale.
As readers of this article, the point we are trying to make is that “the guns are primed, loaded, aimed and ready for BUSINESS”. The collapse of global GDP, which is clearly evident in the past few graphs we’ve presented, began to become clearly evident in 2014~2015. An interesting facet of this contraction was that China instituted new Capital Outflow laws to attempt to prevent investment capital from rushing out of local Chinese markets at this same time. The purpose of this was a protectionary move by China attempting to support their local credit markets and internal banking markets. Unlike other global markets, China could not risk having large amounts of capital rush overseas (depleting repayment capabilities and local coffers) while continuing to build and pump up their credit/lending markets. They had not considered the risks that Chinese investors/Entrepreneurs would take large components of their new wealth and aggressively move it outside the Chinese market. Shortly after that, came the 2016 US presidential elections – which always present some level of rotation/contraction within the markets.
As we move forward with this data and the key question we posed at the very beginning; are the Doomsayers right? Do you believe the markets will collapse in the immediate future or do you believe the global markets are poised and primed for another massive price advance because of the massive influx of capital that has recently been dumped into the markets?
Let’s try to answer some of these questions by presenting clear data in regard to how the global markets have changed over the past 90+ years. The GDP data below shows how different nations have rallied GDP output over the past 90+ years and how the dynamics of the global markets are taking root. Remember the data we’ve presented earlier when you review these GDP graphs, below. Remember that from 1970 till now, the US Federal Reserve and global central banks have poured over $40 Trillion US Dollars into the global markets and this capital is working through the banking system and economies in an attempt to solidify growth/return opportunities.
If we were to total the GDP of the Top 5 economies on the planet for each of these graphs, the numbers would like something like this :
__ 1930: $2.87 Trillion Annually
__ 1980: $14.16 Trillion Annually
__ 2010: $43.84 Trillion Annually
__ 2015: $53.82 Trillion Annually
As we’ve seen from the previous data, the creation of capital by the central banks take a bit of time to settle into the global economies to begin producing real GDP advancements. Additionally, we believe the 2009~2014 global credit market crisis was one of the biggest crisis events to “re-sync” the global markets in decades. This event was similar to the 1929 US stock market crash in combination with the wars of the 1930s and early 1940s rolled all into one. The primary difference between now and then is the fact that global economies are now very inter-connected and what took many decades in the past now takes only a few short years to recover.
What should we expect in the future and why are we cautiously optimistic about the next 2~5+ years, keep reading our next segment to find out. We’ve covered almost all of the key data points that highlight what has transitioned in the past 40~50+ years. Next, we’ll highlight why we are very optimistic that 2019 and 2020 will be incredible years for skilled traders and investors and we’ll show you what to expect from the US markets going all the way into 2021.
Isn’t it time you considered joining a group of professional traders, researchers, and friends to help you find and execute greater success in the future? Then visit www.TheTechnicalTraders.com to learn how we can help you find and execute better trades. Take a look at some of our recent winners to see how we help people, just like you, create success. We believe 2019 and 2020 will be incredible years for skilled traders and we are executing at the highest level we can to assist our members. In fact, we are about to launch our newest technology solution to better assist our members in creating future success. Isn’t it time you invested in your future success by joining a team of professionals dedicated to giving you an advantage in the markets every day?