Author Archive for InvestMacro – Page 278

Ichimoku Cloud Analysis 26.02.2019 (AUDUSD, NZDUSD, USDCAD)

Article By RoboForex.com

AUDUSD, “Australian Dollar vs US Dollar”

AUDUSD is trading at 0.7154; the instrument is moving above Ichimoku Cloud, thus indicating an ascending tendency. The markets could indicate that the price may test the upside border of the cloud at 0.7145 and then resume moving upwards to reach 0.7265. Another signal to confirm further ascending movement is the price’s rebounding from the channel’s downside border. However, the scenario that implies further growth may be cancelled if the price breaks the downside border of the cloud and fixes below 0.7100. In this case, the pair may continue falling towards 0.7005. After breaking the channel’s upside border and fixing above 0.7195, the price may continue moving upwards.

AUDUSD
Risk Warning: the result of previous trading operations do not guarantee the same results in the future

NZDUSD, “New Zealand Dollar vs US Dollar”

NZDUSD is trading at 0.6880; the instrument is moving above Ichimoku Cloud, thus indicating an ascending tendency. The markets could indicate that the price may test the upside border of the cloud at 0.6845 and then resume moving upwards to reach 0.6995. Another signal to confirm further ascending movement is the price’s rebounding from the support level. However, the scenario that implies further growth may be cancelled if the price breaks the downside border of the cloud and fixes below 0.6785. In this case, the pair may continue falling towards 0.6685.

NZDUSD
Risk Warning: the result of previous trading operations do not guarantee the same results in the future

USDCAD, “US Dollar vs Canadian Dollar”

USDCAD is trading at 1.3196; the instrument is moving below Ichimoku Cloud, thus indicating a descending tendency. The markets could indicate that the price may test the downside border of the cloud at 1.3210 and then resume moving downwards to reach 1.3055. Another signal to confirm further descending movement is the price’s rebounding from the resistance level. However, the scenario that implies further decline may be cancelled if the price breaks the upside border of the cloud and fixes above 1.3245. In this case, the pair may continue growing towards 1.3335.

USDCAD
Risk Warning: the result of previous trading operations do not guarantee the same results in the future

Article By RoboForex.com

Attention!
Forecasts presented in this section only reflect the author’s private opinion and should not be considered as guidance for trading. RoboForex LP bears no responsibility for trading results based on trading recommendations described in these analytical reviews.

A Postcard from Malaysia

By Dan Steinbock

Not so long ago, Malaysia was set to lose years of economic progress. Today, following the re-imposition of economic discipline, the country is almost back on track.

A new era dawned in Malaysia in May 2018, when the opposition coalition led by Dr. Mahathir Mohamad and Anwar Ibrahim secured a simple majority in a historical election. When Mahathir will return to retirement, opposition leader Anwar is expected to replace him in about two years.

In the 2018 election, their coalition – Pakatan Harapan (PH) – won 113 seats against the ruling coalition (United Malays National Organization, UMNO and its allies) that had not lost an election since 1957.

Last year, Malaysia’s economy grew 4.7% year-on-year. Despite fiscal consolidation and challenging international conditions, the country is set to sustain its growth path in 2019. It is an extraordinary achievement after years of political turmoil.

The Najib regression

As the sixth Prime Minister of Malaysia, Najib Razak ruled the country from 2009 to 2018. His early tenure was marked by economic liberalization measures, including cuts to government subsidies, loosening of foreign investment restrictions, and reductions in preferential measures for ethnic Malays in business.

After the 2013 election, the neoliberal economic policies gave way to greater efforts at political consolidation, including the pursuit of critics on sedition charges, the imprisonment of opposition leader Anwar Ibrahim, the implementation of a consumption tax (GST), and the embarrassing scandal involving state investment firm 1Malaysia Development Berhad (1MDB).

That’s when Malaysia lost its economic discipline. The changing fortunes can be illustrated by the fluctuations of Malaysian ringgit. Between 2009 and 2013, US dollar was still about 3-3.60 MYR. As economic prospects weakened, so did the ringgit. Between 2013 and 2018, US dollar amounted to 4.40 MYR (Figure).

Figure       Malaysian Ringgit, 2009-2019

Eventually, the massive 1MDB corruption debacle led to rallies calling for Najib’s resignation, spearheaded by the grassroots movement Bersih. Following his release in 2004, Anwar Ibrahim became the leading figure in the opposition and helped coalesce the opposition parties into the Pakatan Rakyat, which contested the 2008 and 2013 general elections.

These protests culminated in the Malaysian Citizens’ Declaration by Mahathir, the rise of Pakatan Harapan and NGOs to oust Najib. The 2018 election triumph paved the way to Mahathir to become the world’s oldest elected leader at 93. He said his coalition would not seek revenge but would “restore the rule of law”.

Recently, Anwar Ibrahim seconded those views. He said Malaysia “will not compromise” in its talks with Goldman Sachs over the 1MDB corruption scandal, and the bank “must bear responsibility.” The nation has a responsibility to uncover any crimes the investment bank may have committed.

Fiscal consolidation

Between 1974 and 2004, Mahathir’s Malaysia experienced a period of rapid modernization and economic growth, as his government initiated a series of bold infrastructure projects. During his reign, Malaysia was transformed into an ASEAN tiger. Politically, Mahathir was dominant, winning five consecutive general elections and fending off a series of rivals for the leadership of UMNO.

The final test came with the aftermath of the Asian financial crisis in 1998. While much of Asia succumbed to IMF-imposed austerity, Malaysia did not. Instead, Mahathir pursued a heterodox model of economic policies, including currency and capital controls, while deterring George Soros’s speculative efforts to derail the economy.

In the West, Mahathir was demonized as an authoritarian dictator who was intent on undermining his own economy. In reality, his mix of policies ultimately helped Malaysia endure a shallower GDP loss than crisis-afflicted Indonesia, South Korea, and Thailand.

Now Mahathir’s objective is fiscal consolidation to surpass the policy mistakes of the Najib years, while stabilizing a more robust growth path. It is a challenging task that must be implemented amid America’s new protectionism and U.S. tariff wars.

Moreover, Mahathir has had to suspend several multibillion-dollar projects, including China-backed initiatives, in a bid to target Malaysia’s estimated $250 billion national debt and other liabilities.

Early signs are promising. In 2019, economic growth is likely to be around 4.5%; in 2020, 4.2%. Private consumption is the key contributor as consumers have loosened their purse strings amid an improving labor market and lower consumption tax.

However, investment growth is lingering as several high-profile projects have been put on the back-burner following the new government’s fiscal rationalization.

Preparing for 2020 contingencies

As the new government’s first budget suggests, the focus is on institutional reforms, improving the standards of living, particularly for the lower income groups, as well as encouraging entrepreneurship. The fiscal deficit is projected to narrow to 3.0% of GDP by 2020; and to 2.0% in the medium-term.

It is a typical Mahathir mix: people first, good governance, self-sufficiency, but openness to international trade and investment.

Yet, there are two key risks to the fiscal target forecast. On the one hand, growth could be less than anticipated, thanks to the challenging external environment. On the other hand, revenue flows could prove more volatile than expected, given the higher dependence on oil-related revenues, which account for almost a third of total.

While the government’s expansionary efforts are limited by the ongoing fiscal consolidation, Malaysia can still rely on more accommodative monetary policy. In 2019, monetary policy is expected to be stable. As international headwinds are likely to escalate in 2020, the central bank could opt for a more dovish stance.

Until recently, neoliberal policies have often been portrayed as “natural” for post-industrializing Asia. In reality, such policies tend to boost oligarchs and shun the rule of law. Led by Dr. Mahathir Mohamad and Anwar Ibrahim, Malaysia’s political reset shows that neoliberal trajectory and corruption are not an inevitable destiny.

Malaysians deserve a better, sovereign future.

About the Author:

Dr. Dan Steinbock is the founder of Difference Group and has served at the India, China and America Institute (US), Shanghai Institute for International Studies (China) and the EU Center (Singapore). For more, see http://www.differencegroup.net/ 

Japanese Candlesticks Analysis 26.02.2019 (GOLD, NZDUSD)

Article By RoboForex.com

XAUUSD, “Gold vs US Dollar”

As we can see in the H4 chart, XAUUSD has once again broken the resistance level and formed another pullback with Shooting Star, Doji, and Hanging Man reversal patterns. Judging by the previous movements, it may be assumed that after finishing the correction the instrument may continue its ascending movement.

XAUUSD
Risk Warning: the result of previous trading operations do not guarantee the same results in the future

NZDUSD, “New Zealand vs. US Dollar”

As we can see in the H4 chart, NZDUSD has reached another resistance level; right now, it is forming Shooting Star and Harami reversal patterns. Judging by the previous movements, it may be assumed that the instrument may complete another correction and then continue its growth.

NZDUSD
Risk Warning: the result of previous trading operations do not guarantee the same results in the future

Article By RoboForex.com

Attention!
Forecasts presented in this section only reflect the author’s private opinion and should not be considered as guidance for trading. RoboForex LP bears no responsibility for trading results based on trading recommendations described in these analytical reviews.

The Analytical Overview of the Main Currency Pairs on 2019.02.26

Analytics by JustForex

The EUR/USD currency pair

Technical indicators of the currency pair:
  • Prev Open: 1.13322
  • Open: 1.13583
  • % chg. over the last day: +0.19
  • Day’s range: 1.13478 – 1.13674
  • 52 wk range: 1.1214 – 1.2557

The demand on the risky assets grew due to hopes that the US/China trading conflict will end soon. Donald Trump officially postponed the increase of fees on the Chinese wares and plans to meet with Xi Jingping to sign the trade aggreement.

The technical picture at EUR/USD remains ambiguous. EUR keeps trading in a long flat. The local support and resistance levels are 1.13400 and 1.13650. The investors are waiting for the statements by the Head of the Federal Reserve Powell about the state of the economy and the US monetary policy. You should open positions from the key levels.

The Economic News Feed for 26.02.2019:

  • – Real Estate Sales Report (US) – 15:30 (GMT+2:00);
  • – Consumer Trust Index by CB (US) – 17:00 (GMT+2:00);
  • – Statements by the Head of Federal Reserve (EU) – 17:00 (GMT+2:00);
EUR/USD

The indicators do not provide precise signals, the price is testing 50 MA which acts as a dynamic support.

The MACD histogram is in the positive zone but below the signal line, which gives a weak signal to buy EUR/USD.

The Stochastic Oscillator is in the neutral zone, the %K line is crossing the %D line. There are no signals at the moment.

Trading recommendations
  • Support levels: 1.13400, 1.13200, 1.13000
  • Resistance levels: 1.13650, 1.14000

If the price fixes above 1.13650, the currency pair will grow toward 1.14000-1.14200.

Alternatively, the quotes can fall toward 1.13200-1.13000.

The GBP/USD currency pair

Technical indicators of the currency pair:
  • Prev Open: 1.30704
  • Open: 1.31083
  • % chg. over the last day: +0.48
  • Day’s range: 1.31083 – 1.31613
  • 52 wk range: 1.2438 – 1.4378

GBP/USD finally started to grow after a long consolidation. During the last two days of trading, the pound strengthened against the USD by 80 points and almost reached the annual maximums. The demand on GBP is connected to the rumours about postponing Brexit, which is planned for March, 29. Right now GBP/USD is testing the local resistance at 1.31500 with 1.31000 acting as a mirror support. The trading instrument has prospects for further growth.

The Economic News Feed for 26.02.2019:

  • – Hearings at Bank of England regarding inflation (GB) – 12:00 (GMT+2:00);
GBP/USD

The indicators point to the power of the buyers, the price fixed above 50 MA and 200 MA.

The MACD histogram is in the positive zone and above the signal line, which gives a strong signal to buy EUR/USD.

The Stochastic Oscillator is in the neutral zone, the %K line is above the %D line which also points to the bullish mood.

Trading recommendations
  • Support levels: 1.31000, 1.30400, 1.29800
  • Resistance levels: 1.31500, 1.32000

Should the price fix above 1.31500, expect the quotes to grow toward the round 1.32000.

Alternatively, the quotes can fall toward 1.30700-1.30400.

The USD/CAD currency pair

Technical indicators of the currency pair:
  • Prev Open: 1.31342
  • Open: 1.31863
  • % chg. over the last day: +0.41
  • Day’s range: 1.31771 – 1.32170
  • 52 wk range: 1.2248 – 1.3664

USD/CAD retreated from the monthly minimums. The pressure on CAD is caused by the sudden drop in the oil quotes calua. Yesterday the WTI futures lost around 3% of their price. Right now the trading instrument is testing the local resistance at 1.32150 with 1.31850 acting as a near support. You should open positions from these levels but keep an eye on the reports from US, as well as the statements by the Head of the Federal Reserve.

The Economic News Feed for 26.02.2019 is calm.

USD/CAD

The indicators do not provide signals, the price fixed between 50 MA and 200 MA.

The MACD histogram is in the positive zone and keeps rising, which gives a strong signal to buy USD/CAD.

The Stochastic Oscillator is in the neutral zone, the %K line is below the %D line, which points to a bearish mood.

Trading recommendations
  • Support levels: 1.31850, 1.31500, 1.31150
  • Resistance levels: 1.32150, 1.32400, 1.32700

If the price fixes below 1.31850, you should look for market entry points to open short positions. TakeProfit is 1.31500-1.31300.

Alternatively, the quotes can grow further toward 1.32400-1.32700.

The USD/JPY currency pair

Technical indicators of the currency pair:
  • Prev Open: 110.650
  • Open: 111.029
  • % chg. over the last day: +0.24
  • Day’s range: 110.753 – 111.075
  • 52 wk range: 104.56 – 114.56

Since the beginning of the week, USD/JPY has been trading rather actively. There is no defined trend. Right now the safe haven currency is consolidating at 110.750-110.900 with an ambiguous technical picture. The financial market participants are waiting for the statements by the Head of the Federal Reserve. Keep and eye on the US Treasury bonds yield and open positions from the key levels.

The Economic News Feed for 26.02.2019 is calm.

USD/JPY

The indicators do not provide precise signals, the price crossed 50 MA.

The MACD histogram is close to 0.

The Stochastic Oscillator is in the neutral zone, the %K line is above the %D line, which points to a bullish mood.

Trading recommendations
  • Support levels: 110.750, 110.600, 110.450
  • Resistance levels: 110.900, 111.100, 111.200

If the price fixes below 110.750, expect the quotes to fall toward 110.500-110.300.

Alternatively, the quotes can grow toward 111.200-111.400.

Analytics by JustForex

Demand for Risky Assets Has Grown. Investors Expect the Speech by Fed Chairman

by JustForex

Demand for risky assets has resumed. The US and China are moving towards a trade agreement. Donald Trump postponed the increase in duties on Chinese imports and said that he could soon sign an agreement with Chinese President, Xi Jinping, to end the trade dispute if their countries could overcome the remaining controversies. Trump also said that the negotiators are “very, very close” to the deal. The dollar index (#DX) closed the trading session in red (-0.10%).

The political uncertainty concerning Brexit remains. The British pound has updated monthly highs after reports that Theresa May wants to postpone the Brexit, scheduled for March 29. Today, investors are focused on the speech by Fed Chairman, Jerome Powell, to the US Congress. The official will evaluate the current state of the economy and the monetary policy of the country. We also recommend paying attention to economic releases from the US.

The “black gold” prices are consolidating after a sharp collapse the day before. Yesterday, the fall in futures for the WTI crude oil exceeded 3%. Donald Trump once again criticized the activities of OPEC. At the moment, oil quotes are testing the mark of $55.35 per barrel. At 23:30 (GMT+2:00), a report on the API weekly crude oil stock will be published.

Market Indicators

Yesterday, the bullish sentiment was observed in the US stock market: #SPY (+0.14%), #DIA (+0.28%), #QQQ (+0.36%).

The 10-year US government bonds yield is at 2.65-2.66%.

The news feed on 26.02.2019:

– Inflation report hearings in the UK at 12:00 (GMT+2:00);
– Statistics on the real estate market in the US at 15:30 (GMT+2:00);
– CB consumer confidence index in the US at 17:00 (GMT+2:00);
– Speech by Fed Chairman Jerome Powell at 17:00 (GMT+2:00).

We also recommend paying attention to the speech by the UK Prime Minister Theresa May.

by JustForex

EURUSD: pair technically ready for growth

By Matthew Anthony, Alpari

Previous:

On Monday the 25th of February, trading on the EURUSD pair closed up, although there were plenty of fluctuations during the day. These were brought about by remarks from US President Donald Trump.

He increased the appetite for risk on the market with his decision to postpone increasing tariffs on Chinese imports. During the US session, oil prices dropped 4% in response to a Trump tweet saying that prices are too high and that OPEC should “relax”. This slump on oil took its toll on the USDCAD pair. The EURUSD pair continued trading within the 3-day consolidation range formed on the 20th of February.

Day’s news (GMT+3):

  • 12:30 UK: BBA mortgage approvals (Jan).
  • 13:00 UK: inflation report hearings.
  • 16:30 US: building permits (Dec), housing starts (Dec).
  • 17:00 US: housing price index (Dec).
  • 17:45 US: Fed’s Powell speech.
  • 18:00 US: Richmond Fed manufacturing index (Feb), consumer confidence.

EURUSD H1

Current situation:

The pair is trading between the 45th degrees as it remains in a sideways trend. At the time of writing, the pair is trading at 1.1348, and has reached the balance line. The market is in equilibrium on the hourly timeframe and is ready to push the rate to the U1 and D1 lines.

In my view, nothing has changed since yesterday from a technical standpoint. As such, I expect to see the bulls retreat to around 1.1315/20, where they will enter new long positions for the subsequent rally. The market is poised to break 1.1370, but it would be wise to expect the upwards wave to begin from the low from the 22nd of February. On the H4 timeframe, the LB line runs through 1.1322. As such we’ve got a strong support at around 1.1315/1.1322 on two separate timeframes.

EURJPY breaks out of the triangle, again…

By Tomasz Wisniewski, Alpari

This piece is about the EURJPY pair. We mentioned this instrument in Friday’s daily analytical report and, unsurprisingly, we were right about the direction. On the 22nd of February, we were optimistic about the future of this currency because of the symmetrical triangle and the flag. This is precisely what we said:

“EURJPY is getting ready for a bigger upswing. The positive scenario here comes from the fact that the price has broken out of the symmetrical triangle pattern. What’s more, we broke the horizontal resistance at 125.45 and then formed a bullish flag (black lines). The flag is promoting a bullish breakout and a further rise.”

EURJPY H4

We got the direction right, but the second formation turned out a bit different. Instead of a flag, EURJPY ended up forming a smaller triangle; a pennant in fact (black lines). The pennant, as expected, ended with the breakout of its upper line. The closest targets at the moment are the highs from February; slightly below 126. Once those are broken, we will receive a proper, mid-term buy signal. Chances of that are pretty nice.

Momentum Stock Trading Strategy For Optionable Stocks

By TheTechnicalTraders.com

It been a great couple weeks for members of our newsletter as we start to provide more of our
MRM – Momentum Reversal Method Stock Picks.

As technical traders, we specialize in trading price action and momentum.
We don’t follow the news or media because it has zero predictiveness in price action.

Take a look at our most recent closed trades.

CUT YOUR RESEARCH BY 97%

No matter what type of analysis you are looking for our services provides you with virtually everything you need
to protect your investments and profit from the next rally or selloff in the market.

EXPLOSIVE STOCK PICKING STRATEGY
Get our ADL and MRM strategy for identifying explosive Stock and ETF patterns.
Now you can get into plays before they move and become publicly known!

In fact, the most recent trade members got into was just introduced to the masses with
two exclusive TV shows on them and the stock rallied 23.7% in the last three days alone!

By TheTechnicalTraders.com

Cryptocurrency Trading Hacks: For Newbies & Pros Alike

By Sarah Pritzker

Cryptocurrency is the bipolar of the trading world. The volatility is insane; you’ll see major swings from 12% to 300% in a single day! With movement like this, it can be hard for anyone, let alone a newcomer to the cryptocurrency exchange, to make heads or tails of the market. Good news is there are a lot of people doing research on this exact topic (like us!) who can help you figure out the best way to turn a profit when cryptocurrency trading.

So, if you’re in the mood to make some money but can’t make sense of all the cryptomarket lingo, check out some of these cryptocurrency trading hacks (spoiler, there are hacks for novices and experienced traders, so skip the first few if this isn’t your first rodeo).

Cryptocurrency Trading Hack #1: Start at the beginning

If you’re a newbie to the world of cryptocurrency trading, then the first and most important hack you can hear about is to learn! Jumping in without knowing what you’re talking about is a guaranteed recipe for disaster. So, before you put your money where your mouth is, get educated. Understand the market, terms, and trends. Know what terms like falls, rises, volatility, and swing trading mean. Understand what blockchain is and how it helps. Learn the different trading strategies and when to use which.

Dylan from Six-Figure Marketers Club put out one of the best beginner’s cryptocurrency trading strategy videos. It starts at the beginning and proceeds to walk you through all the basics you’ll need to start trading bitcoin. The best part of this video (and all his videos, really) is that he speaks English clearly! You’d be surprised how difficult it is to find a good cryptocurrency video tutorial by a native English-speaker, so Dylan’s stuff is really golden.

What’s more, Dylan explains everything clearly, so you will really walk away from this video understanding the ABC’s of cryptocurrency trading. As they say, knowledge is power!

Cryptocurrency Trading Hack #2: Only invest what you can afford to lose

Ok, this one doesn’t seem like a pro tip, but if you’ve ever lost money in any investment platform, you know that sticking to this rule is key. Picture this: You invest a large sum of money, probably more than you can really afford, but it’s ok because your broker ensures you that this is a solid bet. Lo and behold, the market swings the other way, and you lose everything you’ve invested.

You’re devastated, heartbroken, and what’s more, you’re broke. Now, what do you do? The smart investor walks away, but that’s not everyone. Too many people get the itch. I’ve come this far, I’ve invested so much. I can’t turn back now. So, they invest more and more and keep sinking in deeper and deeper.

This is a dangerous game you don’t ever want to play, so make sure you don’t even start your game strategy this way. Set a certain amount of money you’re willing to invest, and make sure that is only money you can responsibly afford to lose. This way, if you lose it all, you’ll still be able to pay your bills, make rent, and take care of your regular obligations without feeling any pressure. If you make a profit, that’s great! Go ahead and invest some of that too.

Cryptocurrency Trading Hack #3: Use the right software/tool/trading platform

Up there with knowing what you’re doing is knowing which platform to do it on. The right platform will give you the best advantages when trading cryptocurrencies. You’d be amazed at what a difference a convenient and smooth mobile app makes. Other features to look out for when scouting platforms include what type of security the exchange offers, the exchange, trade, and deposit-withdrawal fees charged.

Cryptocurrency Trading Hack #4: Using the MACD Indicator for buy and sell signs

I think this is one of the best beginner’s strategies. MACD aka moving average convergence divergence scale is an indicator that follows the momentum of an asset based on the movement of two averages of the security’s price. It sounds much more complicated than it really is (and if you’ve never used it before, let B from Your Altcoins show you exactly how it’s done), but once you play around with it, you’ll see just how simple it is.

Basically, following the MACD indicator will show you when is the best time to sell your investments (it can also show you when is a good time to enter or not enter into an investment). There are different settings like you can micromanage down to every five minutes or let it go for days, so play around with it to see which ones you like best and which are most successful for you. Toggle the different timeframes, how often it displays, etc. until you find the groove that works for you.

Regardless of which settings you use, the MACD indicator will show you two lines, one showing rise and one showing fall. If you follow these two trends, you’ll be able to see clearly when to sell to make the most profit. Try it out, you’ll be amazed at how easy this one is.

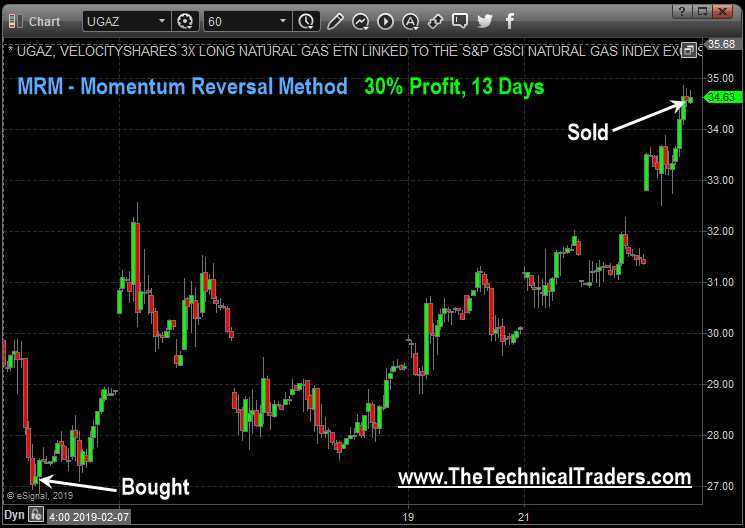
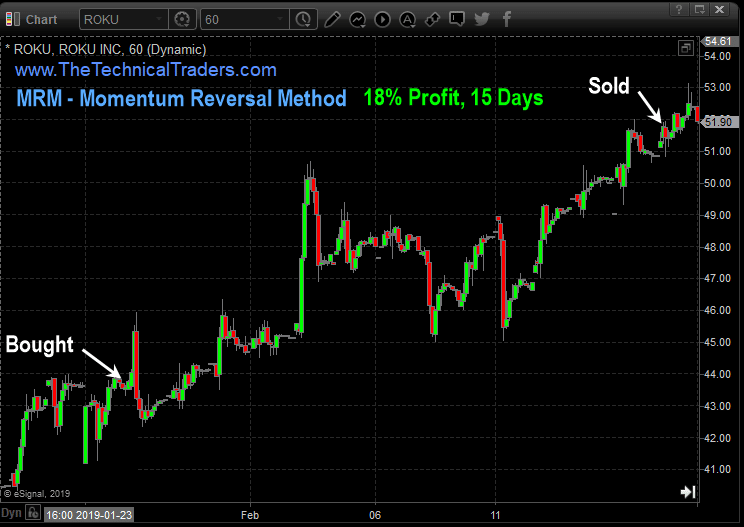
Cryptocurrency Trading Hack #5: Use Momentum

Momentum is a pretty simple concept: if things start going up, they keep going up. And when things start going down, they continue in that direction too. In general, the strategy works using this logic. Momentum says to buy a week after a currency experiences an upward trend (20% or more), and then sell a week or so later.

Of course, this isn’t always the case (see the next few hacks for a solution to this strategy loophole), there are plenty of times that assets will keep climbing and you’ll kick yourself for having sold, but at least you’ll make some profit off of the currency using this strategy. Plus, you’ll be really happy if the asset drops suddenly since you won’t have lost everything in one fell swoop.

I thought this was a great video for clarifying momentum. It’s only 15 minutes, but it explains the strategy pretty clearly. What’s more, this video is solidly backed by real research done by Yale University studies and findings. So, the information is really something you can take to the bank.

Cryptocurrency Trading Hack #6: Take profits…

One of the biggest mistakes that investors can make is not taking profits when they see a rise. It’s natural for you to want to hold out for a bigger gain, and that’s fine. But with such a volatile market and such rapidly moving changes, it’s just a bad idea to keep everything in for the big payout. If you want to see just how far you can ride the gravy train, by all means, go for it. Just do yourself a favor and take your profits out first.

If you’ve invested $1,000 and you see a rise, and your investment is now worth $1,200, take that $200 gain as your profit. Then if you want to leave the initial $1,000, you haven’t lost anything more than what you originally knew you could lose anyway. Either way, you’re still up $200!

Cryptocurrency Trading Hack #7: …But don’t take out everything

Ok, so you want to make sure you take out your profit before the asset loses its value, BUT you don’t want to take out everything, and that’s the next cryptocurrency trading hack. Basically, you want to take out your profit and leave the rest. Why? Because when an asset goes up in value, it’s the time to make your profit. Yay!

But there are so many times when a currency rises…and then continues to rise for quite some time. If you sold early on, you’ll be kicking yourself for months or even years that you didn’t hold out for a bigger slice of the pie. This CryptoLand video explains this concept really well, so if you want to learn more about it, check it out.

Cryptocurrency Trading Hack #8: Use MTP Properly

Modern Portfolio Theory (MPT) basically posits that you set aside a certain amount of money that you are willing to invest (i.e., lose) and buy an assortment of assets consistently regardless of the price. The reason this works is because the assets aren’t directly correlated, so you aren’t going to feel the pressure of all your assets moving in the same direction at one time. A good spread of assets could yield an excellent return over time.

The real hack here is to use MPT properly. That means diversifying your assets across markets, not just sticking to cryptomarkets. Why? Because all cryptocurrencies are too highly correlated right now to be considered varied enough to protect you against the risks.

Cryptocurrency Trading Hack #9: Breakouts

Breakouts are one of the most popular investment strategies (whether you’re buying low or selling high), and here’s a quick video that’ll tell you everything you need to know about it. Chris just has a personable air to him, but more importantly, he tells you all the right information in simple terms that anyone can understand. Plus, Chris actually makes trading sound like fun, so check it out!

Cryptocurrency Trading Hack #10: Make sure you’re secure

This last one also seems like a no-brainer, but you’d be amazed at how many people operate in this mode (scared face emoji!) Cryptocurrency trading is somewhat of a wild wild west of exchanges, and that means there are a lot of people looking to take advantage of you. There are plenty of built-in security features, but you’ve got to do your part to keep yourself and your investments safe too. When trading, make sure:

  • You have two-step authentication enabled
  • You’ve read up and are aware of phishing and email scams
  • You keep your cryptocurrency keys available (you forget your passwords, you’re screwed!)

With these ten hacks in hand, you can make a profit and really have some fun with this 21st-century investment trading opportunity. Go for it!

Article By Sarah Pritzker

Sarah is a Content Writer, Editor & Strategist at Youtubetomp3shark.com.

USDCAD: testing the long-term support

By Tomasz Wisniewski, Alpari

USDCAD is now approaching an ultra-important long-term support. The price action in this area should determine the direction for the next few weeks, or even months! From a fundamental point of view, CAD is getting stronger thanks to commodity prices, particularly oil. CAD is a commodity currency, so is enjoying the ride on crude & co. This correlation is back and can be clearly seen on the market right now.

USDCAD W1

From a technical standpoint, the pair is trading inside a long-term flag formation (blue lines), or an upwards channel if you will. A breakout of the lower line of this pattern should bring us a proper sell signal. There is one problem though; the higher lows are a bit irregular, so we can draw two dynamic supports here: black and blue. To be on the safe side, it would be preferable to wait for a definite breakout of both those lines. A breakout of the blue line alone wouldn’t be enough to generate the desired bearish momentum.

As we mentioned above, this formation can also be considered an upwards channel, which makes those two lines proper supports. When there are supports, traders should expect a bounce. A bounce is obviously possible, and in this case, it could form the right shoulder of the iH&S pattern seen on the H1 and H4 charts. A buy signal from this formation will be triggered if the pair breaks the red dynamic resistance, which still can be considered as the neckline. As you can see, traders have two choices here, depending on the price action that occurs on these supports and resistances. This is the beauty of price action; it doesn’t force you to be a hardcore bull or bear forever. Things could easily go either way, but at some point (after a bounce or a breakout), one will look more probable than the other.