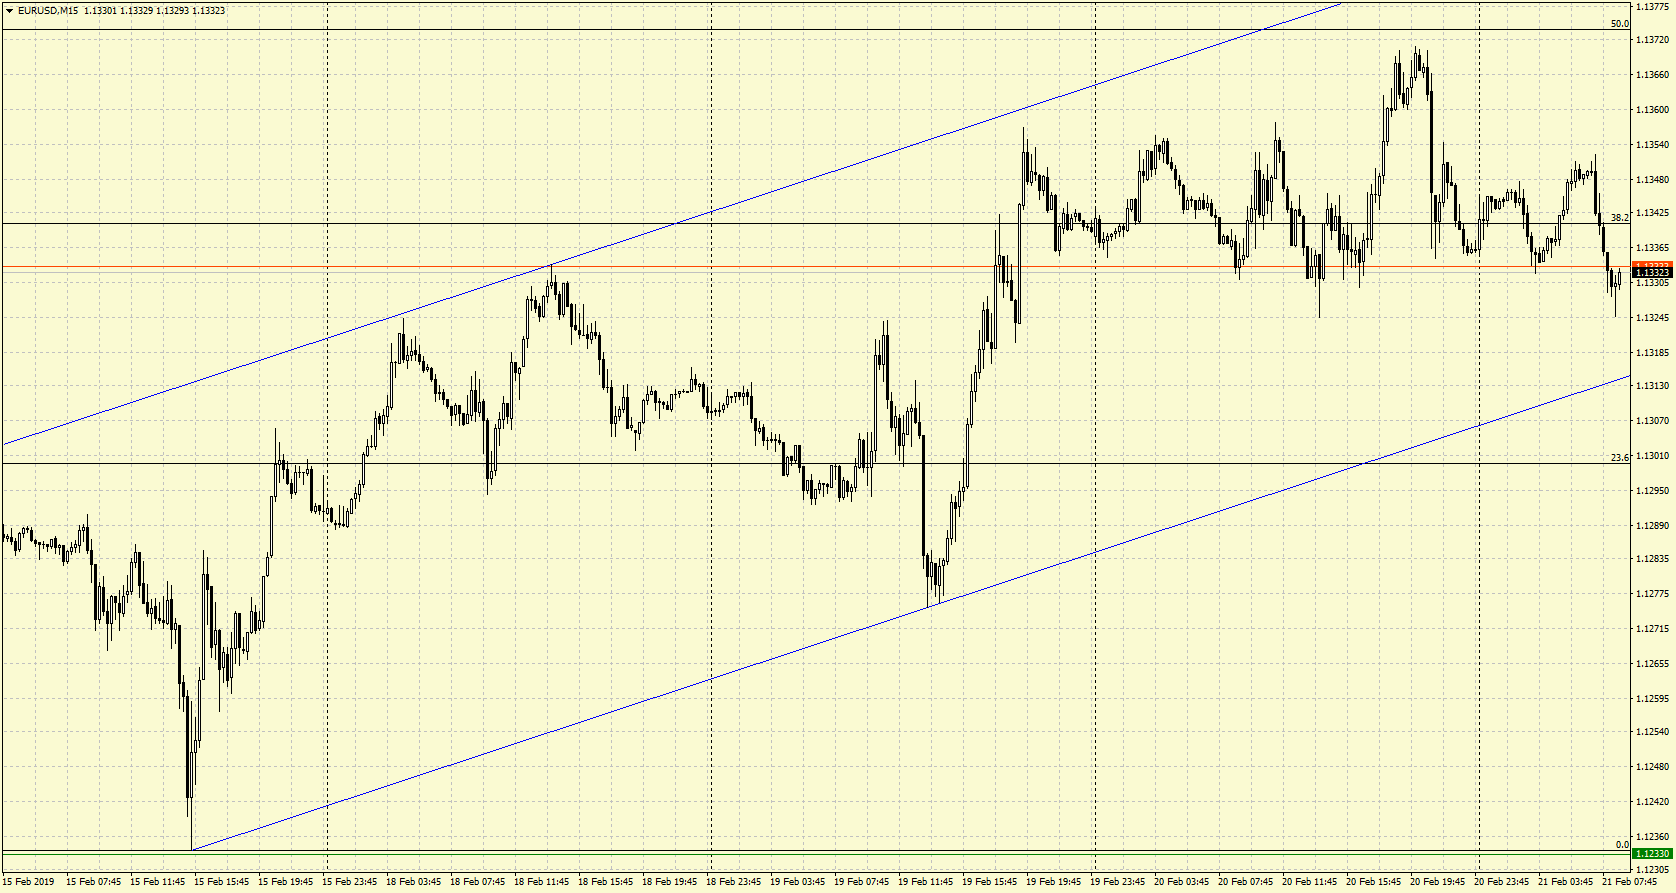
On Wednesday the 20th of February, trading on the EURUSD pair entered a sideways trend within a range of 1.1325 to 1.1370, revisiting the high from the 6th of February in the process, which is at the top of this range. This trend continued into Thursday morning’s trading, where the pair dropped to 1.1330. All the while, the pair has remained within the confines of the newly-formed upwards channel that appeared at the end of last week. The immediate growth target remains at 1.1373, which marks the 50% Fibonacci level of the latest decline. However, the pair could test the lower boundary of the channel on the way to this target.
Today in Germany, the harmonized index of consumer prices for January will be released (YoY growth of 1.7% is expected) followed by the manufacturing PMI from Markit (expected to remain at 49.7 points). The Markit manufacturing PMI for the Eurozone will also be released today, which is expected to come out at 51.1 points.
Experienced Forex Traders know it very well just how important it is to have a good Forex Broker, they can make you, or break you. This is why Forex Traders are making sure that they have the right broker and giving it a lot of time to choose one. It is also the most widely given advice to those who want to start trading – when it comes to the FX broker – choose wisely. There are many guides on how to make the right choice, what you should consider and what are the important points to draw your attention to.
The best way to choose a broker is to read a lot of broker reviews and ratings. There are many good reviews that can help you decide such as South African Forex Broker reviews and ratingshere yet there are also many biased reviews, so how should you know which ones are legitimate and which are not?
Here are ways to determine.
Are the reviews distracting you from the main point?
To put it simply, some reviews are not determined to give you the objective information about the broker, they are trying to sell the broker to you. When you are reading the review, pay attention to how fast they are going straight to the point. If the Forex broker they are reviewing is a good one, it does not need too much hustle. But it is hard to make a bad broker look good, right? this is why this kind of biased reviews are full of content that is not necessary and does not give valuable information to the reader.
Is review based on good research?
Whenever you are reading the review, do a little research about the broker by yourself to see if the review matches it, or if they are just providing information that can persuade you to start trading with this broker. If the review gives you the idea that it is too good to be true, in most cases – it is. Go to the website of the broker and go through all pages, if the review is biased you will definitely see some important not so good looking aspects that are not included in the review/ratings. Also, make sure that the review gives all the important information that you need to know at the very beginning of the review. Things like leverage, regulation, spreads and withdrawal options should be the very first thing the review tells you.
Is the information sugarcoated?
At a first glance the review might look legit, it points out all the information you need to know, but how correct is it? Those who are writing biased positive reviews about brokers who in reality are not good or are even scammers, tend to sugarcoat one thing with another. For example, if the deposit is too high, the review will talk a lot about how the much higher profit you will get when you have a successful trade. They will try to give a lot of positive information and expectation in order to confuse you. Once again, go to the website and check if the information given in the review is in accordance with the website and analyze it realistically.
Are opinions mixed?
The best way to know if something is good or bad is to experience it yourself. But why should you fall into a trap other people have already fallen into? It is always a good idea to see what other people have to say who have had experience with the broker. Search for their opinions about the broker and see if they are satisfied with the service. If most of the people say that they had problems with a certain FX broker, they got fooled, and that the broker is a scam – there’s a big chance that they are right.
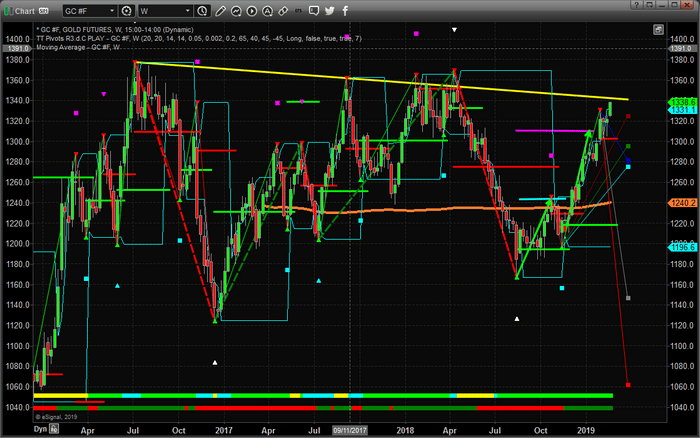
Our research has indicated that precious metals should be setting up for a period of rotation and sideways trading over the next 20~30 days. We issued a research post on January 28, 2019 warning that precious metals would be consolidated over a 30~45 day period before setting up for a massive upside price move, here. This research was based on our Adaptive Dynamic Learning price modeling system and from our Adaptive Learning Cycles system. We believe this research is still very valid and want to alert metals traders that resistance in GOLD can be easily identified near $1340-1360.
The Weekly gold chart, below, highlights the resistance channel that originates in 2016 and continues with multiple peaks in 2017, 2018 and now. We believe this resistance will act as a price ceiling over the next few weeks before metals prices attempt an upside breakout as we suggested in our January 28 research post.
Pay attention to the Fibonacci downside projected price targets near $1270~1295. These levels are very likely to be retested if the current resistance level holds. In other words, gold prices rotate back to below $1300 on moderate price rotation over the next 30 days before attempting to break resistance and move higher. Be prepared for a potential “washout high” price pattern setting up early this week.
We are still actively seeking a deeper price rotation/retracement in Gold/Silver before we initiate any new trades. We believe the upside pricing pressure has reached a level that will prompt a move back to below $1300 on healthy price rotation. If we are wrong, we will know soon enough. If we are right, then the momentum rally setup that will occur near or below $1300 will be a great trading opportunity for all investors. Follow our research to stay informed of this future price movement.
We believe 2019 and 2020 will be incredible years for skilled traders and we are executing at the highest level we can to assist our members. In fact, we are about to launch our newest technology solution to better assist our members in creating future success. Visit TheTechnicalTraders.com to learn more.
After returning to 1.1313, EURUSD has formed an upside continuation pattern and broken it upwards to reach the short-term target at 1.1355. Possibly, today the pair may form a new descending structure to reach 1.1300 and then start a new growth towards 1.1363 to complete the correction. Later, the market may resume trading inside the downtrend with the target at 1.1100.
GBPUSD, “Great Britain Pound vs US Dollar”
GBPUSD has broken 1.2915 upwards and almost extended this ascending structure twice. Today, the pair may start a reversal pattern close to the current highs for a new decline to return to 1.2915. After that, the instrument may form one more ascending structure to reach 1.2995.
USDCHF, “US Dollar vs Swiss Franc”
USDCHF has broken 1.0042 downwards and completed another descending wave at 1.0005 to finish the correction. Possibly, today the pair may reach 1.0045 and then resume falling towards 0.9993. Later, the market may resume trading upwards with the target at 1.0166.
USDJPY, “US Dollar vs Japanese Yen”
USDJPY is forming another ascending structure with the target at 110.95. Today, the pair may reach this target and then resume falling with the first target at 110.25.
AUDUSD, “Australian Dollar vs US Dollar”
AUDUSD is still being corrected upwards with the target at 0.7177. After that, the instrument may form a new descending structure towards 0.7030.
USDRUB, “US Dollar vs Russian Ruble”
USDRUB is consolidating close to the downside border. If later the instrument breaks 66.02 to the downside, the price may start a new decline to reach 65.38 and continue forming the wave with the short-term target at 60.90; if 66.40 to the upside – form one more ascending structure to reach 67.05 and then resume trading inside the downtrend with the above-mentioned target.
XAUUSD, “Gold vs US Dollar”
Gold has broken the consolidation range upwards and almost extended this structure twice to reach the target at 1346.77. Possibly, the pair may form a reversal pattern near the current highs. The first downside target is at 1324.24.
BRENT
Brent is moving upwards. Possibly, today the pair may break 66.66 to the upside and then form one more ascending structure with the target at 68.45. After that, the instrument may fall to return to 66.66 and then start a new growth towards 69.85.
Attention! Forecasts presented in this section only reflect the author’s private opinion and should not be considered as guidance for trading. RoboForex LP bears no responsibility for trading results based on trading recommendations described in these analytical reviews.
As we can see in the H4 chart, after completing the correctional downtrend, GBPUSD started a new rising impulse, which has already reached the retracement of 61.8%. However, right now the price is expected to start a short-term pullback. The next upside targets will be at 1.3109 (the retracements of 76.0%) and the high at 1.3216. The support level is at 1.2806.
In the H1 chart, the pair is starting a new correctional downtrend. The possible downside target are the retracements of 23.6%, 38.2%, and 50.0% at 1.3033, 1.3007, and 1.2986 respectively.
EURJPY, “Euro vs. Japanese Yen”
As we can see in the H4 chart, after failing to reach the retracement of 23.6%, EURJPY started a new growth, which is testing the high at 125.94. If the price breaks this level, the instrument may continue growing to reach towards the mid-term targets, the retracements of 61.8% and 76.0% at 127.34 and 129.48 respectively.
In the H1 chart, the instrument is testing the high. The support level is at 124.05.
Attention! Forecasts presented in this section only reflect the author’s private opinion and should not be considered as guidance for trading. RoboForex LP bears no responsibility for trading results based on trading recommendations described in these analytical reviews.
EUR/USD started to grow again. Yesterday the instrument updated the local maximums. The demand for USD is weakened due to the FOMC Minutes publication, which might point to the change in the Federal Reserve`s monetary policy. Earlier they had claimed that they are not going to increase the key interest rates this year but will keep an eye on the future reports.
The latest economic releases on inflation and retail were rather weak. The USD index has a potential for further correction. Keep an eye on the trading negotiations between the US and China and open positions from the key levels — 1.1300-1.13550.
At 21:00 (GMT+2:00) the US will publish the FOMC Minutes. Watch closely the rhetorics and comments made by the Federal Reserve representatives.
The price fixed above 50 MA and 200 MA, which points to the power of the buyers.
The MACD histogram is in the positive zone but below the signal line, which gives a weak signal to buy EUR/USD.
The Stochastic Oscillator is near the oversold zone, the %K line is crossing the %D line. There are no signals at the moment.
Trading recommendations
Support levels: 1.13300, 1.13000, 1.12800
Resistance levels: 1.13550, 1.13800, 1.14000
If the price fixes above 1.13550, expect the quotes to recover toward 1.13800-1.14000.
Alternatively, the quotes can fall toward 1.13000-1.12800.
The GBP/USD currency pair
Technical indicators of the currency pair:
Prev Open: 1.29185
Open: 1.30605
% chg. over the last day: +1.05
Day’s range: 1.30271 – 1.30764
52 wk range: 1.2438 – 1.4378
GGBP/USD is in the middle of an aggressive buy-out, despite the weak Labour Market reports. The quotes grew by 150 points and updated the key extremums. The demand for GBP grew due to renewed hope in Theresa May`s Brexit negotiations. At the same time, the experts suppose that this growth is caused by the technical factors.
GBP/USD has the potential for further recovery. You should open positions from the current support and resistance levels of 1.30250 and 1.30750.
The Economic News Feed for 20.02.2019 is calm.
The price fixed above 50 MA and 200 MA which points to the power of the buyers.
The MACD histogram is in the positive zone but below the signal line which gives a weak signal to buy GBP/USD.
The Stochastic Oscillator is near the oversold zone, the %K line is below the %D line, which gives a weak signal to buy GBP/USD.
Trading recommendations
Support levels: 1.30250, 1.29800, 1.29400
Resistance levels: 1.30750, 1.31000
If the price fixes above 1.30750, expect the quotes to grow toward 1.31000-1.13300.
Alternatively, the quotes can fall toward 1.29800-1.28500.
The USD/CAD currency pair
Technical indicators of the currency pair:
Prev Open: 1.32364
Open: 1.32117
% chg. over the last day: -0.24
Day’s range: 1.31828 – 1.32162
52 wk range: 1.2248 – 1.3664
USD/CAD quotes are showing a negative trend. Yesterday they updated the local minimums. The demand for USD fell before the FOMC Minutes publication.
USD/CAD has a potential for further descend, since CAD is additionally supported by the bullish oil quotes. You should open positions from the key levels: 1.31850 and 1.32150.
The Economic News Feed for 20.02.2019 is calm.
The price fixed below 50 MA and 200 MA, which points to the power of the buyers.
The MACD histogram is in the negative zone and keeps descending, which points to the further fall of the USD/CAD quotes.
The Stochastic Oscillator is in the neutral zone, the %K line is below the %D line, which give a signal to sell USD/CAD.
Trading recommendations
Support levels: 1.31850, 1.31500, 1.31000
Resistance levels: 1.32150, 1.32300, 1.32600
If the price fixes below 1.31850, expect the quotes to fall toward 1.31500-1.31300.
Alternatively, the quotes can fall toward 1.32300-1.32500.
The USD/JPY currency pair
Technical indicators of the currency pair:
Prev Open: 110.592
Open: 110.607
% chg. over the last day: +0.02
Day’s range: 110.524 – 110.821
52 wk range: 104.56 – 114.56
USD/JPY is showing and ambiguous technical picture. The quotes are consolidating. The safe haven currency remains under pressure due to the comments by the Head of the Bank of Japan. The offical stated, that they are ready to increase the economic stimuli, if the strengthening of yen is going to prevent the economic stability of the country. Right now USD/JPY is testing the local support and resistance at 110.650 and 110.900. You should open positions from these levels.
The Economic News Feed for 20.02.2019:
The price fixed above 50 MA and 200 MA which points to the power of the buyers.
The MACD histogram is in the positive zone and above the signal line, which gives a weak signal to buy USD/JPY.
The Stochastic Oscillator is in the neutral zone, the %K line is below the %D line which points to a bearish mood.
Trading recommendations
Support levels: 110.650, 110.450, 110.250
Resistance levels: 110.900, 111.100, 111.500
If the price fixes above 110.900 resistance, you should look for the market entry points to open long positions. The movement will tend toward 111.200-111.400.
Alternatively, the quotes can fall toward 110.450-110.250.
Yesterday, the US dollar weakened against a basket of currency majors. The dollar index (#DX) updated local lows and closed in the negative zone (-0.45%). At the moment, the US currency is being traded without a clear dynamic, as financial market participants took a wait-and-see position before publication of the FOMC meeting minutes. Earlier, the Fed said it would not hasten to increase the interest rates in the current year. Also, investors are closely monitoring the negotiations between the US and China. According to the US President, the negotiations are succeeding, despite the fact that the United States has previously accused China of unfair trading practices. In turn, the representatives of China demanded that the US respect China’s right to development and prosperity.
It became known that the British Prime Minister went to Brussels with the intention to renegotiate Brexit deal. The insurance policy will be the key issue, which will prevent extensive border controls between the EU member state Ireland and the British province of Northern Ireland. In general, this news has improved investors’ sentiment, and the British pound has strengthened significantly against the US currency despite the weak economic statistics. Thus, the average wage level, including bonuses, fell to 3.4% in December instead of 3.5% in the UK. The number of jobless claims rose to 14.2K in January, while experts expected 12.3K.
The “black gold” prices are moving in different directions. At the moment, futures for the WTI crude oil are testing the mark of $56.50 per barrel.
Market Indicators
Yesterday, the bullish sentiment was observed in the US stock market: #SPY (+0.17%), #DIA (+0.06%), #QQQ (+0.20%).
The 10-year US government bonds yield is at 2.64-2.65%.
The news feed on 20.02.2019:
– publication of the FOMC meeting minutes at 21:00 (GMT+2:00).
On Tuesday the 19th of February, trading on the EURUSD pair started from 1.1310. It dropped to 1.1275 by midday before undergoing a sharp upwards reversal to reach our target of 1.1341. It then pressed on to hit 1.1355 before retreating to close the day below the newly broken resistance. The level to which the pair corrected (1.1341) is, first of all, the intraday high from the 13th of February, and secondly, it coincides with the 38.2% Fibonacci level of the decline from 1.1514 to 1.1233.
Tuesday’s newswires were fairly quiet. The only thing worth noting is the German business sentiment index from ZEW, which shed 13.4 points, although this was slightly better than the expected decline of 14.0 points.
The pair has decisively broken out of the downwards channel formed at the end of January, and has formed a new upwards channel. The next significant target within this channel is at 1.1375, which marks the 50% Fibonacci level of the latest decline.
On Monday, trading on the EURUSD pair closed up by a decent amount. By close, the euro had appreciated by 0.11% to finish the day at 1.1308. The single currency has started the week by attempting to reverse the downtrend started at the beginning of February. The euro has lost 1.2% against the dollar since the beginning of the month. We could see this trend reverse in the coming weeks, and the euro may rise as far as 1.1340.
It would seem that European markets are satisfied with the way US-China trade talks are going, with US President Donald Trump hailing the progress being made on his Twitter account. Divisions within the UK’s Labour Party, which led to the resignation of several MPs on Monday, could be a sign of things to come as internal divisions within the UK may slow down the process of leaving the EU.
This morning, the EURUSD pair has shed 0.1% of yesterday’s close. It’s possible that today and tomorrow, the euro will fluctuate within a small range of 1.129 – 1.131.
As we can see in the H4 chart, USDCAD is still trading close to the resistance level and forming Harami and Doji reversal patterns. Judging by the previous movements, it may be assumed that the instrument may complete the correction and then resume its descending movement.
AUDUSD, “Australian Dollar vs US Dollar”
As we can see in the H4 chart, AUDUSD is still trading close to the support level and forming Hammer, Engulfing, Doji, and Harami reversal patterns. Judging by the previous movements, it may be assumed that after finishing another correction the instrument may start a new growth.
Attention! Forecasts presented in this section only reflect the author’s private opinion and should not be considered as guidance for trading. RoboForex LP bears no responsibility for trading results based on trading recommendations described in these analytical reviews.