Analytics by JustForex
The EUR/USD currency pair
- Prev Open: 1.13391
- Open: 1.13073
- % chg. over the last day: -0.30
- Day’s range: 1.12898 – 1.13075
- 52 wk range: 1.1214 – 1.2557
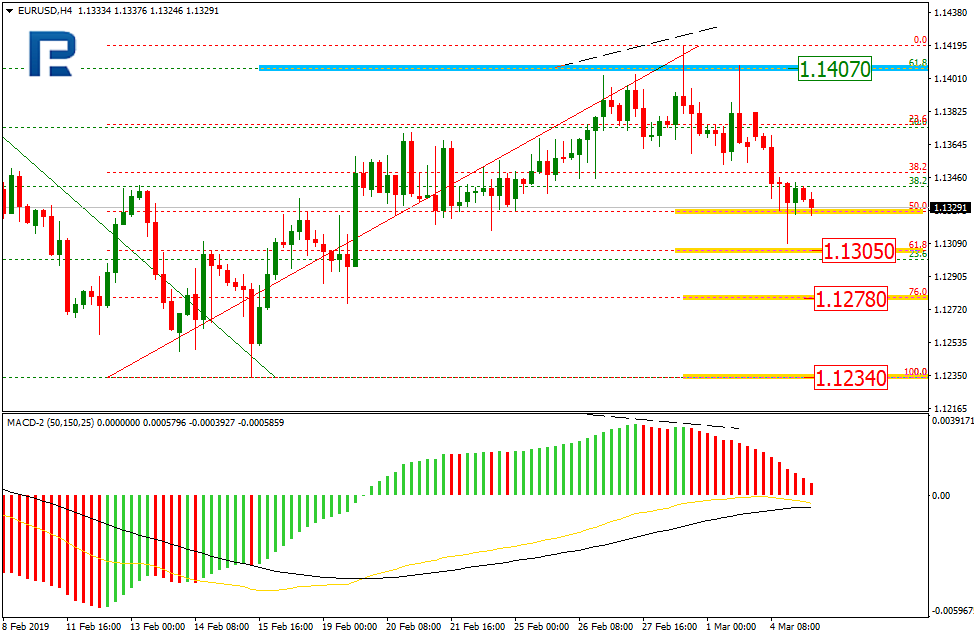
EUR keeps losing positions against the USD before the Central Bank meeting. Yesterday EUR/USD quotes updated the local minimums. The trading instrument is consolidating around 1.12900-1.13100. EUR is under pressure due to the worries that ECB might renew the stimulating measures for the economy and announce it on Thursday. An additional support for USD is given by the optimistic report on the business activity in the non-industrial and real-estate markets. You should open positions from the key levels.
The Economic News Feed for 06.03.2019:
- – Preliminary Report on the Labour Market by ADP (US) – 15:15 (GMT+2:00);
- – Trading Balance (US) – 15:30 (GMT+2:00);
- – Beige Book (US) – 21:00 (GMT+2:00);
Keep an eye on the comments by FOMC representatives.

The price fixed below 50 MA and 200 MA which points to the power of the sellers.
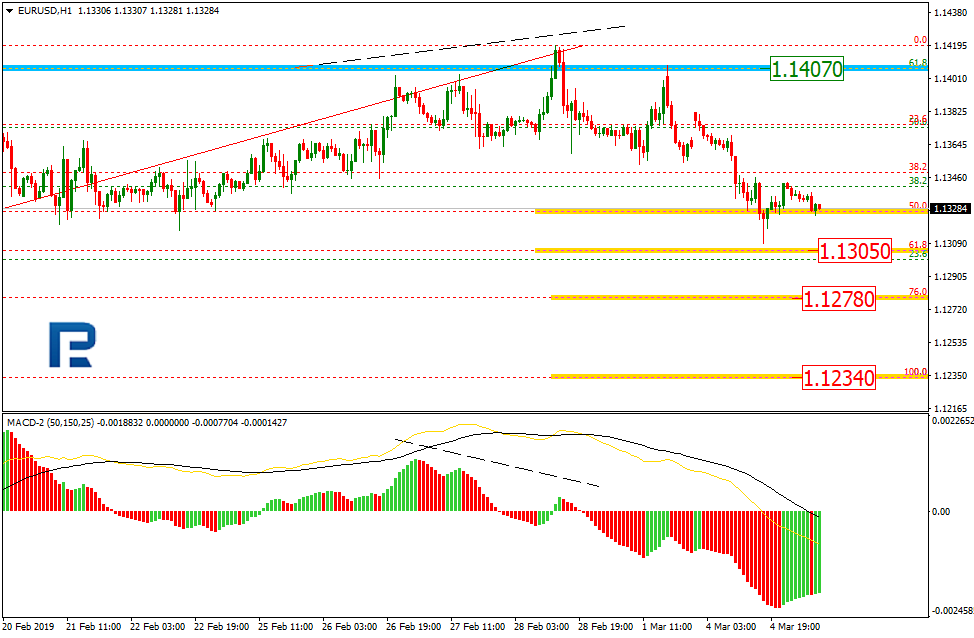
The MACD histogram is in the negative zone but above the signal line which gives a weak signal to sell EUR/USD.
The Stochastic Oscillator is near the oversold zone, the %K line is above the %D line which points to the bullish mood.
- Support levels: 1.12900, 1.12500
- Resistance levels: 1.13200, 1.13450, 1.13650
If the price fixes below the support level of 1.12900, expect the quotes to fall further toward 1.12500-1.12300.
Alternatively, the quotes can grow toward 1.13400-1.13600.
The GBP/USD currency pair
- Prev Open: 1.31734
- Open: 1.31729
- % chg. over the last day: -0.01
- Day’s range: 1.31240 – 1.31788
- 52 wk range: 1.2438 – 1.4378
GBP/USD keeps showing a negative trend. The market participants started to fix their positions after the long rally in the last two weeks. GBP is under pressure due to Brexit ambiguousness. On Tuesday the represtative of the Labour party claimed that not many parliamentaries support the EU deal proposed by May, and that there hasn’t been any breakthroughs on that front. Right now the quotes are consolidating. The key range is 1.31100-1.31800. You should open positions from these levels.
The Economic News Feed for 06.03.2019 is calm.

The indicators do not provide precise signals, 50 MA has crossed 200 MA.
The MACD histogram is in the negative zone but above the signal line which gives a weak signal to sell GBP/USD.
The Stochastic Oscillator is in the neutral zone, the %K line is above the %D line which points to the bullish mood.
- Support levels: 1.31100, 1.30500, 1.29800
- Resistance levels: 1.31800, 1.32400, 1.32800
If the price fixes below 1.31000, expect the quotes to fall toward 1.30700-1.30400.
Alternatively, the quotes can recover toward 1.32300-1.32600.
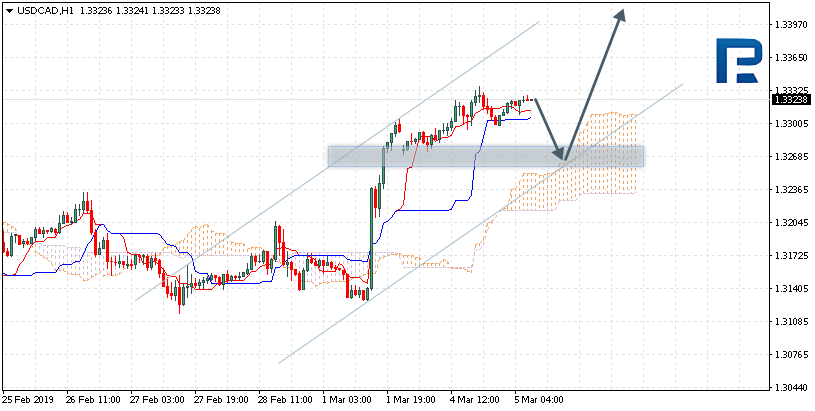
The USD/CAD currency pair
- Prev Open: 1.33018
- Open: 1.33502
- % chg. over the last day: +0.39
- Day’s range: 1.33489 – 1.33736
- 52 wk range: 1.2248 – 1.3664
CAD is weakened again against the USD. The quotes are consolidating around the local resistance 1.33750 with 1.33350 acting as a mirror resistance. The financial market participants are waiting for the Bank of Canada meeting. The regulator is planned to keep the 1.75% key interest rate. Keep an eye on the comments and rhetorics by the Central Bank representatives. You should open positions from the key levels.
The Economic News Feed for 06.03.2019:
- – Trading Balance (CAD) – 15:30 (GMT+2:00);
- – Decision of Bank of Canada on the key interest rate (CAD) – 17:00 (GMT+2:00);
- – Ivey’s Business Activity Index (CAD) – 17:00 (GMT+2:00);

The price fixed above 50 MA and 200 MA which points to the power of byers.
The MACD histogram is in the positive zone but below the signal line, which gives a weak signal to buy USD/CAD.
The Stochastic Oscillator is in the neutral zone, the %K line is below the %D line which points toward the correction of USD/CAD.
- Support levels: 1.33350, 1.33000, 1.32700
- Resistance levels: 1.33750, 1.34000
If the price fixes above 1.33750, expect the quotes to grow toward 1.34250-1.34500.
Alternatively, the quotes can correct toward the round 1.33000.
The USD/JPY currency pair
- Prev Open: 111.729
- Open: 111.849
- % chg. over the last day: +0.10
- Day’s range: 111.725 – 111.924
- 52 wk range: 104.56 – 114.56
USD/JPY remains in a flat. The technical picture is ambiguous. The investors are waiting for additional drivers, with levels being 111.750 and 112.000 respectively. Keep an eye on the economic reports, as well the US Treasury bond yield dynamics. You should open positions from the key levels.
The Economic News Feed for 06.03.2019 is calm.

The indicators do not provide precise signals, the price has crossed 50 MA.
The MACD histogram is close to 0.
The Stochastic Oscillator is in the neutral zone, the %K line is above the %D line which gives a signal to buy USD/JPY.
- Support levels: 111.750, 111.500, 111.200
- Resistance levels: 112.000, 112.500
If the price fixes above the round 112.000, expect the quotes to grow toward 112.400-112.600.
Alternatively, the quotes can fall toward 111.500-111.300.
Analytics by JustForex