Author Archive for InvestMacro – Page 272

The Analytical Overview of the Main Currency Pairs on 2019.03.11

Analytics by JustForex

The EUR/USD currency pair

Technical indicators of the currency pair:
  • Prev Open: 1.11933
  • Open: 1.12342
  • % chg. over the last day: +0.41
  • Day’s range: 1.12231 – 1.12499
  • 52 wk range: 1.1214 – 1.2557

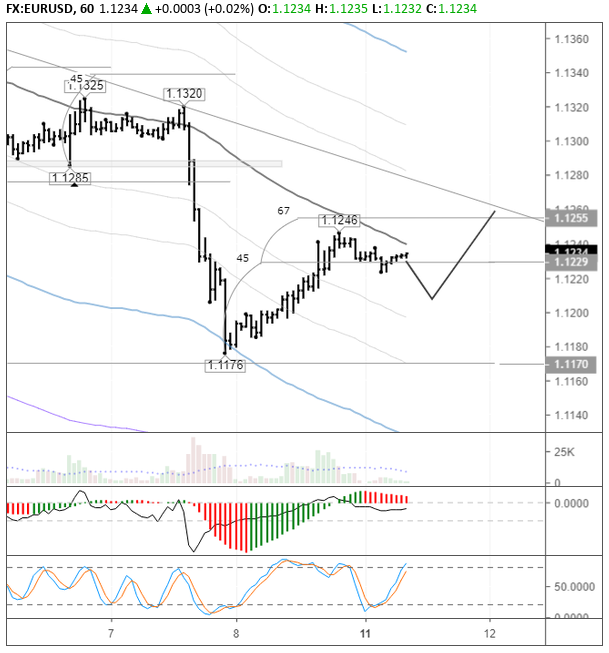
EUR has recovered a major part of its losses after aggressive sales in Thursday, March 7. The Central Bank of Europe left the key interest rates at the previous level. The regulator worsened the forecast of the EU GDP in 2019-2020 and also notified the the long-term credit operation under the TLTRO program will be renewed to stimulate the economy. The EUR/USD quotes are consolidating around the key range of 1.1200-1.12500. The demand for the USD weakened after the ambiguous labour market reports in February. EUR/USD has further prospects for correction. You should open positions from the key levels.

At 14:30 (GMT+2:00) the US will publish the retail sales report.

EUR/USD

Indicators do not provide precise signals, the price has crossed 50 MA.

The MACD histogram is in the positive zone, which points toward the further recovery of EUR/USD quotes..

The Stochastic Oscillator is in the overbought zone, the %K line is crossing the %D line. There are no signals at the moment.

Trading recommendations
  • Support levels: 1.12200, 1.11800
  • Resistance levels: 1.12500, 1.12900, 1.13200

If the price fixes above the 1.12500, expect the quotes to correct toward 1.12900-1.13200.

Alternatively, EUR/USD can fall toward 1.11900-1.11700.

The GBP/USD currency pair

Technical indicators of the currency pair:
  • Prev Open: 1.30828
  • Open: 1.29668
  • % chg. over the last day: -0.52
  • Day’s range: 1.29603 – 1.30180
  • 52 wk range: 1.2438 – 1.4378

GBP/USD keeps the bearish mood due to the Brexit ambiguousness. Last week the GBP lost more than 250 points. Right now the quotes are consolidating around 1.29650 and 1.30150. The investors are waiting for the Parliament vote on Brexit tomorrow. You should open positions from the key levels.

The Economic News Feed for 11.03.2019 is calm.

GBP/USD

The price fixed below 50 MA and 200 MA which points to the power of the sellers

The MACD histogram is in the negative zone but above the signal line which gives a weak signal to sell GBP/USD.

The Stochastic Oscillator is near the overbought zone, the %K line is crossing the %D line. There are no signals at the moment.

Trading recommendations
  • Support levels: 1.29650, 1.29250, 1.29000
  • Resistance levels: 1.30150, 1.30700, 1.31100

If the price fixes below 1.29650, expect the quotes to fall toward 1.29300-1.29000.

Alternatively, the quotes can recover toward 1.30700-1.31000.

The USD/CAD currency pair

Technical indicators of the currency pair:
  • Prev Open: 1.34446
  • Open: 1.34148
  • % chg. over the last day: -0.30
  • Day’s range: 1.34055 – 1.34343
  • 52 wk range: 1.2248 – 1.3664

USD/CAD stabilized after a long rally since the beginning of the month. Right now the CAD is being traded in a flat. The key support and resistance levels are 1.34000 and 1.34400. A technical correction of USD/CAD is possible soon. The demand for USD is lowered due to ambiguous Labour Market reports for February. Keep an eye on the oil quotes dynamics and open positions from the key levels.

The Economic News Feed for 11.03.2019 is calm

USD/CAD

The price fixed between 50 MA and 200 MA which act as the strong dynamic support and resistance levels.

The MACD histogram is in the negative zone and below the signal line which points toward a correction of USD/CAD.

The Stochastic Oscillator is in the neutral zone, the %K line is crossing the %D line. There are no signals.

Trading recommendations
  • Support levels: 1.34000, 1.33700, 1.33350
  • Resistance levels: 1.34400, 1.34650, 1.35000

If the price fixes below the round 1.34000, expect the USD/CAD to correct toward 1.33600-1.33300.

Alternatively, the quotes can grow toward 1.34800-1.35000.

The USD/JPY currency pair

Technical indicators of the currency pair:
  • Prev Open: 111.533
  • Open: 111.003
  • % chg. over the last day: -0.38
  • Day’s range: 110.877 – 111.307
  • 52 wk range: 104.56 – 114.56

USD/JPY started to lower after the long consolidation. On Friday the quotes updated the key minimums. The demand for the safe haven currency is supported by the upcoming Brexit vote in Great Britain. The local support and resistance are 111.000 and 111.300. The trading instrument has further descent prospects. You should open positions from the key levels.

The Economic News Feed for 11.03.2019 is calm.

USD/JPY

The indicators do not provide precise signals, the price is testing 50 MA.

The MACD histogram is close to 0.

The Stochastic Oscillator started to leave the overbought zone, the %K line is below the %D line which points toward the bearish mood.

Trading recommendations
  • Support levels: 111.000, 110.750, 110.600
  • Resistance levels: 111.300, 111.600, 111.800

If the price fixes below the round 111.000 the quotes can fall toward 110.750-110.600.

Alternatively, the quotes can grow toward 111.600-111.800.

Analytics by JustForex

The Next Big Market Correction

By TheTechnicalTraders.com

Our researchers have been working overtime trying to help you stay ahead of these market moves.  You may recall that we called this current downward price rotation in the US stock market over 25 days ago?  You may recall that we called the downside price move in Gold over 40 days ago?  Now, we’re going to help you understand how to find profits from these movements and how to look for opportunities throughout this rotation.

Our expectations for this move are that the NQ will see the biggest price rotation compared to the ES and YM.  We expect the ES and YM to rotate downward by about -4~8% while we expect the NQ to rotate downward by -6~12%.  The reason for this is that we believe investors are already in the midst of a capital shift moving capital away from technology and into Blue Chips and Mid-Caps.  We believe this transition away from technology will continue and we believe this price weakness may result in the NQ/Technology establishing much lower price levels than many expect.

Currently, our expectations are for support near $6860 to hold with a potential for prices to reach a lower support level near $6740.  We do expect this downside move to last at least 2~3 weeks before setting up a “momentum base” and starting to move higher again.


Opportunities currently exist for skilled traders to play this downside move in technology as well as to play an upside pop in the Inverse ETFs related to technology and the NASDAQ.  Additionally, a similar trade could be made in the ES & YM, although we must warn you that price moves in the ES & YM are expected to be much more shallow in nature.

Our research suggests a bottom may form from this move sometime near April 10~17, 2019.  We believe this rotation may last at least 3~4 weeks as expectations of global markets may continue until Brexit, US/China Trade and or Q1 Earnings start to hit the markets near the April 10~17 dates.

Once we enter April and get past April 5th or so, we should switch gears and start to look for Buying opportunities in the ES, YM, and NQ with a bias towards the Blue Chips and Mid-Caps.  We believe these will be the bigger upside winners over the next 3~6+ months and could show an incredible upside price move after this new “momentum base” completes.

It is very important to take a minute to view our 5 PART Series because it shows you predicted price levels going all the way into 2021 and highlights why this “new bull market” may just be getting started.

If you want to join a group of professional traders, researchers, and friends, take a look at our trading newsletter to learn how we can help you find and execute better trades each month.  We believe 2019 and 2020 will be incredible years for skilled traders and we are executing at the highest level we can to assist our members.  In fact, we are about to launch our newest technology solution to better assist our members in creating future success.

Our team has 53 years of experience in researching and trading makes analyzing the complex and ever-changing financial markets a natural process. We have a simple and highly effective way to provide our customers with the most convenient, accurate, and timely market forecasts available today. Our stock and ETF trading alerts are readily available through our exclusive membership service via email and SMS text. Our newsletter, Technical Trading Mastery book, and 3 Hour Trading Video Course are designed for both traders and investors. Also, some of our strategies have been fully automated for the ultimate trading experience.

RECENT CLOSED TRADES

Chris Vermeulen
Technical Traders Ltd.

TheTechnicalTraders.com

Fibonacci Retracements Analysis 11.03.2019 (GOLD, USDCHF)

Article By RoboForex.com

XAUUSD, “Gold vs US Dollar”

As we can see in the H4 chart, after reaching the retracement of 38.2%, XAUUSD has started a new pullback with the target at the retracement of 23.6% at 1311.20. After completing the pullback, the pair may resume trading downwards. The next downside targets may be the retracements of 50.0%, 61.8%, and 76.0% at 1271.50, 1253.60, and 1232.40 respectively.

GOLD1
Risk Warning: the result of previous trading operations do not guarantee the same results in the future

In the H1 chart, the convergence made the pair reverse and start a new growth, which has already reached the retracement of 38.2%. The next possible targets may be the retracements of 50.0% and 61.8% at 1305.30 ad 1311.20 respectively. The key support level is the low at 1280.71.

GOLD2
Risk Warning: the result of previous trading operations do not guarantee the same results in the future

USDCHF, “US Dollar vs Swiss Franc”

As we can see in the H4 chart, USDCHF is forming a new rising wave; it has already reached the retracement of 76.0%. Right now, the pair is being corrected downwards to reach the short-term retracement of 50.0% at 1.0038. The next ascending impulse will be heading towards the high at 1.0149. After breaking it, the instrument may continue growing towards the post-correctional extension area between the retracements of 138.2% and 161.8% at 1.0234 and 1.0286 respectively.

USDCHF1
Risk Warning: the result of previous trading operations do not guarantee the same results in the future

In the H1 chart, the pair is being corrected downwards to reach the retracement of 38.2% and 50.0% at 1.0062 and 1.0044 respectively. The resistance level is the high at 1.0124.

USDCHF2
Risk Warning: the result of previous trading operations do not guarantee the same results in the future

Article By RoboForex.com

Attention!
Forecasts presented in this section only reflect the author’s private opinion and should not be considered as guidance for trading. RoboForex LP bears no responsibility for trading results based on trading recommendations described in these analytical reviews.

The US Dollar Index Has Moved Away from Local Highs

by JustForex

Last week, the Reserve Bank of Australia, Bank of Canada and the ECB meetings were held. Regulators, as expected, kept key interest rates unchanged. The ECB lowered its forecast for the growth of the Eurozone economy in 2019-2020, and also announced the resumption of targeted longer-term refinancing operations (TLTRO). These events caused aggressive sales of the euro to lows since June 2017.

On Friday, the US dollar weakened against a basket of major currencies after the publication of ambiguous economic data. The number of building permits increased to 1.345M in January instead of 1.289M. Nonfarm employment change increased by only 20K in February, while experts expected 181K. This indicator shows a slowdown in economic growth in the country. At the same time, the unemployment rate fell to 3.8% in February instead of the forecasted 3.9%. Average hourly earnings increased by 0.4% compared with market expectations at 0.3%. The dollar index (#DX) closed the trading session in the negative zone (-0.37%).

Important economic reports are expected this week. Today, investors are focused on the US retail sales report. Also, US President, Donald Trump, should submit a draft budget for 2020, which was postponed due to the shutdown of the US government’s work. UK Parliament vote on Brexit deal will be held tomorrow. If the project is not accepted, then the Brexit delay will most likely be considered.

The “black gold” prices are rising after a decline the day before. At the moment, futures for the WTI crude oil have approached $56.70 per barrel.

Market Indicators

On Friday, there was bearish sentiment in the US stock market: #SPY (-0.20%), #DIA (-0.04%), #QQQ (-0.15%).

At the moment, the 10-year US government bonds yield is at the level of 2.65-2.66%.

The news feed on 11.03.2019:

– Retail sales in the US at 14:30 (GMT+2:00).

by JustForex

EURUSD: bulls keeping the rate at the trend line

By Matthew Anthony, Alpari

Previous:

On Friday the 8th of March, trading on the euro closed up. The euro rose against the dollar throughout all the day’s trading sessions. After the release of mixed US jobs data, this rise gathered pace to reach 1.1246.

20k new jobs were created in the US outside the agricultural sector in February. The dollar came under pressure after the report was released as markets had been expecting 180k new jobs. Speculators reacted by shorting the dollar. However, the fall of the US dollar index was mitigated by other factors.

The readings for December and January were revised upwards by 12k; December’s by 5k and January’s by 7k. US unemployment dropped from 3.9% to 3.8%. Average hourly earnings went up by 0.4% after a rise of 0.1% last month (forecast: +0.3%).

Day’s news (GMT+3):

  • 10:00 Germany: industrial production (Jan), trade balance (Jan).
  • 15:30 US: retail sales (Jan).
  • 16:00 UK: BoE’s Haskel speech.

EURUSD H1

Current situation:

I decided to watch the market from the sidelines on Friday. At the time of writing this review, the euro is trading at 1.1239. The pair has reversed upwards from the D3 line to reach the balance line. The market is in equilibrium on the hourly timeframe. The pair is now ready to diverge from here.

Considering that the economic calendar is virtually empty, and that Friday’s price fluctuations were relatively subdued, today I’m forecasting the pair to continue its recovery towards the trend line. At today’s 09:00 mark on the chart, the trend line runs through 1.1276. My forecast has the pair meeting the trend line at 1.1258 in the middle of the day. I reckon that before we can rise any further, we need to see a correction to 1.1209. When we reach the trend line, we can expect a new wave of sales on the euro.

The Trade Week Ahead – Currency Point: AUD – Well that escalated quickly

By FPMarkets.com

Like rats on a sinking ship, one by one we saw economist after economist jumped off the Australian hike path and onto the cut bandwagon.

The market too followed suit the interbank market is now fully pricing in a 25-basis point (bps) cut by December 2019 with a 50% chance of a further 25bps out of the official cash rate by year end.

It’s perfectly summed up in this chart from the ASX.

Why has the market got so dovish on the cash rate so fast? ‘Growth is ending’, ‘per capita GDP is now in recession’ ‘household sending is collapsing’. The pencil-necking was large make no mistake.

I would agree that growth is slowing, and that consumption has been come a concern.

However, let’s look at the actuals from this week GDP plus a few other inputs that feed into the AUD.

First the GDP numbers:

  • Quarterly GDP grew at 0.2%, missed estimates and was structurally weak in the area of private investment.
  • Year-on-year (yoy) was the big miss at 2.3% vs 2.5% consensus estimate – it was actually below the lowest estimate given.
  • ‘Wealth effect’ issues: collapse in big ticket items such as car sales and furnishings
  • Household spending in Australia’s largest state NSW collapsed to 0.1%

However,

  • Labour compensation was up 4.3% yoy
  • Corporate profits jumped 11% yoy

Yes growth is moderating and yes productivity isn’t growing which does paint a gloomy picture. However, some granular parts that suggest there is no ‘scorched earth’ scenario coming.

The question then becomes, what did the AUD do on this news?

AUDUSD

EURAUD

AUDNZD

It clearly tested some longer-term support lines.

However, since then two things have happened that bring a bit of focus into our trade thinking.

First, the Australia trade balance for January was the second-best print on record beaten only by the December 2016 print. At $4.5 billion with a 5% jump in exports it reduces the current account deficit with some estimating it could reduce the current account deficit to 1% of GDP. That will take the pressure off Australia’s reliance on foreign capital – A direct AUD lever.

Second, inflation is bottoming out, it anaemic but it is holding at 1.8% there forcing of the RBA.

This week has clearly put downward pressure on the AUD (as it should). However, the argument now is: has this week created a scenario that is structure in nature or just cyclical?

In my opinion until the RBA is ‘forced’ to cut rates this is current movement is likely to be cyclical and until the RBA make a cut actual, the AUD will not push to and hold at or below 68c. Thus it is likely to remain in its tight band of 70c-73c.

By FPMarkets.com

Are you ready for the next big move in Gold?

By TheTechnicalTraders.com

If you were following our research, you would have known that Gold had reached a short-term peak in February. On Feb 19th the day gold posted a huge gain for the day and everyone was bullish and feeling like million bucks I did a radio show with HoweStreet’s Jim Goddard and said that strong day and overly positive sentiment was the going to be the top, which it was – Listen Here.

We had been advising our members that Gold would likely retrace below $1300 possibly beeper by and mid-April.  Our advanced Adaptive Learning price modeling systems had warned us that Gold would likely setup a price rotation before the next move higher back in January 2019.  This is what you need to know about the next 4+ weeks in Gold.

First, this downside price move is not over yet.  It will likely continue through early April – attempting to establish a price base and new momentum bottom.  Our opinion is that $1260 is currently the ultimate low price objective – although this is a soft target.  Meaning, the price could retrace below this level (possibly towards $1240) before establishing a true price bottom.  Be prepared for a low price near or below $1265 at some point in the near future.

Second, this downside price move in Gold will likely create opportunities for skilled traders over the next 3~6+ months.  Our longer-term predictive modeling systems suggest that Gold will rally towards $1500 or higher near May/June of 2019.  Thus, this downside move in an opportunity for skilled traders.

Third, we believe global economic and political news cycles are prompting a shifting capital across the planet at the moment.  Global capital is likely shifting into safety in the US Stock market and away from high-flying technology and biotech stocks.  Because of this, the fear that would typically drive a rally in Gold has been partially abated.  The strength of the US dollar and the willingness of investors to shift capital into larger Blue Chips and Mid-Caps helps to reduce the true “fear hedge” that would drive Gold prices higher.

Lastly, we believe this trader psychology will change in late April or early May of this year.  Our predictive modeling systems suggest a strong price advance in Gold will take place in May/June of 2019.  Our cycle analysis suggested that April 21~24, 2019 are “key dates” for a cycle bottom or some type of news event that could change the dynamics of the precious metals markets.  Pay attention.

This means that we need to be prepared for the downside price rotation in Gold and be aware that April 21~24 are likely to be a major inflection point in the precious metals markets.  Skilled traders would be looking for opportunities before these dates and positioning themselves for the upside move.

Our research team, at Technical Traders Ltd., believes the $1260 level is true support – although we believe $1245 or so maybe an ultimate “washout low” price level to watch for.  At this time, we are waiting for a clearer basing formation to establish new long positions and we are watching the US Dollar as well.

There is still plenty of time for this base/bottom to setup.  Remember the April 21~24 date range and plan for key opportunities to setup 7~10 days before this key date.  The next move higher in Gold should push prices well above $1400 with a high price target near $1540 for the longer term.  If you are a “gold-bug” and/or want to find some real opportunity in the markets, then you won’t want to miss this next move.

If you want to join a group of professional traders, researchers, and friends, take a look at our trading newsletter to learn how we can help you find and execute better trades each month.  We believe 2019 and 2020 will be incredible years for skilled traders and we are executing at the highest level we can to assist our members.  In fact, we are about to launch our newest technology solution to better assist our members in creating future success.

Our team has 53 years of experience in researching and trading makes analyzing the complex and ever-changing financial markets a natural process. We have a simple and highly effective way to provide our customers with the most convenient, accurate, and timely market forecasts available today. Our stock and ETF trading alerts are readily available through our exclusive membership service via email and SMS text. Our newsletter, Technical Trading Mastery book, and 3 Hour Trading Video Course are designed for both traders and investors. Also, some of our strategies have been fully automated for the ultimate trading experience.

RECENT CLOSED TRADES

Chris Vermeulen
Technical Traders Ltd.

By TheTechnicalTraders.com

Forex Technical Analysis & Forecast 08.03.2019 (EURUSD, GBPUSD, USDCHF, USDJPY, AUDUSD, USDRUB, GOLD, BRENT)

Article By RoboForex.com

EURUSD, “Euro vs US Dollar”

EURUSD continues moving downwards without any corrections. The key target of the wave is at 1.1100. Possibly, today the pair may be corrected to test 1.1202 from below. Later, the market may start a new decline towards 1.1140.

EURUSD
Risk Warning: the result of previous trading operations do not guarantee the same results in the future

GBPUSD, “Great Britain Pound vs US Dollar”

GBPUSD has broken 1.3100 downwards. Today, the pair may fall to break 1.3070 and then continue moving downwards to reach 1.3030.

GBPUSD
Risk Warning: the result of previous trading operations do not guarantee the same results in the future

USDCHF, “US Dollar vs Swiss Franc”

USDCHF has broken 1.0080 upwards; right now, it is still growing. Today, the pair may continue trading upwards to reach 1.0133 and then form one more descending structure to return to 1.0080. After that, the instrument may start a new growth towards 1.0163.

USDCHF
Risk Warning: the result of previous trading operations do not guarantee the same results in the future

USDJPY, “US Dollar vs Japanese Yen”

USDJPY has reached the target at 111.37; right now, it is trading downwards. Possibly, the pair may form a downside continuation pattern at 111.37. The target is at 110.97.

USDJPY
Risk Warning: the result of previous trading operations do not guarantee the same results in the future

AUDUSD, “Australian Dollar vs US Dollar”

AUDUSD is trading downwards to reach 0.6926. Later, the market may be corrected to the upside with the target at 0.7000 and then resume trading inside the downtrend towards 0.6840.

AUDUSD
Risk Warning: the result of previous trading operations do not guarantee the same results in the future

USDRUB, “US Dollar vs Russian Ruble”

USDRUB has reached 66.12. Possibly, today the pair may fall towards 65.87 and then continue growing with the target at 66.20.

USDRUB
Risk Warning: the result of previous trading operations do not guarantee the same results in the future

XAUUSD, “Gold vs US Dollar”

Gold is still consolidating in the middle of the range. If later the price breaks this range to the upside, the instrument may grow to reach 1298.60; if to the downside – resume trading inside the downtrend with the target at 1276.80.

GOLD
Risk Warning: the result of previous trading operations do not guarantee the same results in the future

BRENT

Brent is moving downwards to reach 63.95. After that, the instrument may resume growing with the target at 68.40 and then start a new correction towards 57.07.

BRENT

Article By RoboForex.com

Attention!
Forecasts presented in this section only reflect the author’s private opinion and should not be considered as guidance for trading. RoboForex LP bears no responsibility for trading results based on trading recommendations described in these analytical reviews.

Fibonacci Retracements Analysis 08.03.2019 (BITCOIN, ETHEREUM)

Article By RoboForex.com

BTCUSD, “Bitcoin vs US Dollar”

As we can see in the H4 chart, the correction is slowing down. After reaching the retracement of 61.8%, BTCUSD is trying to form a new rising wave; the first upside target is the high at 4188.40. After breaking the high, the instrument may continue growing towards the post-correctional extension area between the retracements of 138.2% and 161.8% at 4393.00 and 4519.00 respectively. The next downside target may be the retracement of 76.0% at 3543.00. The key support is the low at 3121.90.

BTCUSD1
Risk Warning: the result of previous trading operations do not guarantee the same results in the future

In the H1 chart, the pair is being corrected upwards and has already reached the retracement of 38.2%. The next targets are the retracements of 50.0%, 61.8%, and 76.0% at 3921.00, 3986.00, and 4059.00 respectively. The local support is the low at 3652.60.

BITCOIN
Risk Warning: the result of previous trading operations do not guarantee the same results in the future

ETHUSD, “Ethereum vs. US Dollar”

As we can see in the H4 chart, after reaching the retracement of 61.8%, the pair started a new pullback to the upside. The target is the high at 166.04. In case the price resumes falling, the next target will be the retracement of 76.0% at 115.90.

ETHUSD
Risk Warning: the result of previous trading operations do not guarantee the same results in the future

In the H1 chart, ETHUSD is being corrected upwards and has already reached the retracement of 23.6%. The next targets are the retracements of 38.2% and 50.0% at 141.67 and 146.30 respectively.

ETHEREUM

Article By RoboForex.com

Attention!
Forecasts presented in this section only reflect the author’s private opinion and should not be considered as guidance for trading. RoboForex LP bears no responsibility for trading results based on trading recommendations described in these analytical reviews.

Strong Historical Probability of NG Long Trades Setting Up

By TheTechnicalTraders.com

Would you believe that March and April, historically, shows a 2 to 1 statistical probability of NG moving higher.  Each of these months shows, historically, that NG has a strong potential for at least a $1.00 upside price move in both March and April.  Only 1/3 of the historically testing time (23 years) did the price of NG actually decrease.

How do we know this?  We’ve built proprietary price modeling and data modeling solutions that allow us to isolate and verify this data.  This data was tested on a Monthly price basis for the statistics we’ve provided, above.  When we run this same test on Weekly data, the results continue to support our conclusions.

The weekly historical data analysis for March shows a 53 to 46 positive price advantage with an average of $0.99 upside advantage over 99 tested weeks.  The weekly historical data analysis for April shows a 58 to 45 positive price advantage with an average of $0.89 upside advantage over 103 tested weeks.

Although the Weekly data is not as overwhelming in terms of positive to negative weekly results, the overall results still support the Monthly data – resulting in nearly a $1.00 upside price advantage.  Therefore, we believe any price rotation down in Natural Gas near recent lows, below $2.70, would be an excellent opportunity to take long positions with an upside target between $3.10 and $3.35.  We are not attempting to target the full $1.00 potential upside because we want to target safer, quicker upside objectives – not the lower probability targets.  In doing so, targeting a $0.40 to 0.60+ range allows us to execute very high probability objectives and trade almost like a “sniper”.  Get in, get our target and GET OUT.

If you want to see recent trade we closed on natural gas take a look at this post which I think you will agree is nothing short of simple and awesome!

We believe the current Buy Zone in NG is below $2.70.  Once price rotates a bit lower, any entry near the $2.70 level or lower would be an excellent entry level for skilled traders.  Our targets would be anything north of $3.00.  Ideally, we would pull half of our trade-off as soon as the price reached above $3.00 and pull the second half off when prices reached above $3.20 or $3.25.

Remember, we’re showing you that the months of March and April share this upside price advantage.  This means there is a higher probability of upside price moves throughout March & April in NG and all we have to do is find the strategic entry points and “run our trades”.  Get ready for some great trading opportunities this year and pay attention to NG.  Remember, you can trade the ETFs for Natural Gas as well.

If you want to join a group of professional traders, researchers, and friends, take a look at our trading newsletter to learn how we can help you find and execute better trades each month.  We believe 2019 and 2020 will be incredible years for skilled traders and we are executing at the highest level we can to assist our members.  In fact, we are about to launch our newest technology solution to better assist our members in creating future success.

Our team has 53 years of experience in researching and trading makes analyzing the complex and ever-changing financial markets a natural process. We have a simple and highly effective way to provide our customers with the most convenient, accurate, and timely market forecasts available today. Our stock and ETF trading alerts are readily available through our exclusive membership service via email and SMS text. Our newsletter, Technical Trading Mastery book, and 3 Hour Trading Video Course are designed for both traders and investors. Also, some of our strategies have been fully automated for the ultimate trading experience.

Chris Vermeulen
TheTechnicalTraders.com