The Brent crude prices are not moving very much early this week, with the black gold consolidating near $67.25. Previously, it tested the local high at $68.14. The fundamentals are meanwhile signaling a bullish scenario.
Baker Hughes reported the US oil rig count Friday; the number declined by one, staying at 1,026; the oil derrick count also decreased by 1, while the gas derrick count remained unchanged. The oil rig count is meanwhile at its low since April 2018, with the number reduced by 11 a week ago. This may mean either that the US overestimated the crude oil demand or that the rig performance is not effective.
The EIA, meanwhile, reported an oil production decline last week; namely, the production was reduced by 100K barrels per day, reaching 12M barrels. This is not far from the historical high, while the target is at 12.30M. The demand for energies is not rising so far, and what the US is going to do with such large production amounts yet remains to be seen.
The crude oil production in Libya is rising, but the markets are not much interested in this news, as Libya’s share in the total production volume is very much low.
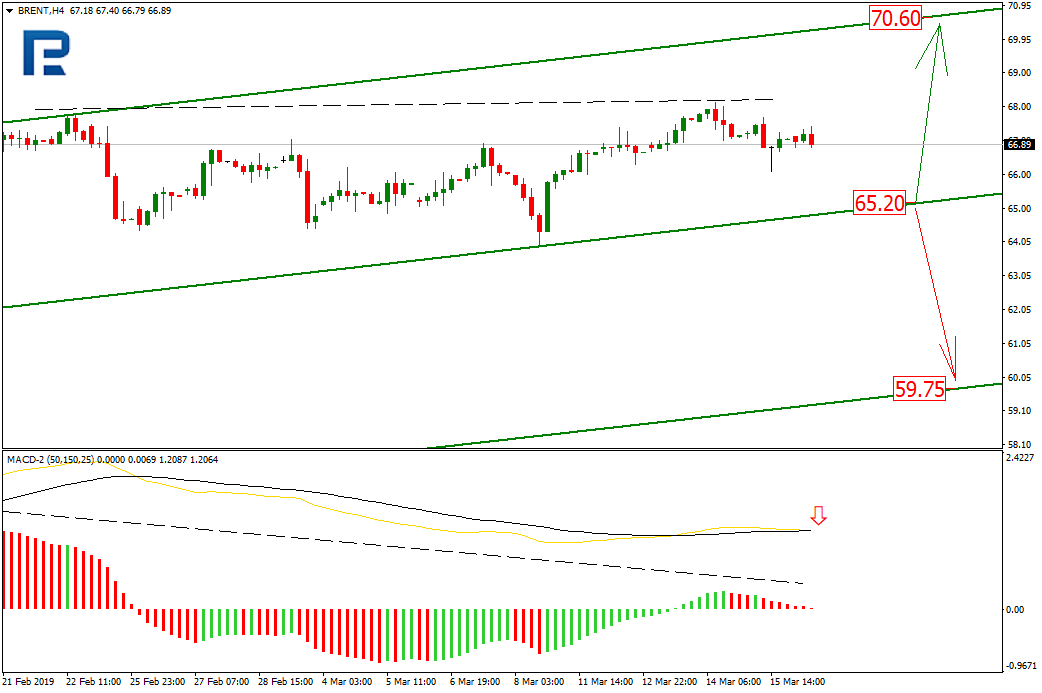
The latest rising move in crude not only supported the overall ascending trend, but also made the MACD diverge, which may signal a pullback or even a reversal is near. The immediate target is at the current channel support, $65.20, followed by either another rising move or the support test. In case of a bounce, the crude will be sent to the resistance at $70.60, while the support breakout will push it down to $59.75. The latter scenario may get confirmed in case the MACD forms a black cross.
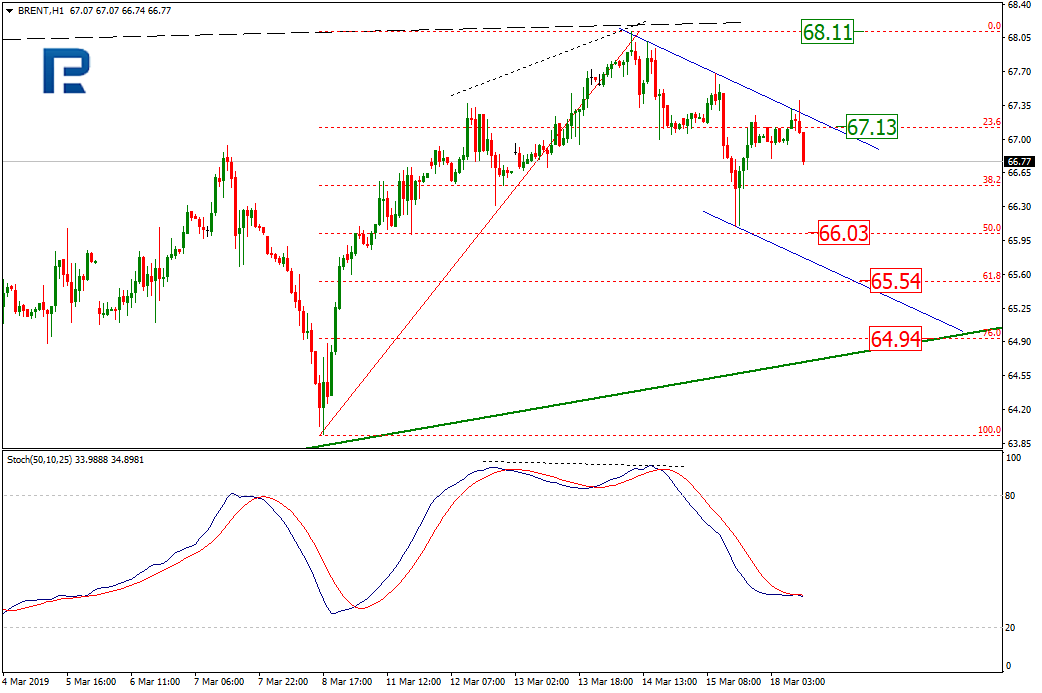
On H1, Brent is going down after the Stochastic divergence. The immediate targets lie at 50%, 61.80%, and 76% Fibo, or $66.03, $65.54, and $64.94, respectively.
Disclaimer
Any predictions contained herein are based on the authors’ particular opinion. This analysis shall not be treated as trading advice. RoboForex shall not be held liable for the results of the trades arising from relying upon trading recommendations and reviews contained herein.
The EURUSD is consolidating, the price currently trading near the upper boundary. Today, the pair may go down to reach 1.1294; then, it is likely to rise to 1.1320, and then again fall to 1.1250, i.e. a local target.
GBPUSD
The GBPUSD is consolidating around 1.3265; currently, the price is being pushed upwards, which may send the pair to 1.3341. The major scenario is, however, a fall to 1.3155, which is going to be the first target.
USDCHF
The USDCHF is consolidating, currently trading near the lower boundary. Today, it may correct to the upper one ans reach 1.0050, and then, after breaking it out, may go further up to 1.0160, which is going to be the first target.
USDJPY
The USD/JPY is trading within the second downward wave, with the correction target at 111.65. After that the pair is likely to get down to 111.24, which is going to be the first target.
AUDUSD
The Aussie has reached the correction target at 0.7104 and almost formed a triangle. Once the price breaks it out bottom up, the price may form a new downward pattern headed to 0.6975, i.e. a local target.
USDRUB
The USD RUB completed yet another downward pattern reaching 65.13; this is just a half of the total falling potential, though. Today, the pair may start consolidating, and then continue falling to 63.65.
GOLD
The gold left the correction channel and is falling today, perhaps trying to reach $1,292.63, and then, once a breakout occurs, to hit $1,279.96, i.e. a local target.
BRENT
The Brent crude bounced off $66.05 and is headed towards $68.40, which may get hit today. After that the crude is likely to get down to $66.66.
Attention! Forecasts presented in this section only reflect the author’s private opinion and should not be considered as guidance for trading. RoboForex LP bears no responsibility for trading results based on trading recommendations described in these analytical reviews.
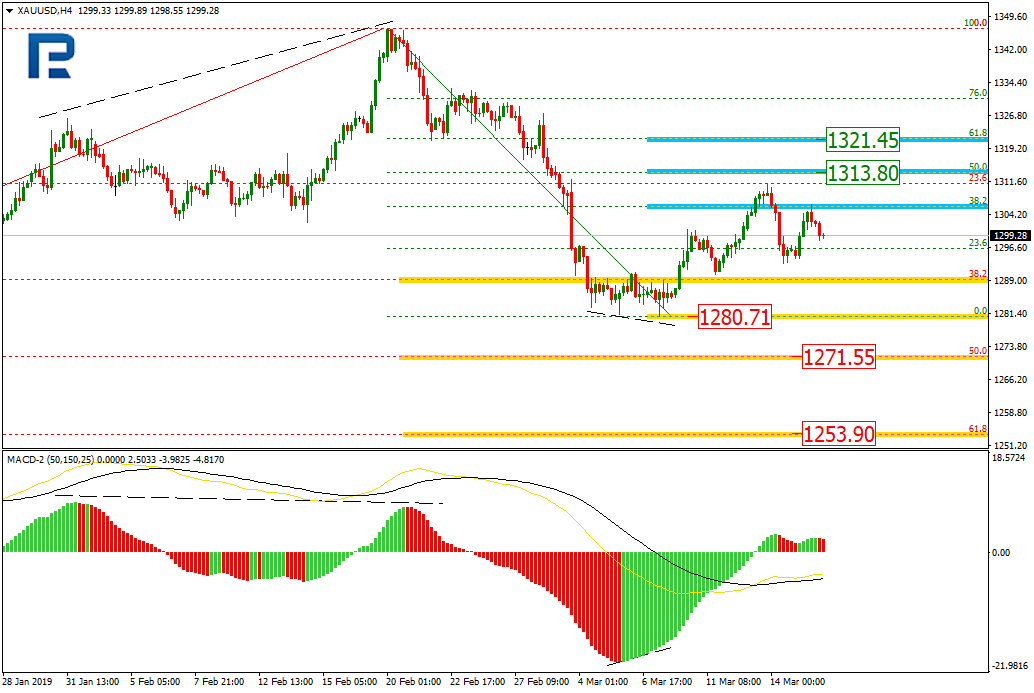
On H4, the correction uptrend reached 38.20% Fibo and then started fading out. In another uptrend stage forms, the targets will lie at 50% and 61.80% Fibo, or $1,313.80 and $1,321.45, respectively. If a downtrend is starting, however, then the price will first hit the local low at $1,280.71, and then may head towards 50% and 61,80%, or $1,271.55 and $1,253.90.
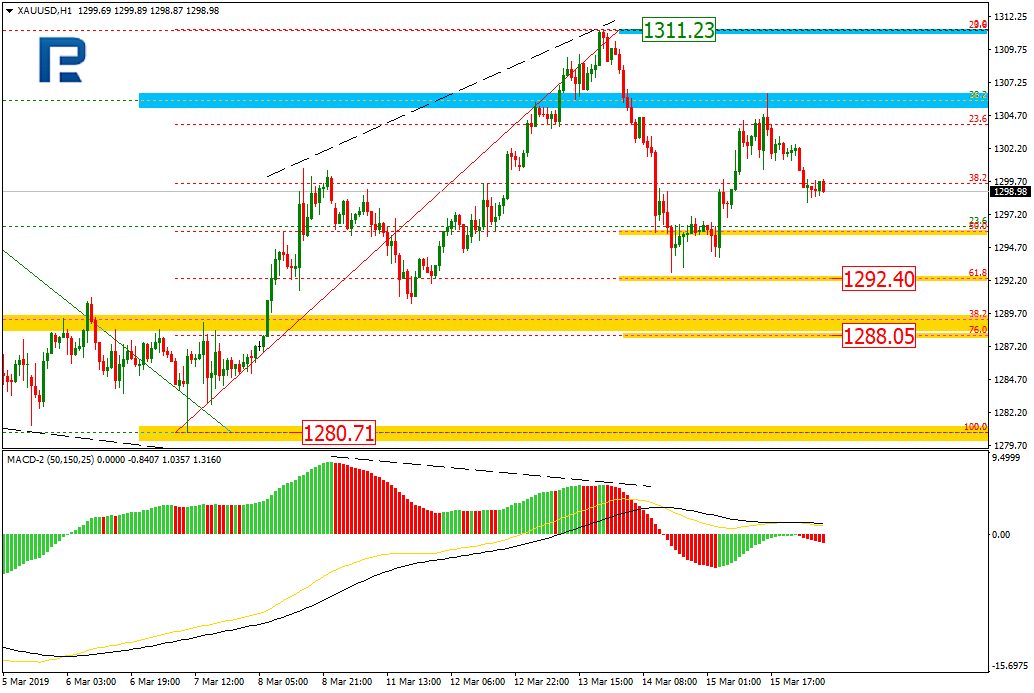
On H1, the Gold is pulling back after a correctional downside move. The targets may lie at 61.8% and 76.0% Fibo, or $1,292.40 and $1,288.05, respectively. The major resistance is at $1,311.23.
USDCHF
On H4, the USDCHF is experiencing a downmove inside a midterm correction. The move targets 50% Fibo, or 0.9882, but this one may be reached only once the low at 0.9926 gets broken out. The resistance is meanwhile at the 1.0149 high.
On H1, the USDCHF is downtrending, falling towards 61.80% (1.0002) and 76% (0.9974) Fibo. The indicator is converging, which means the downtrend may end soon. The high at 1.0124 acts as a resistance.
Attention! Forecasts presented in this section only reflect the author’s private opinion and should not be considered as guidance for trading. RoboForex LP bears no responsibility for trading results based on trading recommendations described in these analytical reviews.
EUR/USD is in a bullish mood. Right now EUR is consolidating around the monthly maximums. The trading instrument is testing the local resistance at 1.13500. 1.13250 acts as a mirror support. The US is publishing weak economic releases, which puts pressure on the American currency. This week, the Federal Reserve will have a meeting regarding new intel on the further increase of interest rates. Earlier the Fed representatives mentioned that the Reserve won`t pursue this increase. You should open positions from the key levels.
The Economic News Feed for 18.03.2019 is calm. At 12:00 (GMT+2:00) the EU will publish the report on the trading balance.
The price fixed above 50 MA and 200 MA which points to the power of the buyers.
The MACD histogram is in the positive zone and keeps rising, which gives a signal to buy EUR/USD.
The Stochastic Oscillator is in the overbought zone, the %K line is crossing the %D line. There are no signals at the moment.
Trading recommendations
Support levels: 1.13250, 1.13000, 1.12800
Resistance levels: 1.13500, 1.14000
If the price fixes above the local resistance of 1.13500, expect the quotes to grow toward 1.14000..
Alternatively, the quotes can descend toward 1.13000-1.12800.
The GBP/USD currency pair
Technical indicators of the currency pair:
Prev Open: 1.32608
Open: 1.32955
% chg. over the last day: +0.38
Day’s range: 1.32560 – 1.32997
52 wk range: 1.2438 – 1.4378
GBP/USD stablilized after the surge of volatility last week. The House of Commons did not approve the new deal regarding Brexit and decided to ask for a delay. Right now the key support and resistance lvels are 1.32200 and 1.33000. The financial market participants are waiting for the new intel regarding Brexit. You should open positions from the key levels.
The Economic News Feed for 18.03.2019 is calm.
The indicators do not provide precise signals, the price has crossed 50 MA.
The MACD histogram is in the positive zone but below the signal line which gives a weak signal to buy GBP/USD.
The Stochastic Oscillator is in the neutral zone, the %K line is crossing the %D line. There are no signals at the moment.
Trading recommendations
Support levels: 1.32200, 1.31500, 1.30600
Resistance levels: 1.33000, 1.33600
If the price fixes above the round 1.33000, expect the quotes to grow toward 1.33500-1.33750.
Alternatively, the quotes can fall toward 1.32000-1.31500.
This article reflects a personal opinion and should not be interpreted as an investment advice, and/or offer, and/or a persistent request for carrying out financial transactions, and/or a guarantee, and/or a forecast of future events.
USD/CAD has an ambiguous technical picture. The CAD is being traded in a flat. Right now the local support and resistance levels are 1.33000 and 1.33300. The quotes have a tendency to descend further. You should keep an eye on the oil quotes dynamic and open positions from the key levels.
The Economic News Feed for 18.03.2019 is calm.
The indicators do not provide precise signals, the price is testing 50 MA.
The MACD histogram is in the negative zone, the %K line is above the %D line which points towards the fall of USD/CAD.
The Stochastic Oscillator is in the neutral zone, the %K line is above the %D line which points toward a bullish mood.
Trading recommendations
Support levels: 1.33000, 1.32750, 1.32500
Resistance levels: 1.33300, 1.33600, 1.33900
If the price fixes below the round 1.33000, expect the quotes to fall toward 1.32700-1.32500.
Alternatively, the quotes can grow toward 1.33500-1.33700.
The USD/JPY currency pair
Technical indicators of the currency pair:
Prev Open: 111.655
Open: 111.466
% chg. over the last day: -0.22
Day’s range: 111.450 – 111.629
52 wk range: 104.56 – 114.56
USD/JPY remains ambiguous. The trading instrument keeps consolidating around 111.400-111.650. The USD remains under pressure, the quotes can descend further. Keep an eye on the US Treasury bonds` yield and open positions from the key levels.
During the Asian trading session Japan published mixed trading balance reports.
The indicators do not provide precise signals, the price has crossed 50 MA and 200 MA.
The MACD is in the negative zone but above the signal line, which gives a weak signal to sell USD/JPY.
The Stochastic Oscillator is in the neutral zone, the %K line is crossing the %D line. There are no signals at the moment.
Trading recommendations
Support levels: 111.400, 111.150, 110.900
Resistance levels: 111.650, 111.850, 112.100
If the price fixes below 111.400, expect the quotes to fall toward 111.000-110.800.
Alternatively, the quotes can grow toward 111.850-112.000.
It’s been years since the gold and silver topped out in 2011. We have been waiting for a new bottom form and a new bull market to emerge for nearly 8 years. In this article, I’m going to compare palladium, gold, platinum, and silver and show you which of these precious metals I feel is the best long-term investment and also the best trade for 2019.
The analysis presented below is based on technical analysis using previous significant highs, and Fibonacci extensions. Both of these techniques work exceptionally well for predicting price targets both to the upside and also price corrections to the downside. If you have never used Fibonacci retracement or extensions in your trading I highly recommend learning more about them. I have no doubt it will improve your market price projection targets for your investments. I have found this technique to be the number one best trading tool for projecting future price movements in all asset classes.
The charts below will show to price forecasts for each metal. The first price target is based on the previous significant high that price made between 2000 and the current timeframe. Previous significant highs are typically the first target for the price to reach and that is also our first major upside target for these metals. The second price target I use is based on Fibonacci extensions using stand out lows formed anywhere between 2002 to the current price time and projecting that forward into the future beyond the previous highs shown on the charts.
So let’s get started with the worst precious metal to invest in and work your way down to the best precious metal.
#4 PALLADIUM
Palladium, In my opinion, is the worst precious metal to own for 2019. While palladium is used in everything from dentistry to groundwater treatment, Palladium is by far the most versatile precious metal. Only a little while ago palladium was not nearly as popular as it is today due to the incredible economic growth in developing countries especially China. This multi-use metal is steadily growing its importance in the markets hence the strong performance to date.
There is no doubt that Palladium has staged a massive rally from the 2009 lows and also another mega-rally from the 2016 low. But, knowing the best performing investments eventually become the worst performing investments later, let’s take a look at the chart of Palladium and see why I feel as though Palladium is the worst investment metal for 2019.
The monthly chart of Palladium below shows the previous high in price in the year 2000. That high has been broken and now the price has gone parabolic blasting above that level to the 1550 mark. At this point, the previous high target has been breached and we no longer see that as a price target. There is zero upside potential based on the previous high.
The second price target is based off the lows in 2016 using the Fibonacci extension the pullback in 2018 followed by this recent rally. This gives us a price projection of nearly $1500 an ounce. As you can see this perfect bull flag (continuation pattern) has reached the hundred percent Fibonacci measured target of 1500. Therefore I see this upside move as being complete and it is more likely to pull back and correct in 2019 with 0% upside potential. Anything beyond this price level is a bubble which could burst at any time and carries a high level of downside risk.
#3 GOLD
Gold is the second worst investment for 2019 when it comes to precious metals in my opinion based on potential upside growth. Keep in mind I am very bullish on the price of gold looking forward but other metals definitely have a lot more profit potential than gold.
As you can see on the monthly chart of gold the previous high was about $1900 in 2011. That level is our first price target for gold upon a breakout of this multiyear basing formation it has been forming since 2013. This makes for a potential gain of 46% in price.
Now if we apply a Fibonacci extension to get our second target we take the low from 2002 to the high in 2011 and bring it back down to the low in 2015. This gives us an upside price target of $2681 an ounce. Based at the current price of gold we could see gold rally 106% over the next year or two.
#2 PLATINUM
Platinum is the second best metal for short-term and long-term gains from 2019 and beyond. Looking at the monthly chart you can see the previous high in 2008 was around $2300 based on the current price if we get a move to the previous high it provides a 176% potential gain. Also, notice how the price is testing the major support level forms in 2008 this could act as a very significant double bottom in price as well.
Using Fibonacci extensions we take 2001 low up to 2008 high and back down to the recent low in 2018 or 2009 both are the same price this projected price gives us an upside target of $2659 an ounce. Based on the current price of platinum that gives us the 221% potential gain over the next couple of years.
#1 SILVER
The number one precious metal to own in 2019 and beyond is silver. Based on the previous high in 2011 and looking at the current price of silver there is a potential upside gain of 226%. Also, notice how silver is putting in a potential double bottom from the 2015 lows it also goes all the way back on the chart to 2006 through 2010 as a key support zone. Much like platinum, silver is at support and could very easily start a new mega-rally at any time.
Using a Fibonacci extension, we can get our second target for silver based on 2002 low and 2011 high along with the 2015 bottom. This gives us a $59 price target. With the current price of silver trading at $15 an ounce, there is an upside target of 296% potential gain over the next couple of years when silver starts its next bull market. In fact, I recently purchased a couple more silver bars from SDBullion to add to my silver stacks because I like the potential.
CONCLUSION:
In short, I feel precious metals should be a part of everyone’s portfolio as a long-term hedge and investment. I see precious metals as an insurance policy in case all hell breaks loose in the financial system and we need to fall back to something with physical value for a short period of time.
With that said, I am a firm believer that you should never overload in one particular investment or asset class. But I do feel certain metals should have a heavier weighting based on their current potential. The more upside potential the more of that metal you should own shares or physical bullion.
How should you invest and trade precious metals? There are a few ways to own metals as a trader and investor. You can own physical bullion rounds or bars and I don’t recommend coins simply because you pay a premium for a design and if metals ever do become a true currency the added value you paid for a design stamped in the metal will be tossed out the window and you lose that value as price will be based purely on weight.
A really simple way to trade and invest in metals are trading the ETFs for each bullion like Gold (GLD), Silver (SLV), Platinum (PLTM), and Palladium (PALL). Another and even more simple way is to own the GLTR fund which owns a basket of Gold, Silver, Platinum, and Pallium. Obviously owning precious metals mining stocks is another (GDX, GDXJ, JNUG, NUGT etc..)
If you want to join a group of professional traders, researchers, and friends, take a look at our trading newsletter to learn how we can help you find and execute better trades each month. We believe 2019 and 2020 will be incredible years for skilled traders and we are executing at the highest level we can to assist our members. In fact, we are about to launch our newest technology solution to better assist our members in creating future success.
Our team has 53 years of experience in researching and trading makes analyzing the complex and ever-changing financial markets a natural process. We have a simple and highly effective way to provide our customers with the most convenient, accurate, and timely market forecasts available today. Our stock and ETF trading alerts are readily available through our exclusive membership service via email and SMS text. Our newsletter, Technical Trading Mastery book, and 3 Hour Trading Video Course are designed for both traders and investors. Also, some of our strategies have been fully automated for the ultimate trading experience.
On Friday, the US dollar weakened slightly against a basket of major currencies. Ambiguous data on the US economy were published. Thus, the number of JOLTS job openings increased to 7,581M in January, while experts expected 7,310M. However, the volume of industrial production increased by only 0.1% in February instead of the expected growth by 0.4%. The US currency is under pressure due to a decline in the US government bonds yield. The dollar index (#DX) closed the trading session in the negative zone (-0.18%).
This week, investors will be focused on trade relations between the US and China. As it became known, a meeting between US President Donald Trump and Chinese President Xi Jinping to sign the final trade agreement may be rescheduled for June, although it was previously planned to be signed in April. Financial market participants expect the Fed, the Swiss National Bank and the Bank of England meetings. It is expected that the regulator will keep the key marks of monetary policy at the same level.
Investors are still focused on the situation concerning Brexit. On Thursday, March 21, the EU summit will start, at which representatives should vote for the Brexit delay.
The “black gold” prices have moved away from local highs. At the moment, futures for the WTI crude oil have approached $58.50 per barrel.
Market Indicators
On Friday, purchases prevailed in the US stock market: #SPY (+0.05%), #DIA (+0.31%), #QQQ (+0.93%).
The 10-year US government bonds yield has decreased. Currently, the indicator is at the level of 2.59-2.60%.
The news feed on 18.03.2019:
Today, the publication of important economic news is not expected. At 12:00 (GMT+2:00) data on the trade balance of the Eurozone will be published.
On Friday the 15th of March, trading on the euro closed slightly up (+0.18%). Trading on the EURUSD pair was mixed throughout all the day’s trading sessions. Volatility was high in the US session, during which the euro rose to 1.1344 as a result of weak US economic data dragging the dollar down.
Data released showed a drop in production in the US in February for the second month running, while manufacturing activity in New York was weaker than expected. For the US Fed, this data is indicative of an economic slowdown in the US. The regulator could make adjustments to its monetary policy based on these figures.
Day’s news (GMT+3):
13:00 Eurozone: trade balance (Jan).
14:00 Germany: German Buba monthly report.
15:30 Canada: foreign portfolio investment in Canadian securities (Jan), Canadian portfolio investment in foreign securities (Jan).
17:00 US: NAHB housing market index (Mar).
23:00 NZ: Westpac consumer survey (Q1).
Current situation:
Friday’s reversal points matched my forecast line in terms of timing, but not in terms of amplitude. Weak US data shifted market sentiment towards risky assets, for which demand has remained up to the time of writing. All the majors are trading up against the dollar except for the yen.
On Friday, I made a forecast going up to the 19th of March. During the phase of decline, the bulls managed to successfully defend 1.13. The breakout of the trend line turned out to be false. I’ve left my old forecast on the chart. Until the pair breaks the 135th degree, there’s still a risk of sliding to 1.1260
I’ve drawn a line through the highs at 1.1388 and 1.1344, and drawn a parallel line below through 1.1294. Today, I expect price movements to remain above the trend line and below 1.1350.
The rebound from 1.1300 has increased the chances of a breakout of 1.1350, with subsequent growth to 1.1376. The pair is rising without trading volume. If significant volume appears on the current hour, it will signify that traders are cashing in on their positions and this will mark the beginning of a correction. My forecast includes a rebound, but you should bear in mind that these are my expectations of a reversal. If the pair doesn’t drop during the phase of decline, it should start dropping after 14:00 EET.
In the previous two segments of this research post PART I, PART II, we’ve hypothesized that the recent Chinese economic data and the resulting global shift to re-evaluate risk factors within China/Asia are prompting global traders/investors to seek protective alternative investment sources. Our primary concern is that a credit/debt economic contraction event may be on the cusp of unfolding over the next 12~24 months in China/Asia. It appears that all of the fundamental components are in place and, unless China is able to skillfully navigate through this credit contraction event, further economic fallout may begin to affect other global markets.
One key component of this credit crisis event is the Belt Road Initiative (BRI) and the amount of credit that has been extended to multiple foreign nations. We don’t believe China will run out money by the end of March and we don’t believe any crisis event will come out of nowhere to land in China within a week or two. Our concern is for an extended downturn to decrease economic opportunity by 5~12% each year for a period of 4~7+ years. It is this type of extended economic slowdown that can be the most costly in terms of political and economic opportunity. An extended downturn in the Chinese and Asian economies would create revenue, credit, debt, and ongoing social servicing issues.
As we explore this concept of an extended economic downturn, we need to consider the BRI projects and obligations. China has committed to invest $1 trillion into the BRI and it is estimated that the infrastructure projects throughout Asia will require $26 trillion over the next decade. Our opinion is that the total investment required to complete this transition and truly open economic opportunity within the BRI will require an expanding global economy without any fear of an economic downturn. We believe even a mild Chinese/Asian economic contraction event could dramatically alter the longer term objectives of the BRI and put many “at risk” projects in jeopardy.
The potential for an immediate downward price swing in the Chinese/Asian stock market related to these recent economic data points. The reality is that the Chinese economy is contracting much faster than nearly anyone expected. The longer the US/China trade issues continue, the more likely it is this contraction event will continue. At some point in the near future, consumers will move towards more of a protectionist stance where extended consumer spending will contract. At that point, the Chinese economy will have entered a type of “death spiral” where the race to the bottom persists.
We believe the immediate downward price move in the Chinese/Asian stock market may only last a month or so before finding some price support. Over time, the constraints of a slowing local and regional economy may prove to be much more than China is capable of handling long term. Much like the US 2008-09 credit crisis, the collapse of the credit market, when it reaches a disorderly contraction, becomes a very dangerous event. As long as this economic contraction continues in an orderly manner, we may continue to see extended price weakness. If this continues over a lengthy period, we may see price weakness throughout many other regional markets – such as India, Pakistan, Malaysia, Singapore, and others.
We believe the Asian region will experience continued weakness over the next few months as further downside rotation drives prices lower while credit, debt and trade issues are resolved. It is our opinion that China/Asia will continue to struggle to attain real economic growth over this period and that further price weakness will become evident over the Spring months. Causing investors to seek shelter elsewhere. Our cycle analysis suggest mid April or early May as dates that align with such a move. This correlates with our projections for Gold and Silver in terms of some type of market crisis driving Gold and Silver prices much higher.
At this point, skilled traders and investors should be watching for signs that some type of external event may be unfolding that we are currently unaware of. Some type of event appears to be ready to unfold that will drive equity prices lower while pushing Gold and Silver prices higher. Our belief that it could be some type of China/Asia contagion leads us to believe that a downside price rotation could be nearing for the Asian markets.
Watch how this plays out over the next 30+ days. We only have about 30~40 days before we should have more clarity about this crisis event and we should be using this time to prepare for and protect our investments. We’ll keep you informed by providing more research and updates as we see need to alert you.
If you want to join a group of professional traders, researchers, and friends, take a look at our trading newsletter to learn how we can help you find and execute better trades each month. We believe 2019 and 2020 will be incredible years for skilled traders and we are executing at the highest level we can to assist our members. In fact, we are about to launch our newest technology solution to better assist our members in creating future success.
Our team has 53 years of experience in researching and trading makes analyzing the complex and ever-changing financial markets a natural process. We have a simple and highly effective way to provide our customers with the most convenient, accurate, and timely market forecasts available today. Our stock and ETF trading alerts are readily available through our exclusive membership service via email and SMS text. Our newsletter, Technical Trading Mastery book, and 3 Hour Trading Video Course are designed for both traders and investors. Also, some of our strategies have been fully automated for the ultimate trading experience.
Two “meaningful” votes, one ‘no-deal’ vote and countless hours of debate has seen the Commons finally agree on one thing – a need for an extension of Article 50.
This had been the base case of our GBP trade and as expected Cable rocketed higher over the three days of voting. The question from a GBP point of view is what now for Brexit and what’s the trade?
First and foremost, I still hold a bullish view of GBP, the ‘Brexit’ discount in EUR/GBP is of particularly interest and one that catches most of my attention. So, although the ‘scheduled’ March events of Brexit are (for now) over. There is still so much to look forward too.
Thus, what are the possible permutations on Brexit now?
With Article 50 now extended the rolling survey by Bloomberg of the global investment banks have Brexit moving towards ‘softer outcomes.’ i.e. customs union, single market membership et. al. Before Thursday’s vote a soft outcome included a second referendum however that was voted down by Parliament.
With the Second Referendum gone – there are some risk events that need to be taken into account the main one being the prospect of a general election. This would put the Brexit timeline into disarray and a huge downside GBP risk event.
However, what is currently being priced as the most likely permutation on Brexit is a ‘Third Meaningful Vote’ (a fairly large watered-down version of the current Withdrawal Agreement) with Brexit signed off by June.
There is a caveat here – Brussels. It has to first sign off on the extension and that means agreeing to pushing Article 50 out past its May European Parliamentary Elections. The catch here is how do they have the election when technically the UK will still be part of the union? Again, this has a GBP downside risk component.
Putting all the caveats to one side and Brexit continues to play out as expected EUR/GBP in my view is heading into low-80s as the Brexit shock of the past three years filters out.
The latest update for the weekly Commitment of Traders (COT) report was released by the Commodity Futures Trading Commission (CFTC) on Friday for data ending on Tuesday March 12th.
This weekly Extreme Positions report highlights the Top 5 Most Bullish and Top 5 Most Bearish Positions for the speculator category. Extreme positioning in these markets can foreshadow strong moves in the underlying instrument.
To signify an extreme position, we use the COT Index of each instrument, which has been a common method among many leading COT practitioners. The COT Index is simply a comparison of current trader positions against the range of positions over the previous 3 years. We use over 80 percent as extremely bullish and under 20 percent as extremely bearish. (Compare COT Index scores across all markets in the data tables in our Premium Edition)
* Some weeks there will be less than 5 top extreme scores, however, we fill out the top 5 with the next most bullish or bearish markets.
Speculators or Non-Commercials Notes:
Speculators, classified as non-commercial traders by CFTC, are made up of large commodity funds, hedge funds and other significant for-profit participants. The Specs are generally regarded as trend-followers in their behavior towards price action – net speculator bets and prices tend to go in the same directions. These traders often look to buy when prices are rising and sell when prices are falling. To illustrate this point, many times speculator contracts can be found at their most extremes (bullish or bearish) when prices are also close to their highest or lowest levels.
These extreme levels can be dangerous for the large speculators as the trade is most crowded, there is less trading ammunition still sitting on the sidelines to push the trend further and prices have moved a significant distance. When the trend becomes exhausted, some speculators take profits while others look to also exit positions when prices fail to continue in the same direction. This process usually plays out over many months to years and can ultimately create a reverse effect where prices start to fall and speculators start a process of selling when prices are falling.
Here Are This Week’s Most Bullish Speculator Positions:
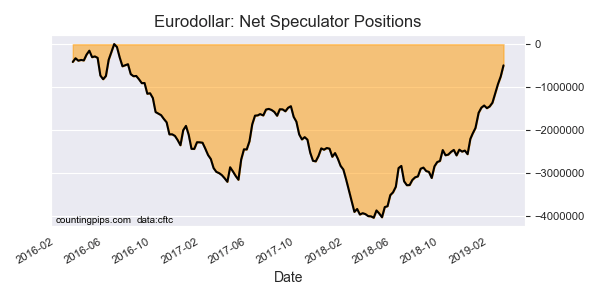
Eurodollar
The Eurodollar speculator trader’s futures position comes in as the most bullish extreme standing this week. The Eurodollar speculator level is currently at a 88 percent score of its 3-year range.
The speculator position totaled -493,337 net contracts this week which was a change by 258,514 contracts from last week. The speculator long position was a total of 1,215,243 contracts compared to the total spec short position of 1,708,580 contracts.
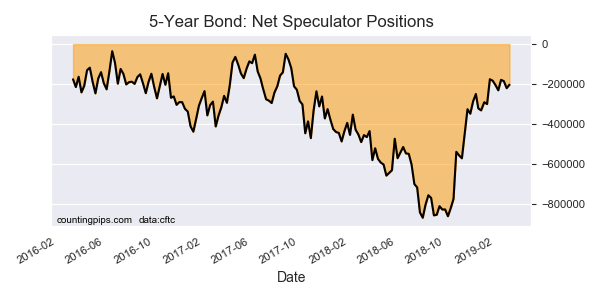
5-Year Bond
The 5-Year Bond speculator trader’s futures position comes next in the extreme standings this week. The 5-Year speculator level is now at a 80 percent score of its 3-year range.
The speculator position was -203,008 net contracts this week, a change by 17,212 contracts from last week. The speculator long position was a total of 775,237 contracts versus the total speculator short position of 978,245 contracts.
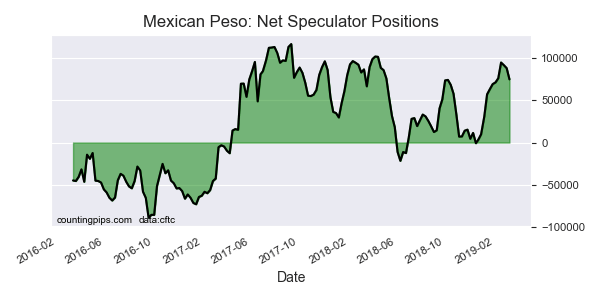
Mexican Peso
The Mexican Peso speculator trader’s futures position comes in third this week in the extreme standings. The MXN speculator level resides at a 80 percent score of its 3-year range.
The speculator position was 75,096 net contracts this week which marked a change by -13,322 contracts from last week. The speculator long position was a total of 177,252 contracts versus the total speculator short position of 102,156 contracts.
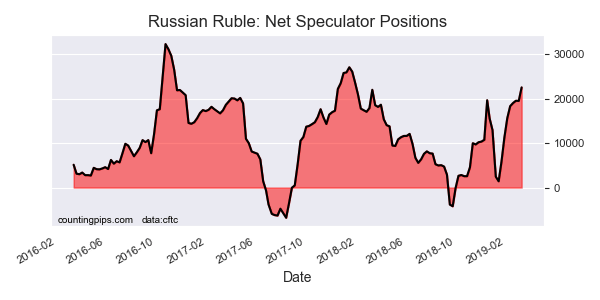
Russian Ruble
The Russian Ruble speculator trader’s futures position comes up number four in the extreme standings this week. The RUB speculator level is at a 75 percent score of its 3-year range.
The speculator position was 22,577 net contracts this week and changed by 3,041 contracts from last week. The speculator long position was a total of 35,636 contracts against the total spec short position of 13,059 contracts.
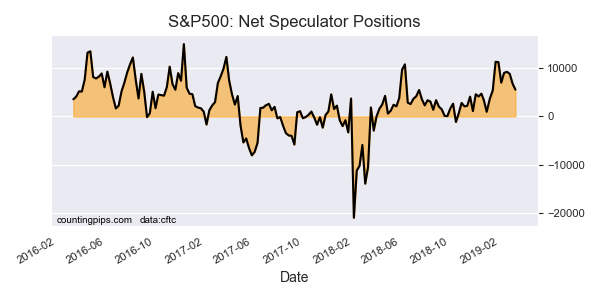
S&P500
The S&P500 speculator trader’s futures position rounds out the top five in this week’s bullish extreme standings. The S&P500 speculator level sits at a 74 percent score of its 3-year range.
The speculator position was 5,563 net contracts this week which was a move of -1,237 contracts from last week. The speculator long position was a total of 7,644 contracts in comparison to the total speculator short position of 2,081 contracts.
This Week’s Most Bearish Speculator Positions:
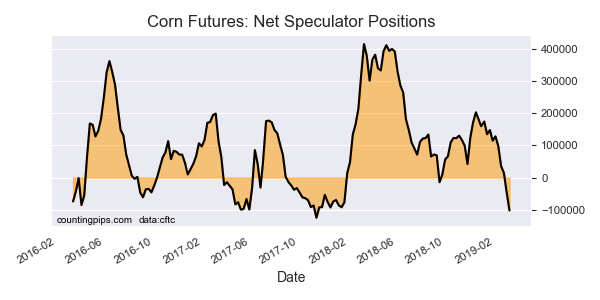
Corn Futures
The Corn Futures speculator trader’s futures position comes in as the most bearish extreme standing this week. The Corn speculator level is at a 4 percent score of its 3-year range.
The speculator position was -102,317 net contracts this week, a weekly change of -56,000 contracts from last week. The speculator long position was a total of 434,458 contracts versus the total spec short position of 536,775 contracts.
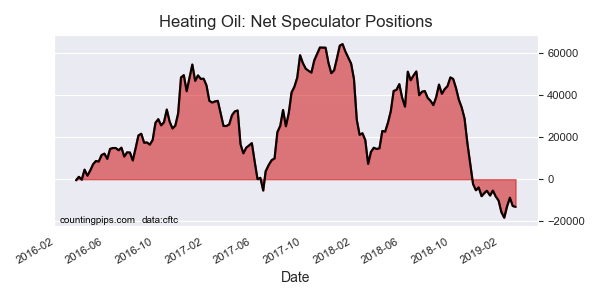
Heating Oil
The Heating Oil speculator trader’s futures position comes in next for the most bearish extreme standing on the week. The Heating Oil speculator level is at a 6 percent score of its 3-year range.
The speculator position was -13,169 net contracts this week which was a change by -399 contracts from last week. The speculator long position was a total of 48,836 contracts compared to the total speculator short position of 62,005 contracts.
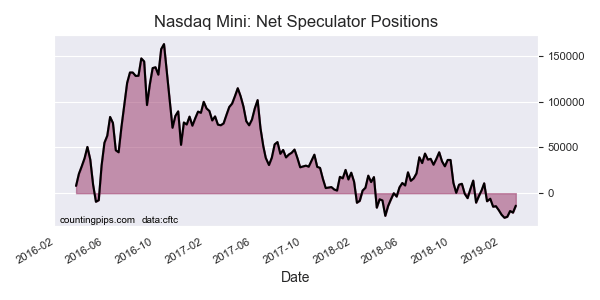
Nasdaq Mini
The Nasdaq Mini speculator trader’s futures position comes in as third most bearish extreme standing of the week. The Nasdaq-Mini speculator level resides at a 7 percent score of its 3-year range.
The speculator position was -13,652 net contracts this week saw movement by 7,561 contracts from last week. The speculator long position was a total of 55,478 contracts against the total spec short position of 69,130 contracts.
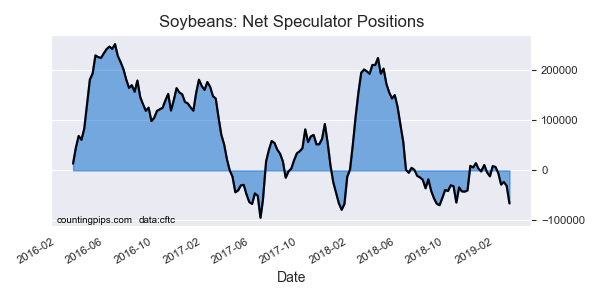
Soybeans
The Soybeans speculator trader’s futures position comes in as this week’s fourth most bearish extreme standing. The Soybeans speculator level is at a 8 percent score of its 3-year range.
The speculator position was -65,967 net contracts this week which was a change by -35,036 contracts on the week. The speculator long position was a total of 124,763 contracts versus the total speculator short position of 190,730 contracts.
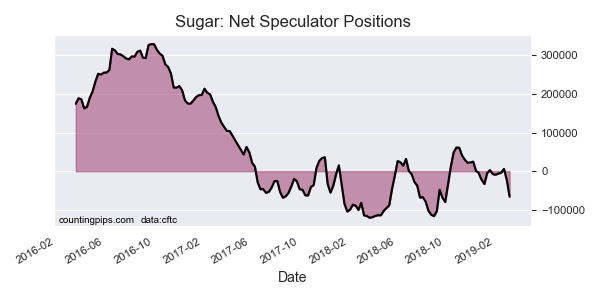
Sugar
Finally, the Sugar speculator trader’s futures position comes in as the fifth most bearish extreme standing for this week. The Sugar speculator level is at a 12 percent score of its 3-year range.
The speculator position was -65,987 net contracts this week and changed by -43,475 contracts from last week. The speculator long position was a total of 176,302 contracts compared to the total spec short position of 242,289 contracts.
*COT Report: The weekly commitment of traders report summarizes the total trader positions for open contracts in the futures trading markets.
The CFTC categorizes trader positions according to commercial hedgers (traders who use futures contracts for hedging as part of the business), non-commercials (speculators & large traders who speculate to realize trading profits) and nonreportable traders (usually small traders/speculators).