EURUSD has completed the first descending impulse along with the correction. Possibly, today the price may form the second impulse to break 1.1300 and then continue trading inside the downtrend with the short-term target at 1.1270.
GBPUSD, “Great Britain Pound vs US Dollar”
GBPUSD is being corrected towards 1.3150; right now, it is forming the fifth structure. Possibly, the pair may break 1.3220 and reach the first target at 1.3150. After that, the instrument may start a new growth towards 1.3268.
USDCHF, “US Dollar vs Swiss Franc”
USDCHF is still consolidating near the lows; it has reached 1.0020 again. Today, the pair may grow to break 1.0044. Later, the market may continue moving upwards with the target at 1.0077.
USDJPY, “US Dollar vs Japanese Yen”
USDJPY is moving downwards. Possibly, the pair may break 111.49 and then continue trading inside the downtrend with the first target at 111.09.
AUDUSD, “Australian Dollar vs US Dollar”
AUDUSD is consolidating below 0.7095. Today, the pair may break the range downwards. The short-term target is at 0.6967.
USDRUB, “US Dollar vs Russian Ruble”
USDRUB is being corrected to return to 65.65. Later, the market may trade downwards to break 65.14 and then continue falling with the target at 64.90.
XAUUSD, “Gold vs US Dollar”
Gold has finished the first descending impulse; right now, it is being corrected with the target at 1301.70. After that, the instrument may resume trading downwards to reach the short-term target at 1282.46.
BRENT
Brent is consolidating around 67.18. Possibly, the pair may fall to test 66.66 from above and then resume its growth with the key target at 68.40.
Attention! Forecasts presented in this section only reflect the author’s private opinion and should not be considered as guidance for trading. RoboForex LP bears no responsibility for trading results based on trading recommendations described in these analytical reviews.
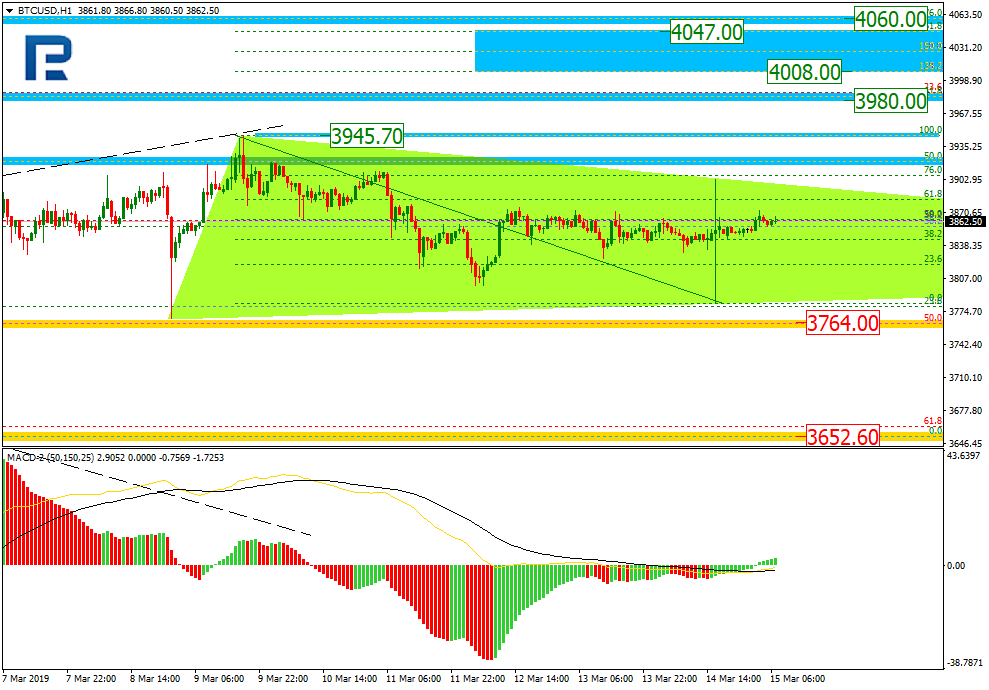
As we can see in the H4 chart, after finishing the descending wave, BTCUSD started a new correction, which has already reached the retracement of 50.0%. The next targets may be the retracements of 61.8% and 76.0% at 3980.00 and 4060.00. The key target of this rising impulse will be the high at 4188.00. The local support is at 3764.00; the key one – 3652.60.
In the H1 chart, the current range is getting narrow; there is a signal for growth on MACD. Possibly, the pair may break the range upwards and reach the short-term high at 3945.70. After breaking the high, the instrument may continue growing towards the post-correctional extension area between the retracements of 138.2% and 161.8% at 4008.00 and 4047.00 respectively.
ETHUSD, “Ethereum vs. US Dollar”
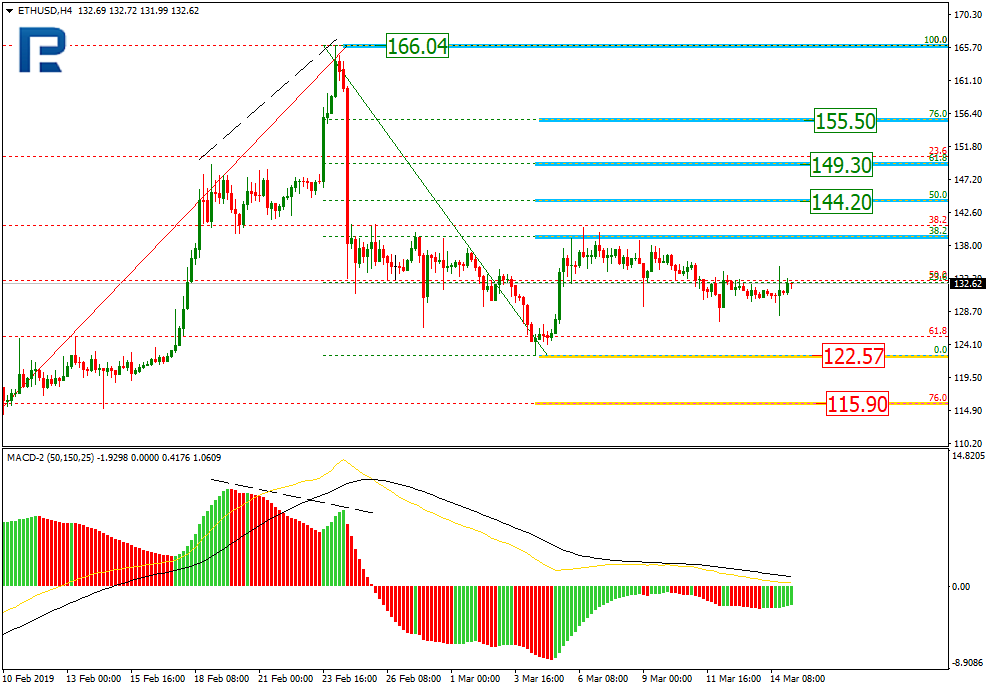
As we can see in the H4 chart, ETHUSD may start a new rising wave. The closest target of this uptrend may be the retracements of 50.0%, 61.8%, and 76.0% at 144.20, 149.30, and 155.50 respectively. In case the price start a new descending impulse after breaking the local support at 122.57, the instrument may fall towards the retracement of 76.0% at 115.90).
In the H1 chart, ETHUSD is being corrected upwards. The first target will be the high at 140.45. After breaking it, the pair may continue growing to reach the post-correctional extension area between the retracements of 138.2% and 161.8% at 145.45 and 148.45 respectively. The support is the low at 127.40.
Attention! Forecasts presented in this section only reflect the author’s private opinion and should not be considered as guidance for trading. RoboForex LP bears no responsibility for trading results based on trading recommendations described in these analytical reviews.
EUR/USD is showing an ambiguous technical picture. The EUR is stabilizing after a long rally, the quotes are consolidating around 1.13000. 1.13350 acts as a local resistance. The financial market participants are waiting for additional drivers. You should open positions from the key levels.
The Economic News Feed for 15.03.2019:
– Consumer Price Index (EU) – 15:00 (GMT+2:00);
– Industrial Production Volume (US) – 15:15 (GMT+2:00);
– JOLTS (US) – 16:00 (GMT+2:00);
The price fixed above 50 MA and 200 MA which points to the power of the buyers.
The MACD histogram is in the positive zone and keeps rising which suggests you should purchase EUR/USD.
The Stochastic Oscillator is in the neutral zone, the %K line is crossing the %D line. There are no signals at the moment.
Trading recommendations
Support levels: 1.13000, 1.12800, 1.12450
Resistance levels: 1.13350, 1.13650, 1.14000
If the price fixes above 1.13350, expect the quotes to grow toward 1.13650-1.14000.
Alternatively, the quotes can descend toward 1.12600-1.12400.
The GBP/USD currency pair
Technical indicators of the currency pair:
Prev Open: 1.33169
Open: 1.32608
% chg. over the last day: -0.61
Day’s range: 1.32028 – 1.32657
52 wk range: 1.2438 – 1.4378
GBP stabilized around the 7-week maximums. Yesterday the British parliamentaries voted to request postponing Brexit. The EU summit where it will be reviewed will happen next week. Should it be approved, the Britain will have time until June 30 to handle the Brexit properly. Right now the quotes are consolidating around 1.32000-1.32650. The investors are waiting for new information regarding Brexit. You should open positions from the key levels.
The Economic News Feed for 15.03.2019 is calm.
Indicators do not provide precise signals, the price has crossed 50 MA.
MACD is close to 0.
The Stochastic Oscillator is in the neutral zone, the %K line is crossing the %D line. There are no signals at the moment.
Trading recommendations
Support levels: 1.32000, 1.31500, 1.30600
Resistance levels: 1.32650, 1.33250, 1.33750
If the price fixes above 1.32650, expect the quotes to move toward 1.33250-1.33600.
Alternatively, the quotes can fall toward 1.31500-1.31000.
This article reflects a personal opinion and should not be interpreted as an investment advice, and/or offer, and/or a persistent request for carrying out financial transactions, and/or a guarantee, and/or a forecast of future events.
The latest trading USD/CAD sessions were very active. There is no single defined trend. CAD is testing the local support at 1.32900. The nearest resistance is at 1.33150. CAD is suppoted by the positive oil quotes dynamics. USD/CAD has a tendency to descend. You should open positions from the key levels.
At 14:30 (GMT+2:00) Canada will publish the sales report in the industrial sector.
The price fixed below 50 MA and 200 MA which points toward the power of the buyers.
The MACD histogram is in the negative zone and below the signal line, which gives a strong signal towards selling USD/CAD.
The Stochastic Oscillator started to leave the oversold zone, the %K line is above the %D line which points toward the bullish mood.
Trading recommendations
Support levels: 1.32900, 1.32500, 1.32200
Resistance levels: 1.33150, 1.33400, 1.33650
If the price fixes below 1.32900, expect quotes to fall toward 1.32500-1.32300.
Alternatively, the quotes can recover toward 1.33400-1.33600.
The USD/JPY currency pair
Technical indicators of the currency pair:
Prev Open: 111.274
Open: 111.655
% chg. over the last day: +0.43
Day’s range: 111.487 – 111.901
52 wk range: 104.56 – 114.56
USD/JPY is in a flat movement. The technical picture is ambiguous. The market participants are waiting for additional drivers. The Bank of Japan ileft the key monetary policy parameters without changes. Right now the key support and resistance levels are 111.550 and 111.850. You should open positions from these levels.
The Japanese Economic News Feed for 15.03.2019 is calm. Keep an eye on the US news feed.
The indicators do not provide precise signals, 50 MA has crossed 200 MA.
The MACD histogram is in the positive zone but below the signal line, which gives a weak signal to buy USD/JPY.
The Stochastic Oscillator is in the neutral zone, the %K line is above the %D line which points toward the bullish mood.
Trading recommendations
Support levels: 111.550, 111.400, 111.150
Resistance levels: 111.850, 112.100
If the price fixes below the local support of 111.550, expect the quotes to fall toward 111.300-111.100.
Alternatively, the quotes can grow toward 112.100-112.300.
The British pound has stabilized near 7-week highs. Financial market participants took a break amid the development of the situation regarding Brexit. Yesterday, vote on a Brexit delay was held in the UK Parliament. Parliamentarians voted for the decision to send a request to postpone the country’s exit from the European Union. 412 officials voted for the delay, 202 voted against. British Prime Minister Theresa May will seek approval of the Brexit deal next week again.
However, 27 EU members should unanimously support this decision in order to delay Brexit. According to preliminary data, the summit of the leaders of the block will be held next Thursday. In case of a short delay, the Brexit date could be rescheduled for June 30th.
Yesterday, the US dollar strengthened against a basket of major currencies despite weak economic data. Thus, new home sales fell to 607K in January, while experts expected 622K. Over the past week, the number of initial jobless claims increased to a maximum of 4 weeks (229K). At the same time, growth in export and import indices exceeded market expectations. The dollar index (#DX) closed the trading session in the positive zone (+0.27%).
The Bank of Japan, as expected, kept the key marks of monetary policy at the same level.
The “black gold” prices have continued to rise. At the moment, futures for the WTI crude oil have approached $58.85 per barrel.
Market Indicators
Yesterday, there was a variety of trends in the US stock market: #SPY (-0.06%), #DIA (+0.07%), #QQQ (-0.17%).
The 10-year US government bonds yield fell slightly. Currently, the indicator is at the level of 2.61-2.62%.
The news feed on 15.03.2019:
– Consumer price index in the Eurozone at 12:00 (GMT+2:00); – Industrial production in the US at 15:15 (GMT+2:00); – JOLTS job openings in the US at 16:00 (GMT+2:00).
We recommend closely following further development on the Brexit issue.
On Thursday the 14th of March, the euro slid to 1.1294 against the dollar after 4 days of growth. All the major pairs underwent a downwards correction as everyone had their eyes on the Brexit votes.
The UK parliament held votes on several amendments relating to the UK’s terms of exit from the EU. The House of Commons voted to delay the date of departure to the 30th of June assuming that the EU agrees to it on the 20th of March. Parliament also rejected the idea of a second referendum.
Theresa May will now head to Brussels to formally request an extension to Article 50 of the Lisbon Treaty. The EU27 will then have to make a unanimous decision on whether or not to move the date of departure. The pound is set to continue experiencing high levels of volatility over the coming days.
Day’s news (GMT+3):
13:00 Eurozone: CPI (Feb).
15:30 Canada: manufacturing shipments (Jan).
15:30 US: NY Empire State manufacturing index (Mar).
16:15 US: industrial production (Feb).
17:00 US: Michigan consumer sentiment index (Mar).
20:00 US: Baker Hughes US oil rig count.
23:00 US: net long-term TIC flows (Jan).
Current situation:
I didn’t make a forecast yesterday, although I was expecting a correction first and foremost given that the pair had rebounded from the 135th degree and was trading within the reversal zone. The bulls tried to restart the uptrend from the 22nd degree, but as we can see, the bullish impulse ran out of steam on the back of the US dollar’s rise. The pair revisited the trend line and the LB.
As we await the opening of the European session, the EURUSD pair is trading at 1.1317. The euro jumped to 1.1327 in Asia following a rise on the Aussie and Kiwi dollars. Since the trend line remains intact, and we’re awaiting further developments on Brexit, there’s still a chance of revisiting the 1.1338 mark. Moreover, US President Trump hinted in a statement that it would become clear in the next 3 – 4 weeks whether or not the US and China can reach a trade deal. This is good for risky assets, including the euro.
Today, the Eurozone will publish its inflation figures for February. This is the only thing that could have a short-lived effect on the euro. Annual CPI is expected to come out at 1.5%, with the core component at 1.0%. The monthly value, however, may post a decline of 0.1% against a previous reading of 0.3%.
In my forecast today, I’m expecting an unsuccessful test of 1.1330 as well as a test of the trend line. I’ve done the forecast up to the 19th of March so you can see my thoughts on the next few trading days. The decline to the 67th degree will only be possible after the bears break through the trend line. I’m predicting this break to happen on Monday, but it could happen in today’s US session.
From 10:00 (GMT+3) on the 15th of March to 14:00 on the 18th of March, the cycles show a phase of decline. Be warned that the cycles don’t take future events into account; they’re simply constructed on the basis of past price behavior and there’s no guarantee as to whether or not they’ll work. The fundamentals are more important than indicators and any methods of analysis.
If you have been following our research over the past few months, you already know that we’ve called just about every major move in Gold over the past 14+ months. Recently, we called for Gold to rally to $1300 area, establish a minor peak, stall and retrace back to setup a momentum base pattern. We predicted this move to take place back in January 2019 – nearly 30+ days before it happened.
Now, we are publishing this research post to alert you that we are about 15~30 days away from the momentum base setup in Gold which will likely mirror in Silver. Thus, we have about 20+ days to look for and target entry opportunities in both Gold and Silver before this momentum bottom/base sets up.
This Monthly Gold chart, below, shows you the historic peaks that make up a current resistance level near 1370. This level is critical in understanding how the momentum base and following breakout will occur. This resistance level must be broken before the upside rally can continue above $1400, then $1500. Ultimately, the momentum base we are expecting for form before April 21 is the “last base” to setup before a much bigger upside price move takes place. In other words, pay attention over the next 30 days before this move happens.
This next Monthly Silver chart is the real gem of the precious metals world. The upside potential for Silver is actually much bigger than Gold currently. Any breakout move will likely see Silver push well above $30 per ounce and we just need to watch the $18.90 level for signs the breakout is beginning. Silver will follow a similar basing patter as Gold. We expect only about 30 days of buying opportunity left before this basing pattern is completed. Again, watch the April 21 date as the key date for the breakout move to begin.
Palladium has reached our initial Fibonacci upside price targets. We expect price to consolidated and potentially rotate near the $1500 price level. Ideally, price could fall below the $1300 price level and target the $1100 area before finding any real support. As long as industrial demand continues for Palladium, we expect to see continued upside price activity over the long run. Right now, we are expecting a price contraction as global industrial demand may falter a bit.
Please consider the research we are presenting to you today. Our predictive modeling systems have been calling the metals markets quite accurately over the past 14+ months. If our prediction of a momentum base on or near April 21 is correct, then we should begin to see an incredible upside price swing in Gold and Silver shortly after this date. You won’t want to miss this one – trust us. There will be time to catch this move when it starts – it could be an extended upside move. Pay attention and put April 21 on your calendar now.
If you like our research and our level of insight into the markets, then take a minute to visit our site to learn how we help our clients find and execute for success. We’ve been calling these market moves almost perfectly over the past 18+ months. Learn how our research team can help you stay ahead of these swings in price and find new opportunities for skilled traders. Take a minute to see how we can help you find and execute better trades by visiting TheTechnicalTraders.com today.
Our research team has been alerting our followers to a potentially deep price retracement setting up in the NQ and other US stock market majors. Although the recent price activity has pushed to newer recent highs this week, as you will see in the chart below, our Adaptive Dynamic Learning (ADL) price modeling system is suggesting that a “price anomaly” has set up.
These types of price anomalies are indicative of when price moves in an extended way outside of or away from the ADL predicted price levels. On the chart below, of NQ (NASDAQ), you’ll see the current setup with the predicted price anomaly highlighted as a RED SQUARE. This NQ ADL price pattern consists of 13 unique previous ADL instances and suggests there is a greater than 65% likelihood the prices will fall towards the 6700 level in the NQ over the next few days.
Our ADL price modeling system also confirms this on the Weekly chart basis. With 84 unique instances of an ADL price pattern, we are expecting a 65 to 95% probability that prices will fall to below 6700 within the next 3 to 5 weeks.
Both the Daily and Weekly ADL predictive modeling systems are suggesting that the upside move is over. The price anomaly could continue for a few more days, we’ve seen it happen in the past where price continues to push away from the ADL levels – this is what makes a price anomaly so exciting. When price moves away from levels that our ADL price modeling system suggests going to happen in the future, it allows us to set up trades expecting the price to REVERT back towards the ADL levels. So in this case, we can start setting up trades near 7300 for the NQ to retrace back to near 6700 – a 600 point swing.
If you want to join a group of professional traders, researchers, and friends, take a look at our trading newsletter to learn how we can help you find and execute better trades each month. We believe 2019 and 2020 will be incredible years for skilled traders and we are executing at the highest level we can to assist our members. In fact, we are about to launch our newest technology solution to better assist our members in creating future success.
Our team has 53 years of experience in researching and trading makes analyzing the complex and ever-changing financial markets a natural process. We have a simple and highly effective way to provide our customers with the most convenient, accurate, and timely market forecasts available today. Our stock and ETF trading alerts are readily available through our exclusive membership service via email and SMS text. Our newsletter, Technical Trading Mastery book, and 3 Hour Trading Video Course are designed for both traders and investors. Also, some of our strategies have been fully automated for the ultimate trading experience.
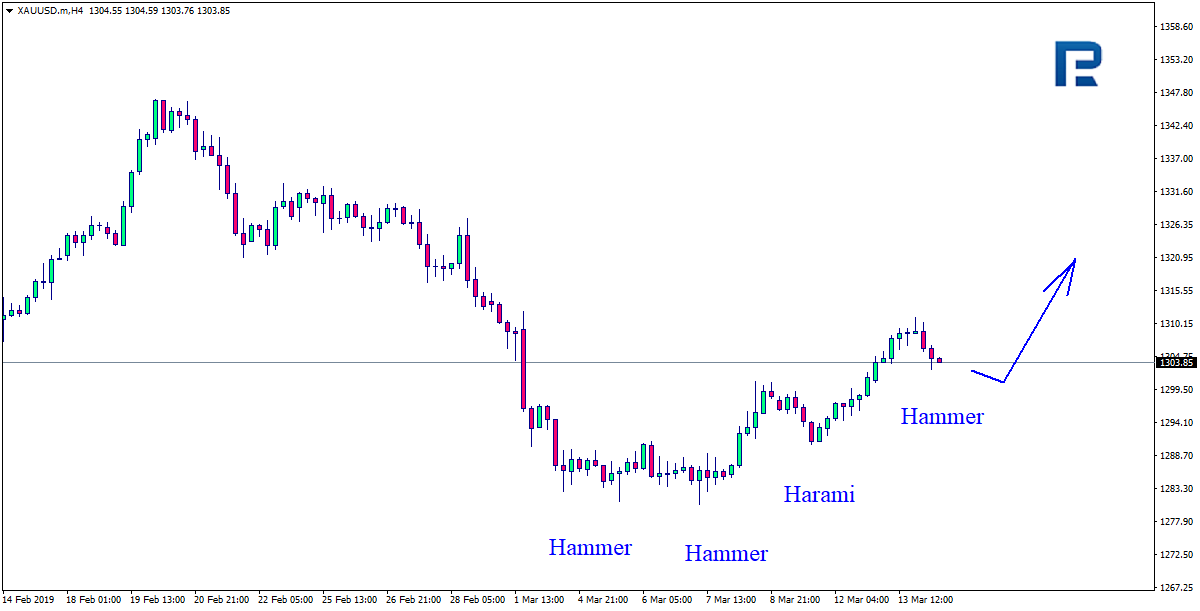
As we can see in the H4 chart, XAUUSD continues growing with slight pullback from time to time. Right now, the pair is forming Hammer and Inverted Hammer reversal patterns. Judging by the previous movements, it may be assumed that after finishing another pullback the instrument may continue its ascending movement.
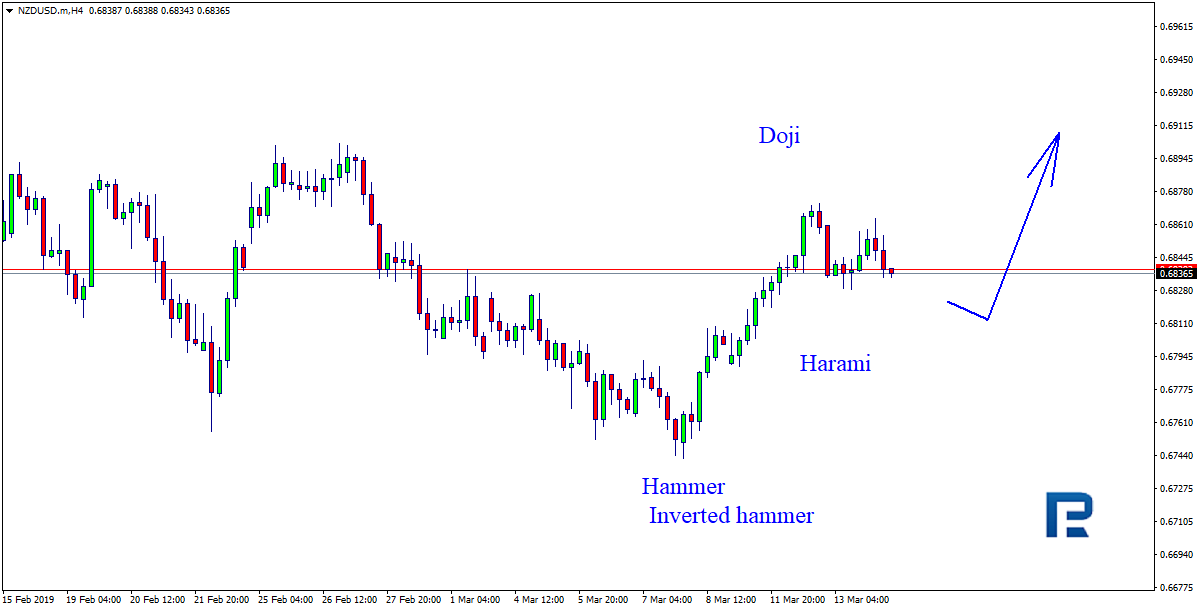
NZDUSD, “New Zealand vs. US Dollar”
As we can see in the H4 chart, NZDUSD has rebounded from the support level; right now, it is being corrected and forming Harami, Doji, and Hammer reversal patterns. Judging by the previous movements, it may be assumed that after finishing the correction the instrument may rebound and continue its growth.
Attention! Forecasts presented in this section only reflect the author’s private opinion and should not be considered as guidance for trading. RoboForex LP bears no responsibility for trading results based on trading recommendations described in these analytical reviews.
Sterling will experience a more sustained rally if British MPs decide to delay the UK’s current Brexit deadline today, says the CEO of one of the world’s largest independent financial advisory organizations.
The comments from Nigel Green, founder and chief executive of deVere Group, come ahead of Thursday evening’s parliamentary vote – the third in as many days. The pound surged more than one per cent against both the dollar and euro on Wednesday as parliament voted overwhelmingly against leaving the UK without a transition agreement.
Mr Green comments: “There is a growing sense of optimism that the UK will not now crash out of the EU without a deal. This is being reflected in sterling’s positive moves.
“We can expect a more sustained rally of the pound as a result of this week’s three votes, but only after the EU has forced the UK government to justify an extension to Article 50.
He continues: “The government will be forced to articulate options that will be discussed by the parliament, such as Labour’s proposal for remaining in the customs union, the Norway Plus option, another referendum or general election. All but the latter will be good for sterling.
“An election would likely solve nothing since both main parties will presumably again have ‘supporting the will of the people on Brexit’ in their manifestos.”
Earlier this week, the deVere CEO joined the growing calls for a second referendum. He noted: “There is no parliamentary majority for any Brexit option. Allowing the public to vote and giving them a final say is quite simply the only credible solution we now have available.”
He goes on to add: “Any new vote must also include the 700,000-plus British expats who are disenfranchised from the UK political system after 15 years overseas and subsequently denied the vote on something that directly affects them.
“All other G7 countries except the UK allow their citizens voting rights for life. Why is Britain different? It is especially galling as they are potentially still liable for UK inheritance tax but are not allowed to vote in the UK after 15 years.”
Mr Green concludes: “The pound is likely to rally – but there’s also a note of caution as this will depend on what the government decides to do with any extension of the March 29 deadline.”
About:
deVere Group is one of the world’s largest independent advisors of specialist global financial solutions to international, local mass affluent, and high-net-worth clients. It has a network of more than 70 offices across the world, over 80,000 clients and $12bn under advisement.
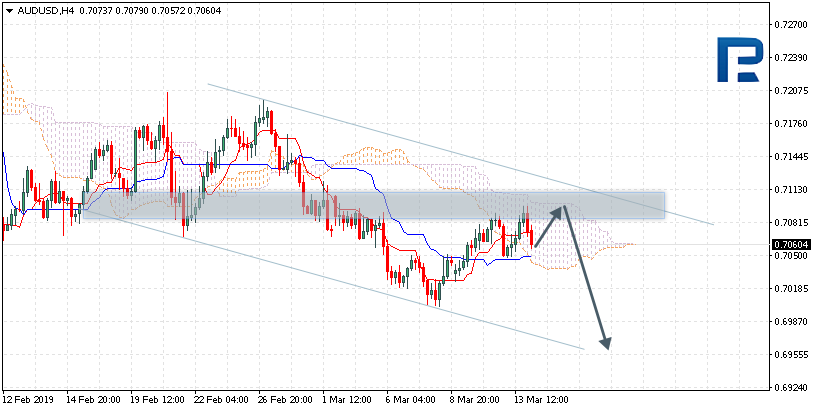
AUDUSD is trading at 0.7060; the instrument is moving inside Ichimoku Cloud, thus indicating a sideways tendency. The markets could indicate that the price may test the upside border of the cloud at 0.7095 and then resume moving downwards to reach 0.6955. Another signal to confirm further descending movement is the price’s rebounding from the channel’s upside border. However, the scenario that implies further decline may be cancelled if the price breaks the upside border of the cloud and fixes above 0.7025. In this case, the pair may continue growing towards 0.7005. After breaking the cloud’s downside border and fixing below 0.7020, the price may continue moving downwards.
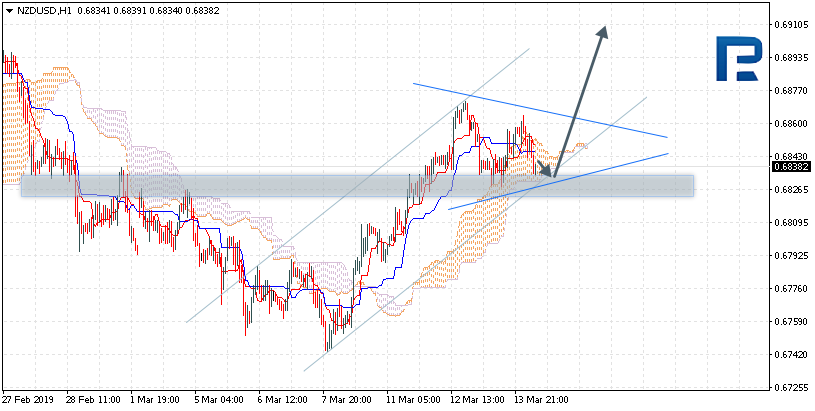
NZDUSD, “New Zealand Dollar vs US Dollar”
NZDUSD is trading at 0.6841; the instrument is moving inside Ichimoku Cloud, thus indicating a sideways tendency. The markets could indicate that the price may test the downside border of the cloud at 0.6830 and then resume moving upwards to reach 0.6910. Another signal to confirm further ascending movement is the price’s rebounding from the channel’s downside border. However, the scenario that implies further growth may be cancelled if the price breaks the downside border of the cloud and fixes below 0.6810. In this case, the pair may continue falling towards 0.6715. After breaking the upside border of the Triangle pattern and fixing above 0.6865, the price may continue moving upwards.
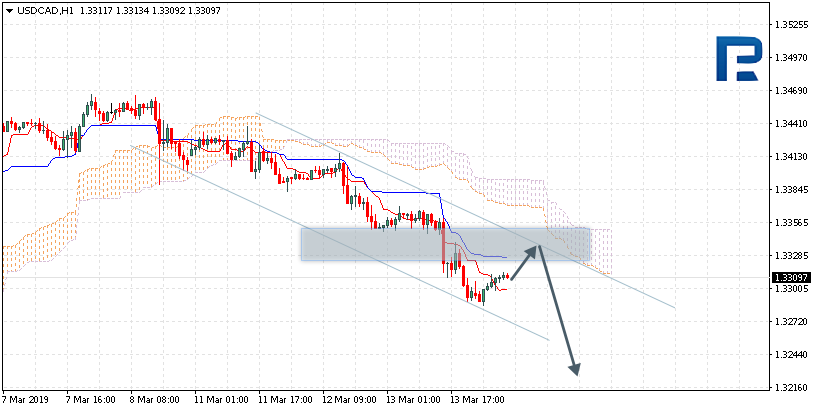
USDCAD, “US Dollar vs Canadian Dollar”
USDCAD is trading at 1.3309; the instrument is moving below Ichimoku Cloud, thus indicating a descending tendency. The markets could indicate that the price may test Tenkan-Sen and Kijun-Sen at 1.3330 and then resume moving downwards to reach 1.3215. Another signal to confirm further descending movement is the price’s rebounding from the channel’s upside border. However, the scenario that implies further decline may be cancelled if the price breaks the upside border of the cloud and fixes above 1.3375. In this case, the pair may continue growing towards 1.3475.
Attention! Forecasts presented in this section only reflect the author’s private opinion and should not be considered as guidance for trading. RoboForex LP bears no responsibility for trading results based on trading recommendations described in these analytical reviews.