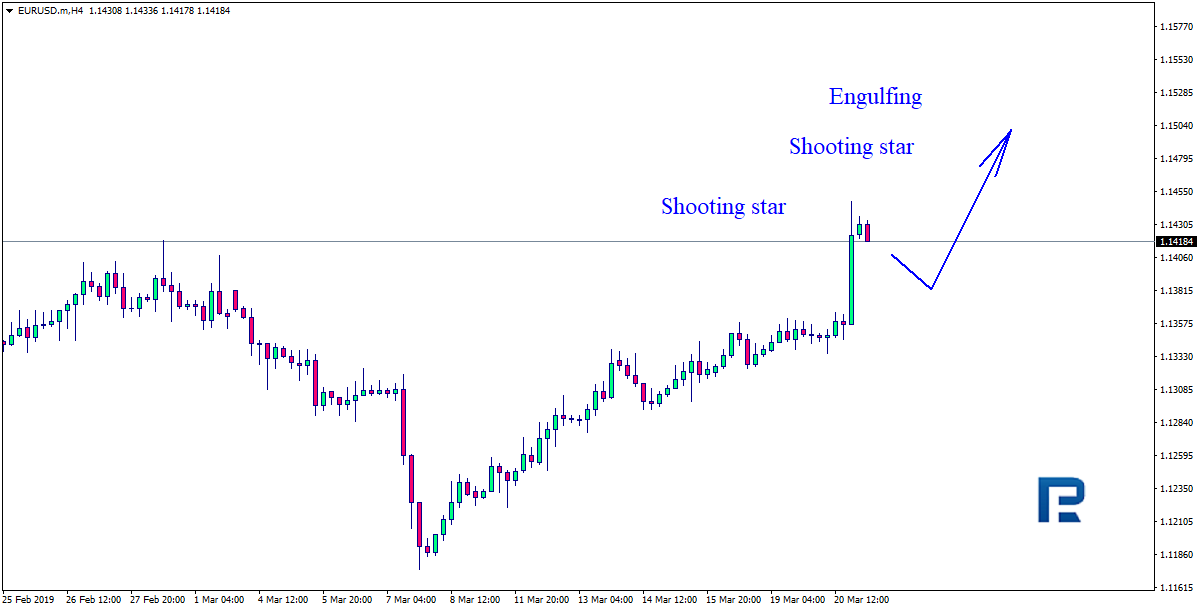
On H4, the pair rose and hit another resistance, where it is forming reversal patterns, such as hanging man and falling star. By analyzing the previous moves, one can assume the EURUSD may start forming a new uptrend after a correction.
USDJPY
On H4, the pair is going down, stopping near the support levels and forming reversal patterns, such as hammer and inverted hammer. By analyzing the previous moves, one can assume USDJPY may start forming a new uptrend after a correction.
Attention! Forecasts presented in this section only reflect the author’s private opinion and should not be considered as guidance for trading. RoboForex LP bears no responsibility for trading results based on trading recommendations described in these analytical reviews.
On H4, we can expect the USDCHF to test 0/8, which may then lead to a bounce and a rise to 3/8.
H1 is absolutely identical to H4, which confirms the prediction above.
In case VoltyChannel upper line is broken out on M15, the price will be likely to rise.
Gold
On H4, the price is declining within a consolidation range between 3/8 and 5/8. The 5/8 is going to get tested, after which the price is likely to bounce and fall to the support at 3/8.
On H1, the price is overbought. Now, once 1/8 gets broken out, it may fall further to reach the support at 5/8.
In case VoltyChannel bottom line is broken out on M15, the price will be more likely to go further down.
Attention! Forecasts presented in this section only reflect the author’s private opinion and should not be considered as guidance for trading. RoboForex LP bears no responsibility for trading results based on trading recommendations described in these analytical reviews.
Yesterday the USD weakened against the other world currencies due to the Federal Reserve’ comments. The regulator left the key interest range at the previous levels of 2.25-2.50%. The Central Bank is worried about the growing risks in the world economy and doesn’t want to increase the rates this year. The 10-year US Treasury bonds’ yield fell to the 2018 minimums. Right now the currency pair is consolidating around 1.14000-1.14450 and can grow further. You should open positions from these levels.
At 14:30 (GMT+2:00) the Philadelfia Federal Reserve will publish an Industrial PMI.
The price fixed fixed above 50 MA and 200 MA which points to the power of the buyers.
The MACD histogram is in the positive zone but below the signal line which gives a weak signal to buy EUR/USD.
The Stochastic Oscillator is in the oversold zone, the %K line is crossing the %D line. There are no signals at the moment.
Trading recommendations
Support levels: 1.14000, 1.13600, 1.13350
Resistance levels: 1.14450, 1.15000
If the price fixes above 1.14450, expect further growth toward 1.15000.
Alternatively, the quotes can correct toward 1.13600-1.13400.
The GBP/USD currency pair
Technical indicators of the currency pair:
Prev Open: 1.32668
Open: 1.31922
% chg. over the last day: -0.49
Day’s range: 1.31501 – 1.32271
52 wk range: 1.2438 – 1.4378
GBP is under pressure due to Brexit ambiguousness. Theresa May requested a delay in Brexit until June, 30. The Premier Minister of the Great Britain plans to have another vote on the current project. Earlier the Speaker of the House of Commons denied a second vote and requested for a deal to be presented in a new format.
The investors today are waitching the Bank of England meeting. The regulator is expected to keep the monetary policy parameters at the same levles. You should keep an eye on the comments made by its representatives. Right now the key support and resistance levels are 1.31500 and 1.32250, oyu should open positions from them.
The price fixed below 200 MA which points to the power of the sellers.
MACD is in the negative zone and keeps falling, which points to the bearish mood.
The Stochastic Oscillator is in the neutral zone, the %K line is below the %D line which gives a signal to sell GBP/USD.
Trading recommendations
Support levels: 1.31500, 1.31000, 1.30550
Resistance levels: 1.32250, 1.33000, 1.33600
If the price fixes below 1.31500, expect the quotes to fall toward 1.31000-1.30600.
Alternatively, the quotes can grow toward 1.32600-1.32800.
This article reflects a personal opinion and should not be interpreted as an investment advice, and/or offer, and/or a persistent request for carrying out financial transactions, and/or a guarantee, and/or a forecast of future events.
USD/CAD keeps trading in a long flat. There is no single trend. The local support and resistance levels are 1.32850 and 1.33150. The demand for the USD is weakened after the Federal Reserve meeting while CAD is supported by the bullish moods on the oil market. You should keep an eye on the reports from the US and open positions from the key levels.
The Economic News Feed for 21.03.2019 is calm.
The indicators do not provide precise signals, the price is testing 50 MA.
The MACD histogram is in the negative zone but above the signal line which gives a weak signal to sell USD/CAD.
The Stochastic Oscillator is in the overbought zone, the %K line is crossing the %D line. There are no signals at the moment.
Trading recommendations
Support levels: 1.32850, 1.32600
Resistance levels: 1.33150, 1.33450, 1.33650
If the price fixes below 1.32850, expect the quotes to fall toward 1.32600-1.32300.
Alternatively, the quotes can grow toward 1.33400-1.33600.
The USD/JPY currency pair
Technical indicators of the currency pair:
Prev Open: 111.398
Open: 110.615
% chg. over the last day: -0.65
Day’s range: 110.299 – 110.747
52 wk range: 104.56 – 114.56
USD/JPY is currently in an aggressive selloff. During the last two days, the quotes fell by 100 points and updated the key minimums. The demand for the USD is weakened after the Federal Reserve statements. The regulator will not change its opinion on not raising the key interest rates this year. The JPY is additionally supported by the ambiguousness around Brexit. Right now the local support and resistance are 110.350 and 110.600. The trading instrument has a tendency to descend further.
The Economic News Feed for 21.03.2019 is calm.
The price fixed below 50 MA and 200 MA which points to the power of the buyers.
The MACD histogram is in the negative zone and below the signal line which gives a strong signal to sell USD/JPY.
The Stochastic Oscillator is in the neutral zone, the %K line is above the %D line which points to the bullish mood.
Trading recommendations
Support levels: 110.350, 110.000
Resistance levels: 110.600, 110.750, 110.900
If the price fixes below the local support 110.350, expect the quotes to fall toward 110.000-109.800.
Alternatively. the quotes can grow toward 110.800-111.000.
Yesterday, the US dollar weakened significantly against a basket of major currencies after the Fed meeting. As expected, the regulator left the interest rate range at 2.25-2.50%. However, investor sentiment has worsened after it became known that the Fed would not raise interest rates in 2019 due to a slowdown in economic growth, and announced the completion of a program of balance sheet reduction in September. The dollar index (#DX) closed the trading session in the negative zone (-0.39%).
Financial market participants are still focused on the British pound. British Prime Minister Theresa May announced that she was not going to organize a second referendum on the Brexit issue. The position of the British is clear for her, so she does not see the point in a repeat vote. It also became known that the Prime Minister asked the EU to delay Brexit until June 30, although the exit process should have taken place on March 29.
However, the European Commission stands either for holding Brexit until May 23, 2019 or for a long-term delay of the procedure. The EU says that May 23 should be a deadline, since right after this the elections to the European Parliament will start, in which London should no longer participate. It should be recalled that earlier the Speaker of the House of Commons, John Bercow, rejected the Brexit revote. The official said that the deal should be presented in a fundamentally new form.
Today, investors are focused on meetings of the Swiss National Bank and the Bank of England. It is expected that regulators will keep the key marks of monetary policy unchanged. We recommend paying attention to the comments by representatives of Central Banks.
The “black gold” prices have updated annual highs. At the moment, futures for the WTI crude oil are testing the mark of $60.00 per barrel.
Market Indicators
Yesterday, there was a variety of trends in the US stock market: #SPY (-0.30%), #DIA (-0.61%), #QQQ (+0.40%).
The 10-year US government bonds yield fell significantly. Currently, the indicator is at the level of 2.51-2.52%.
The news feed on 21.03.2019:
– Swiss National Bank interest rate decision at 10:30 (GMT+2:00); – Report on retail sales in the UK at 11:30 (GMT+2:00); – Bank of England interest rate decision at 14:00 (GMT+2:00); – Philadelphia Fed manufacturing index at 14:30 (GMT+2:00).
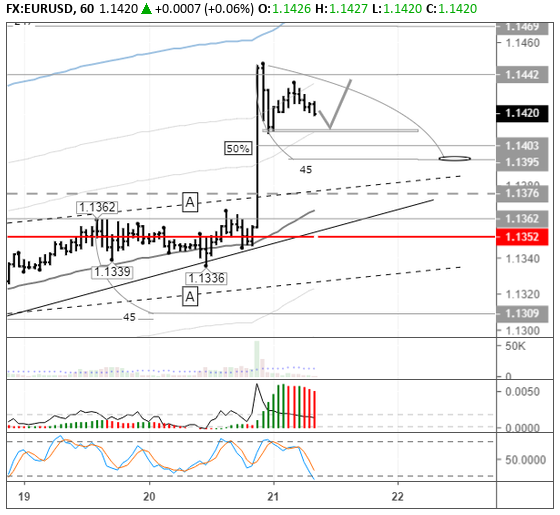
On Wednesday the 20th of March, the bulls managed to close the day above 1.14. The highest point recorded during the day’s trading was 1.1448. The dollar collapsed during the US session following confirmation of the US Fed’s decision and the publication of the subsequent monetary policy statement.
All the Fed’s actions prompted speculators to short the dollar. After the two-day meeting, the Federal Reserve decided to maintain the key rate within the range of 2.25% to 2.5%. The accompanying monetary policy statement was more dovish than markets expected. Economic growth forecasts for 2019 and 2020 were downgraded. Expected growth this year was revised downwards from 2.3% to 2.1%, and next year from 2% to 1.9%.
The dollar’s collapse was caused by the Fed’s dot plots, which depict the opinions of FOMC members with regard to future interest rate hikes. They currently show that the federal funds rate will remain at its current level throughout the year, and be raised once in 2020. Moreover, the central bank plans to end its balance sheet reduction in September this year.
US10Y bond yields have dropped by 1.95% to 2.97%. All major currencies gained round against the dollar on the back of this.
Day’s news (GMT+3):
11:30 Switzerland: SNB interest rate decision and monetary policy assessment.
12:00 Eurozone: ECB economic bulletin.
12:30 UK: retail sales (Feb), public sector net borrowing (Feb).
The European session saw another false breakout of the trend line. The euro descended to 1.1336 before making a sharp upwards reversal. The pair missed the lower target of 1.1325 by 11 pips. The EURUSD pair then went on to hit a new high on the back of the pound’s collapse and the resulting rise of the EURGBP cross. The bulls were unable to break the resistance at 1.1360 until the Fed’s rate decision was announced.
The Fed surprised markets with its dovish outlook. The dollar went into serious decline after it became clear that there wouldn’t be any rate hikes this year and the Fed downgraded their GDP forecasts. The regulator plans to end their balance sheet reduction in September. Market sentiment towards the dollar has taken a turn for the worse.
On the chart, I’ve highlighted the 50% level of the big candlestick. 1.1403 is a key level. If we drop below it, the bears will start pushing towards the 45th degree. I’ve mapped out a slow version of the downwards trajectory with an arc.
Considering that a lot of currencies and euro crosses are trading up, we’re likely to see a rebound via a double bottom. If pressure on the dollar increases, the euro bulls could break through to 1.1480. If we make it to the U3 line, rather than a downwards rebound, I think we can expect the pair to move in a saw tooth formation below the line.
The monthly candlestick is currently giving out a buy signal. It’s going to close in 6 days. My target for the beginning of June remains at 1.23.
Today’s central focus is the Bank of England’s meeting.
Admiral Markets is delighted to announce that we won the award for having the Best Forex Platform in the ADVFN International Financial Awards 2019.
The ADVFN International Financial Awards recognise and celebrate the best products and services from across the financial industry. Currently in their fifth year, the Awards recognise categories such as CFD providers, cryptocurrency exchanges, online trading services, spread betting platforms, investment magazines and more.
CEO of Admiral Markets AS Sergei Bogatenkov commented on the recognition: ‘We are proud to have won in the category of Best Forex Platform, which reflects the work our team has put into developing world-class tools to help our clients succeed in their trading.’
Sergei Bogatenkov, CEO of Admiral Markets AS
Admiral Markets offers Forex and CFD trading on the MetaTrader 4 and MetaTrader 5 platforms, which is available for Windows, Mac, iOS and Android devices. These platforms offer traders and investors access to advanced trading operations across thousands of financial markets in a fast, secure and reliable environment.
Admiral Markets also offers its clients the exclusive MetaTrader Supreme Edition plugin, which includes a range of advanced features to help clients achieve even better trading results. This is available free, for demo and live accounts and “boost” the MetaTrader with over 60 additional features.
The ADVFN International Financial Awards are the second time Admiral Markets’ trading platforms have been recognised in 2019, having already been awarded a five-star rating in a Deutsches Kundeninstitut (DKI) survey of 1,015 active traders.
Admiral Markets Group Management Board Member Jens Chrzanowski, commented, ‘Winning the award for the Best Forex Platform, along with the title from DKI of 2019’s Best CFD Broker tells us that we are on the right path when it comes to developing tools that will help our clients have the best trading experience. We are delighted to be awarded by both DKI and ADVFN, and these awards will empower us to continue delivering the best possible tools, technology and service.’
Jens Chrzanowski, Admiral Markets Group Management Board Member
About Admiral Markets
Admiral Markets is a leading online Forex and CFD trading provider. In addition to a wide range of financial instruments, Admiral Markets offers free educational materials, including analytics, webinars and seminars.
*** Risk disclosure: CFDs are complex instruments and come with a high risk of losing money rapidly due to leverage. 83% of retail investor accounts lose money when trading CFDs with this provider. You should consider whether you understand how CFDs work and whether you can afford to take the high risk of losing your money. Read more at admiralmarkets.com
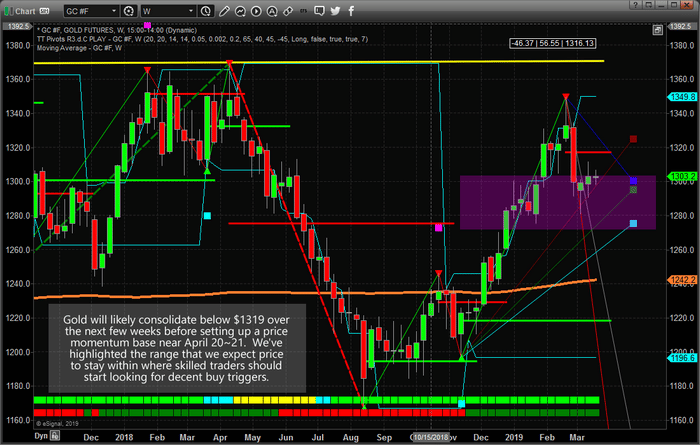
Our research team, at Technical Traders Ltd., believes Gold will continue to base below $1320 for at least another 3~5 weeks before setting up a momentum price base. Our research suggests general weakness in the US stock market over the next few weeks/months as a Head-n-Shoulders pattern unfolds. Interestingly enough, our research also suggests Gold may continue to base below $1320 (likely below $1300) for at least another 2~4 weeks before forming a rounded bottom type pattern as a base.
This would likely result from a mild price rotation in the US major indexes and possibly weakness in the US Dollar. Weakness in the US Dollar and Equities Markets may be just enough impetus to cause Gold to rotate into the Momentum Basing pattern we have been expecting since January 2019. We’ve highlighted the price range, on the chart below, in purple. We believe the price of Gold will re-enter this range at least once or twice over the next 2~4+ weeks to set up a basing pattern. After April 21, we believe the basing pattern should be complete and a new upward price swing should begin.
We expect to attempt to target opportunities below the $1300 price level in Gold to accumulate a LONG position ahead of the upside breakout. The opportunity for prices to stay below $1320 and for skilled traders to pick entry levels that are suitable for their futures should not be underestimated. The next upside price leg in Gold will likely see prices well above $1450.
Take advantage of any price levels below $1290 because this may be the last time you see them for a while. We have also been sharing our stock market forecast looking forward 1-3 weeks from now which goes against everyone’s bias/sentiment including yours likely, but its something you should think about because you could give back a lot of profits if you don’t act now!
Please take a minute to visit TheTechnicalTraders.com to learn how we can help you find and execute better trades in 2019. We have already positioned our clients for this move and we believe we can help you stay ahead of these markets. 2019 and 2020 are going to be incredible years for our subscriber the Wealth Building Trading Newsletter.
The EURUSD failed to stay above 1.1358: the price bounced and headed lower. This may lead to a fall towards 1.1324, and then a rise to 1.1340, and a further rise to 1.1380. In case the lower boundary gets broken out, the price may fall to the local target of 1.1280.
GBPUSD
The GBPUSD bounced off the upper triangle boundary and may now fall to 1.3156. The pair may then slide up to 1.3390, but then again fall following the trend to reach the first target at 1.3070.
USDCHF
The USDCHF hit the local downtrend target at 0.9984. Today, it may start consolidating at its lows. The price may then either go up towards $1.0051, or hit the lower boundary at 0.9978. The first trend-following target is meanwhile at 1.0160.
USDJPY
The USDJPY has nearly completed its primary falling move and even finished the correction. Today, the correction channel may get hit at 111.05, and then, after breaking it out, the price may head towards 100.76, its local target.
AUDUSD
The Aussie has broken out the consolidation range top down against the dollar, and the first falling move is already over. Currently, the pair is correcting around 0.7089, which may be followed with a fall to 0.7040.
USDRUB
The Russian currency is consolidating below 64.62. The price may then either go up towards 64.84, or continue the trend by falling to 63.71.
GOLD
The gold bounced off $1310.30 and has nearly formed a double top. Today, it may probably be heading down towards $1300.30, and then, once a breakout occurs, hit $1296.08, which is going to be the first target.
BRENT
The Brent crude is above $67.38 and may reach $68.50 today. The price may then start correcting to $63.95.which is going to be the first target.
Attention! Forecasts presented in this section only reflect the author’s private opinion and should not be considered as guidance for trading. RoboForex LP bears no responsibility for trading results based on trading recommendations described in these analytical reviews.
On H4, the GBPUSD started trading sideways after breaking out the latest high. Once the pullback is over, the price may rise to the are between 138.20% and 161.80% Fibo, or 1.3497 to 1.3590. The major support is meanwhile at 1.2960.
On H1, the GBPUSD is forming a correction trend that reached 38.20% Fibo and may go ahead to reach 50%, or $1.3171, and 61.80%, or $1.3121. The resistance is meanwhile at the high of 1.3381.
EURJPY
On H4, the EURJPY reached 76% Fibo, with the next target lying at the high of $127.50. Once it gets broken out, the price will probably head to the area between 138.2% and 161.80% Fibo, or 128.73 to 129.47. The local support is meanwhile at 125.51, while the major one is at 124.27.
On H1, the EURJPY is uptrending, but diverging. This may trigger a pullback to 23.6% (126.17), 38.20% (125.81), or 50% (125.51), the resistance being at the high of 126.75.
Attention! Forecasts presented in this section only reflect the author’s private opinion and should not be considered as guidance for trading. RoboForex LP bears no responsibility for trading results based on trading recommendations described in these analytical reviews.
EUR/USD keeps consolidating. The financial market participants are waiting for the Federal Reserve’s decision regarding the key interest rate, as well as updated FOMC forecasts. The majority of experts conclude that the FRS will keep the key interest rate around 2.25%-2.50% and will keep using a careful approach toward hardening the monetary policy. Right now the key trading range is 1.13250-1.13600. You should open positions from these levels.
At 20:00 (GMT+2:00), the Federal Reserve will decide on the key interest rate.
The indicators do not provide precise signals, the price has crossed 50 MA.
The MACD histogram is close to 0.
The Stochastic Oscillator is in the neutral zone, the %K line is crossing the %D line. There are no signals at the moment.
Trading recommendations
Support levels: 1.13250, 1.13000, 1.12800
Resistance levels: 1.13250, 1.13000, 1.12800
If the price fixes above the 1.13600, expect the quotes to grow toward 1.14000.
Alternatively, the quotes can descend toward 1.13000-1.12700.
The GBP/USD currency pair
Technical indicators of the currency pair:
Prev Open: 1.32466
Open: 1.32668
% chg. over the last day: +0.09
Day’s range: 1.32125 – 1.32753
52 wk range: 1.2438 – 1.4378
The GBP/USD technical picture remains ambiguous. Yesterday the National Statistic Service published mixed labour market reports. The investors are waiting for new intel regarding Brexit. The local support and resistance levels are 1.32000 and 1.32600. You should open positions from these levels.
At 11:30 (GMT+2:00) the UK will publish a consumer price index.
The indicators do not provide precise signals, the price fixed betwee 50 MA and 200 MA.
The MACD histogram started to descend, which points to the power of the sellers.
The Stochastic Oscillator is close to the oversold zone, the %K line is crossing the %D line. There are no signals at the moment.
Trading recommendations
Support levels: 1.32000,1.31500, 1.30600
Resistance levels: 1.32600, 1.33000, 1.33600
If the price fixes below the 1.32000, expect the quotes to fall toward 1.31500-1.31300.
Alternatively, the quotes can rise toward 1.33000-1.33500.
This article reflects a personal opinion and should not be interpreted as an investment advice, and/or offer, and/or a persistent request for carrying out financial transactions, and/or a guarantee, and/or a forecast of future events.
USD/CAD was very active yesterday but didn’t have a definitive trend. Right now the quotes are testing the local resistance at 1.33450. The nearest support is at 1.33150. The financial market participants are waiting for the Federal Reserve’s meeting. You should keep an eye on the oil quotes dynamics and open positions from the key levels.
The Economic News Feed for 20.03.2019 is calm.
The indicators do not provide precise signals, the price fixed between 50 MA and 200 MA.
The MACD histogram is in the positive zone, which points towards the bullish mood.
The Stochastic Oscillator is in the neutral zone, the %K line is crossing the %D line. There are no signals at the moment.
Trading recommendations
Support levels: 1.33150, 1.32900, 1.32600
Resistance levels: 1.33450, 1.33650, 1.33900
If the price fixes below 1.33150, expect the quotes to fall toward 1.32800-1.32600.
Alternatively, the quotes can grow toward 1.33700-1.34000.
The USD/JPY currency pair
Technical indicators of the currency pair:
Prev Open: 111.443
Open: 111.398
% chg. over the last day: -0.02
Day’s range: 111.360 – 111.695
52 wk range: 104.56 – 114.56
USD/JPY shows an ambiguous technical picture. The trading instrument keeps trading in a long flat. Right now the quotes are consolidating. The local support and resistance levels are 111.400 and 111.650. The investors are waiting for the Federal Reserve meeting regarding the key interest rate. You should open positions from the key levels.
The Economic News Feed for 20.03.2019 is calm.
The indicators do not provide precise signals: 50 MA started to cross 200 MA.
The MACD histogram is in the positive zone and above the signal line, which gives a strong signal to buy USD/JPY.
The Stochastic Oscillator is in the neutral zone, the %K line is above the %D line, which points toward the bullish mood.
Trading recommendations
Support levels: 111.400, 111.150, 110.900
Resistance levels: 111.650, 111.850, 112.000
If the price fixes below the 111.400 local support, expect the quotes to fall toward 111.000.
Alternatively, the quotes can frow toward 111.850-112.000.