International financial services company Admiral Markets AS invested €150,000 in Bankish, a digital solutions provider to the financial sector. This investment was made to support Bankish’s growth and expansion to new markets.
According to Sergei Bogatenkov, Chairman of the Management Board of Admiral Markets AS, Bankish is in the market a distinctive fintech that assists financial companies in digitalisation of the loan portfolio management and development. “This partnership with Bankish aims at supporting the company’s faster growth and expansion to new markets, in order to provide suitable solutions to smaller market participants in Estonia and abroad,” Bogatenkov noted.
Sergei Bogatenkov, CEO of Admiral Market AS
“Digital solutions by Bankish are assisting financial companies in improving the efficiency of deposit and loan management and customer communication, to integrate the opportunities offered by open banking while responding to growing regulatory demands,” commented Andrus Alber, one of Bankish’s founders. According to Alber, Bankish’s loan management software is aimed at financial companies who want to offer their customers digital solutions, but for whom other offerings in the market are either too expensive or where 90% of functionality is unnecessary for them.
Bankish AS is an Estonian fintech company with a team boasting previous experience in companies like Nasdaq, Microsoft, Tieto, Swedbank, Telia and others. Bankish offers easy-to-use and highly efficient deposit and loan management software with automated e-self-service to financial companies of varied sizes. Bankish products cover many financial services, such as secured and unsecured loans, business loans, deposits, etc. More information about the product can be found at www.bankish.eu.
In current financing round, Bankish secured convertible loans in total for €300,000.
In October 2018, Admiral Markets AS invested in another fintech, crowdfunding platform Fundwise.
About Admiral Markets
Admiral Markets is a leading online Forex and CFD trading provider. In addition to a wide range of financial instruments, Admiral Markets offers free educational materials, including analytics, webinars and seminars.
The timeframe is a time period that characterizes the movement of the exchange rate over a certain period of time. The trading effectiveness depends on the correct timeframe.
Traders can analyze price charts on different timeframes. The most popular are M5, M15, H1, H4, D1. On MetaTrader 4 there is an opportunity to use 9 standard timeframes: 1 minute, 5 minutes, 15 minutes, 30 minutes, 1 hour, 4 hours, 1 day, 1 week and 1 month. You can also create your own timeframe.
When switching from one timeframe to another, the volume of one candlestick or bar changes. In other words, the timeframe is the time period of each candle or bar. For example, if you have a minute timeframe (M1), then each candle on the chart will be equal to the interval of 1 minute.
Timeframes can be divided into three groups:
Short-term –from M1 to M15. On short-term timeframes, intraday trading, scalping are conducted. Such trading requires more time and is characterized by psychological stress. Trading on short-term timeframes is not recommended for beginners.
Medium-term –from M30 to Н1-H4. On medium-term timeframes, trading is calmer.
Long-term –from Н4 to D1 and above. Short-term and medium-term timeframes mean speculative trading, while long-term timeframes imply another approach –
The choice of timeframe depends on the trading strategy. There are several types:
Scalping
Scalpers execute a large number of orders, holding the position for a few seconds or minutes. The total number of operations is not limited. Scalpers constantly buy and sell during the day. A profit of scalper is usually 5-15 pips on a single trade. As a rule, they prefer trading after the publication of key economic news in order to get a quick profit. Scalpers usually work on M1-M5 and 15-minute timeframes.
Intraday
Intraday trading also involves making transactions within a single trading day, but a fewer amount of orders. The duration of one transaction varies from several minutes to several hours.
Intraday traders buy and sell currencies during the day, making a profit from short-term trends. Movements in such trends are usually 40-60 pips per day. Intraday traders quite often use a trailing stop and can hold positions for several days if they see a good potential in a certain transaction. M5-M30 timeframes are recommended for intraday trading. If you are a scalper, then you need a lower timeframe, if you have 1-2 transactions per day, then you may choose M15-M30.
Medium
The position is held from a day to several weeks. There is no need for constant monitoring of price charts. This type of trading is also good because you can choose several instruments and use them for more efficient trading. Traders who prefer this style of trading choose such timeframes as M30-H1 to H4.
Long-term
Long-term trading is based on making transactions from a week to several months. Do not require instant decisions and constant monitoring. In fact, this style of trading is considered as investing, since it does not pursue the goal of obtaining momentary profits. In the long-term strategy, the highest timeframes are used: from H4 to D1 and above.
Which timeframe to choose
On higher timeframes the psychological stress is significantly lower, there is always time to assess the situation calmly, without haste. Therefore, for beginners it is recommended to trade on higher timeframes, starting from the hourly H1 to D1.
Also, beginners should exclude minute timeframes, as it is difficult to make an analysis on such timeframes due to the “market noise”.
As a rule, every trader has several favorite timeframes, on which he makes an analysis and trades. To determine for yourself on which of the timeframes to trade,test it on a demo account without risking funds. It is a good way to move from a beginner to a more experienced trader. JustForex broker offers its clients practice accounts with trading terms corresponding to real ones. You get the same quotes, monitor the real-time situation on the market.
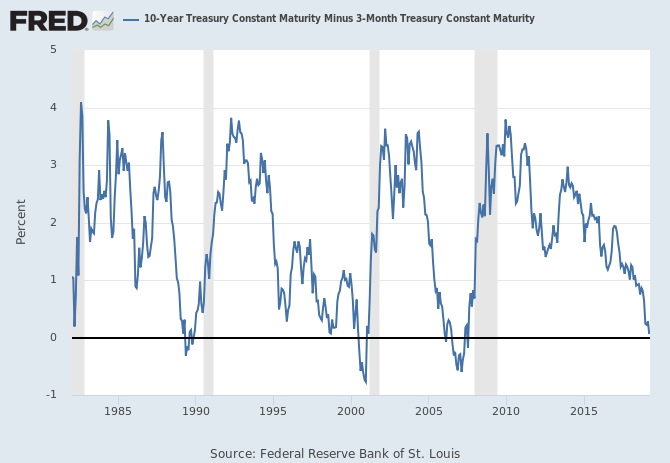
The US Treasury benchmark bond market inverted earlier today and according to history, a recession warning is triggered. Yield curve inversions occur when the yield on a longer-term bond falls below that of a shorter-term bond, signaling a sort of ‘upside-down’ situation that happens very rarely in the bond markets.
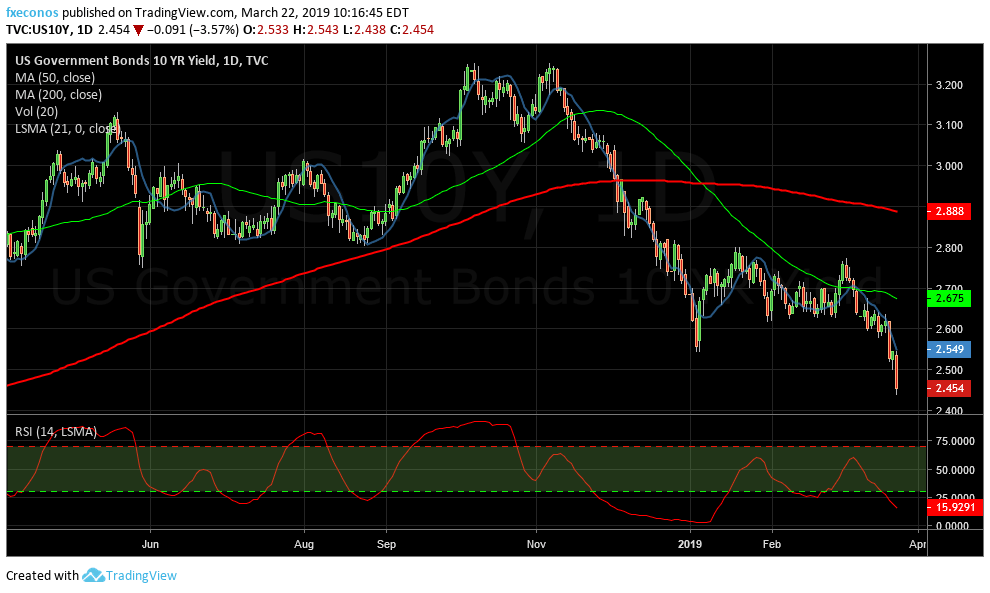
The benchmark 10-Year bond yield has fallen to a low of 2.43 percent in markets today while the yield on the 3-Month bond has held steady at the 2.46 percent level. This means there is a -0.03 inversion in the 10Year-3M curve.
The 1-Year bond yield has also been stable around the 2.46 percent level for an identical -0.03 inversion in the 10Year-1Year curve.
The shorter end of the yield curve (5-Year yield) has actually been inverted since December and today, the 5-Year bond yield (2.25%) has accelerated further below both the 3-Month (2.46%) and the 1-Year (2.46%).
The historical significance of a yield curve inversion is that it can be a reliable warning that a recession will occur anywhere from approximately nine months to two years after the inversion.
The reasoning goes that investors are rushing into longer-dated treasuries (10-Years) because the growth outlook is diminished in their eyes and warrants a flight to safe assets.
The inversion of the yield curve does not mean that it is an absolute certainty a recession will happen but the track record has been pretty good.
According to the Cleveland Federal Reserve — which does a great job of tracking this monthly, (although not up to date yet) — the inverted yield curve has predicted the last seven recessions.
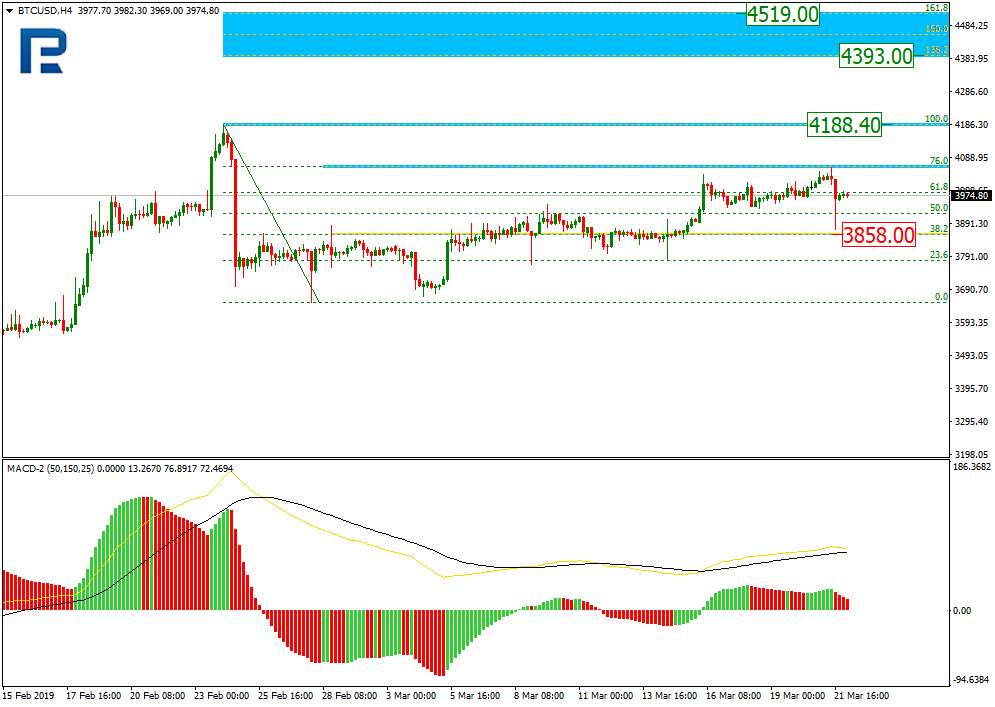
On H4, the Bitcoin is forming an ascending trend after correcting. This uptrend has reached the 61.80% Fibo; the local pullback has sent the crypto to the support at $3,858, and the next ascending trend target lies at $4,188.40. In case this high gets broken out, the price is likely to go up to reach the extension of 138.20%-161.80% Fibo, or $4,393 to $4,519.
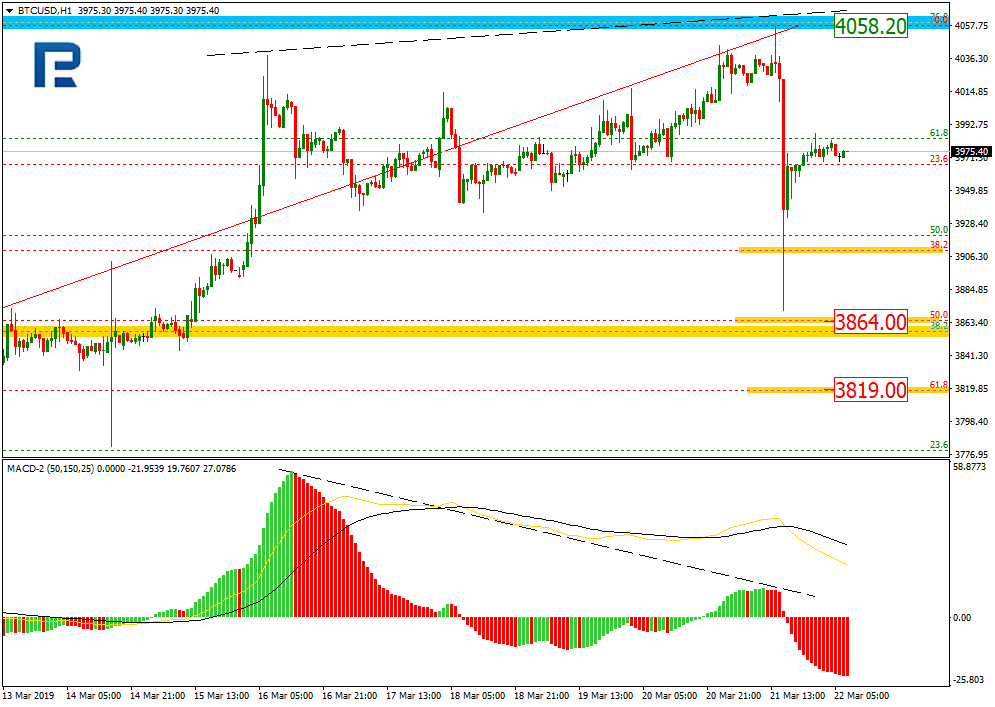
On H1, the Bitcoin has diverged and then reached 38.20%, and may head further down to 50% ($3,864) and 61.80% ($3,819). The resistance is at $4,058.20.
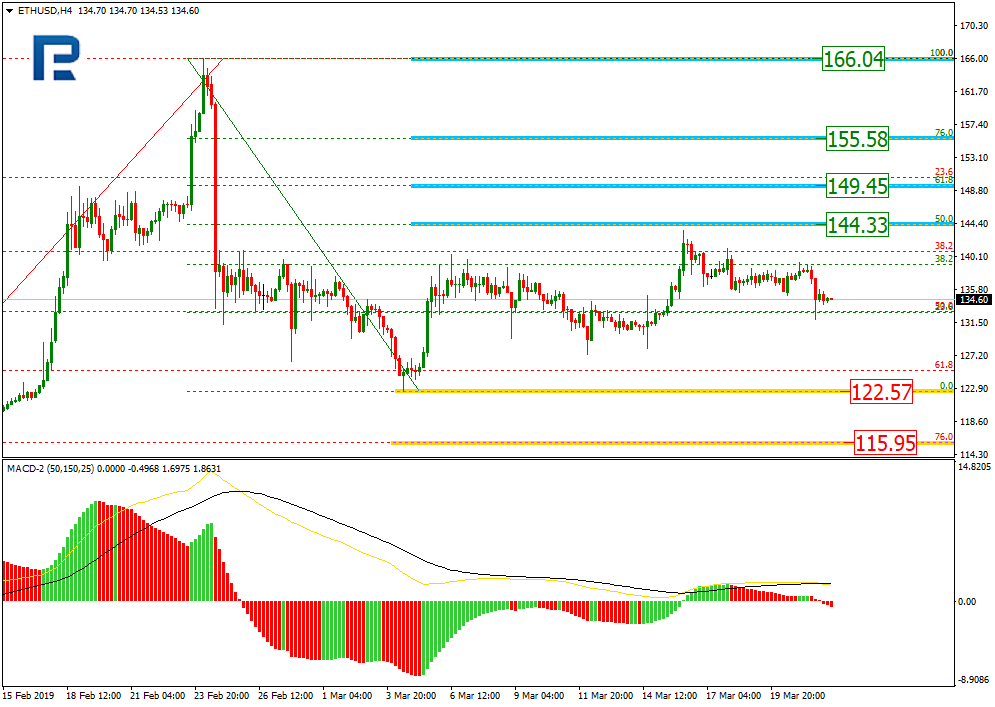
Ethereum
On H4, the Ether is approaching 50% Fibo, or $144.33. The next uptrend targets may lie at 61.80%, or $149.45, and 76%, or $155.58. If a downside move occurs, the price may hit the low at $122.57, and then 76% Fibo, or $115.95.
On H1, the Ether has formed a correction downtrend that reached 76.% Fibo. The local support is meanwhile at $128.20. If the resistance at $137.71 gets hit, the price will try to reach then the local high at $143.58.
Attention! Forecasts presented in this section only reflect the author’s private opinion and should not be considered as guidance for trading. RoboForex LP bears no responsibility for trading results based on trading recommendations described in these analytical reviews.
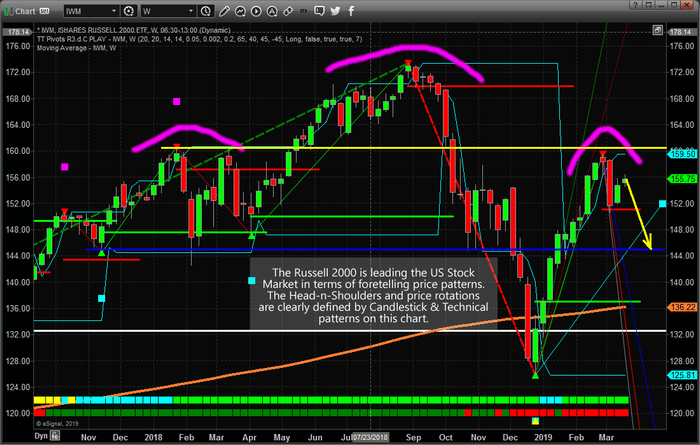
The Russell 2000 ETF continues to deliver critical technical and longer-term price patterns for skilled technicians. Combining the IWM chart with the Transportation Index, Oil, Gold, and others provide a very clear picture of what to expect in the immediate future.
Recently, we posted a research article about the Head-n-Shoulders pattern setting up in the $INDU. Again, the IWM chart is also showing a very clear Head-n-Shoulders pattern with critical resistance near $159.50 and support near $144.25. Our researchers, at Technical Traders Ltd., believe this right Shoulder will prompt a downside market move towards support near $144.25 before a downward sloping wedge pattern sets up. This first downward price leg will setup and congesting wedge formation that will, eventually, break to the upside and drive market prices higher.
We authored a research article about this pattern setup on February 17, 2019. You can read it here.
Skilled traders watch all the charts to assist them in identifying characteristics that can assist them in understanding price moves, key support/resistance levels, and price patterns. This IWM chart should be on everyone’s radar at the moment. Where the IWM finds support, so will the other US stock market indexes.
WEEKLY IWM RUSSELL 2000 INDEX PATTERN
The IWM setup indicates we may only see a 5~7% downside price swing before support is found. We’ll have to watch how this plays out over the next few weeks/months to determine if the $144.25 level is true support or if the lower $137.00 level will become support. Either way, the downside price swing appears poised to unfold over the next few days/weeks – so be prepared.
Please take a minute to visit TheTechnicalTraders.com to learn how we can help you find and execute better trades in 2019. We have already positioned our clients for this move and we believe we can help you stay ahead of these markets. Visit www.TheTechnicalTraders.com/FreeResearch/ to read all of our most recent research.
The EUR/USD is trading within the first downward wave and may reach 1.1392 today, then fall till 1.1336, which is going to be its first target.
GBPUSD
The GBPUSD is rising to 1.3166, and then it may go down to reach 1.2954, which is going to be its first target.
USDCHF
The USD is rising against the franc within the first upside movement, trying to reach 0.9953. Then, it is likely to correct to 0.9914, and then a rise to 1.0009 may follow.
USDJPY
The USDJPY is correcting to 111.04. Today, it may hit this target, and then fall till 110.67.
AUDUSD
The Aussie is correcting, in search of 0.7132; it may then fall till 0.7072.
USDRUB
The RUB hit the local downside target and may hit the low at 63.44, then is likely to return to 64.86, and then head down again, reaching 62.90, its intermediate target.
GOLD
Gold is declining, heading towards $1,301.50, which may get hit today. Then a rise to $1,310.60 may follow. After that, the downtrend may continue to $1,277.17.
BRENT
Brent crude is under pressure and is going down, with the target at $67.42. Then a rise to $68.05 may follow, and, finally, another fall to $66.66 is expected, i.e. a local target.
Attention! Forecasts presented in this section only reflect the author’s private opinion and should not be considered as guidance for trading. RoboForex LP bears no responsibility for trading results based on trading recommendations described in these analytical reviews.
The USD index stabilized after the long downfall on Wednesday. The USD is additionally supported by the positive reports from the US. The Philadelfia PMI grew by 13.7, which is more than the market expectations of 4.6. Earlier Federal Reserve noted that they will not increase the interest rates this year. Right now the quotes are consolidating with the key range being 1.13600-1.13900. You should open positions from these levels and wait for today’s economic releases.
The Economic News Feed for 22.03.2019:
– Industrial PMI index (GER) – 10:30 (GMT+2:00);
– Array of Business Activity Reports (EU) – 11:00 (GMT+2:00);
– Business Activity Reports (US) – 15:45 (GMT+2:00);
– Secondary Real Estate Sales (US) – 16:00 (GMT+2:00);
The indicators do not provide precise signals, the price has crossed 50 MA.
The MACD histogram is close to 0.
The Stochastic Oscillator is in the overbought zone, the %K line is crossing the %D line. There are no signals at the moment.
Trading recommendations
Support levels: 1.13600, 1.13350, 1.13000
Resistance levels: 1.13900, 1.14100, 1.14450
If the price fixes above 1.13900, expect the quotes to grow toward 1.14200-1.14500.
Alternatively, the quotes can fall toward 1.1300-1.13000.
The GBP/USD currency pair
Technical indicators of the currency pair:
Prev Open: 1.31922
Open: 1.31129
% chg. over the last day: -0.51
Day’s range: 1.31127 – 1.31583
52 wk range: 1.2438 – 1.4378
Yesterday the Bank of England, as expected, kept the key parameters of the monetary policy at the same level. The National Statistic Service published a positive retail sales report for February. GBP/USD is in a major sell-off and updated the key extremums due to the risk of the hard Brexit. You should track relevant info on this subject. GBP/USD quotes are consolidating around 1.31000-1.31600. You should open positions from the key levels.
The Economic News Feed for 22.03.2019 is calm.
The indicators do not provide precise signals, the price is testing 50 MA which acts as a strong dynamic resistance.
The MACD histogram is close to 0.
The Stochastic Oscillator is in the neutral zone, the %K line is below the %D line which points towards a bearish mood.
Trading recommendations
Support levels: 1.31000, 1.30300, 1.30000
Resistance levels: 1.31600, 1.32250, 1.33000
If the price fixes below 1.31000, expect the quotes to fall toward 1.30500-1.30200.
Alternatively, the quotes can recover toward 1.32000-1.32400.
This article reflects a personal opinion and should not be interpreted as an investment advice, and/or offer, and/or a persistent request for carrying out financial transactions, and/or a guarantee, and/or a forecast of future events.
USD/CAD started to grow. Yesterday the quotes covered 75 points and updated the local maximums. Right now the pair is consolidating around 1.33450 and 1.33750 while the investors are waiting for more economic reports. You should open positions from these levels and keep an eye on the oil quotes dynamics, as well as the US Treasury bonds` yield.
At 14:30 (GMT+2:00) Canada will publish the inflation and retail sales reports.
The indicators do not provide precise signals: 50 MA crossed 200 MA.
The MACD histogram is in the positive zone but below the signal line which gives a weak signal to buy USD/CAD.
The Stochastic Oscillator is in the neutral zone, the %K line is crossing the %D line. There are no signals at the moment.
Trading recommendations
Support levels: 1.33450, 1.33150, 1.32900
Resistance levels: 1.33750, 1.34000, 1.34300
If the price fixes above 1.33750, expect the quotes to grow toward 1.34000-1.34300.
Alternatively, the quotes can fall toward 1.33200-1.32900.
The USD/JPY currency pair
Technical indicators of the currency pair:
Prev Open: 110.615
Open: 110.854
% chg. over the last day: +0.11
Day’s range: 110.535 – 110.898
52 wk range: 104.56 – 114.56
USD/JPY stabilized after a sharp fall on Wednesday, March 20. Right now the trading instrument is testing the key support and resistance levels at 110.500 and 110.850. The quotes can descend further since USD is under pressure after the Federal Reserve comments. The regulator will not adjust the interest rates this year. You should open positions from the key levels.
During the Asian trading session, Japan published a weak inflation report.
The price fixes below 50 MA and 200 MA which points to the power of the buyers.
The MACD histogra started to descend which points to the bearish mood.
The Stochastic Oscillator is in the neutral zone, the %K line is below the %D line which also sugessts you should sell USD/JPY.
Trading recommendations
Support levels: 110.500, 110.350, 110.000
Resistance levels: 110.850, 111.150, 111.450
If the price fixes below 110.500, expect the qutoes to fall toward 110.000.
Alternatively, the quotes can grow toward 111.150-111.400.
The US dollar is recovering losses against currency majors. It should be recalled that the US currency was under pressure after the Fed comments. The regulator reported it would not consider interest rates rise in the current year. Optimistic economic data support the US dollar. Thus, the number of initial jobless claims dropped to 221K, while experts expected 226K. Philadelphia Fed manufacturing index rose to 13.7 instead of the forecasted value of 4.6. The dollar index (#DX) closed the trading session in the positive zone (+0.67%).
Financial market participants continue to assess the situation concerning trade negotiations between Washington and Beijing. Mnuchin and Lighthizer will go to China for a new round of talks next week. However, the conclusion of a deal is still far away, as US President Donald Trump expects China to increase imports of American goods.
The British pound weakened significantly against the US dollar due to the controversy concerning Brexit. Yesterday, a summit of 27 EU countries was held, on which the leaders of the countries decided on the UK exit. Thus, the leaders of the countries gave the British Prime Minister Theresa May a two-week reprieve until April 12. During this time, she should either convince parliamentarians to vote for the Brexit agreement offered earlier, or present a new agreement, or choose the option to exit without a deal with Brussels. The EU wants Britain to exit the union before May 23 – the date of the election to the European Parliament. If the exit doesn’t take place, it will have to be held before June 30, i.e., before the convening of the new EU Parliament.
Meanwhile, the situation is heating up since it seems that the residents of the UK want to stay in the block. More than a million people have signed a petition on the website of the British Parliament, calling on the government to withdraw Brexit notification.
The “black gold” prices have moved away from annual highs. At the moment, futures for the WTI crude oil are testing the mark of $59.60 per barrel.
Market Indicators
Yesterday, the bullish sentiment was observed in the US stock market: #SPY (+1.13%), #DIA (+0.89%), #QQQ (+1.56%).
The 10-year US government bonds yield is at the level of 2.50-2.51%.
The news feed on 22.03.2019:
– German manufacturing PMI at 10:30 (GMT+2:00); – A number of indices of economic activity in the Eurozone at 11:00 (GMT+2:00); – Reports on inflation and retail sales in Canada at 14:30 (GMT+2:00); – Statistics on economic activity in the US at 15:45 (GMT+2:00); – Existing home sales in the US at 16:00 (GMT+2:00).
On Thursday the 21st of March, trading on the US dollar index closed up. The DXY completely recovered Wednesday’s losses, which were incurred after the Fed’s interest rate decision and subsequent monetary policy statement along with Jerome Powell’s press conference.
This significant correction was driven by the pound’s collapse. The pound came under pressure over fears that the UK could leave the European Union without a deal. All eyes are now on the European Union, who must now approve a departure date for the UK.
The bulls were unable to keep up their defence of 1.1410. The pound’s collapse took its toll on all the major currencies. Although the single currency got some support via the EURGBP cross, the bulls were still forced back to 1.1343. Markets completely ignored the Bank of England’s meeting.
The bears have completely pared Wednesday’s gains, forming a bearish engulfing on the daily timeframe. This is a bearish candlestick pattern, and since the 1.1336 low wasn’t broken through, the bulls could have brought the rate back up to 1.1423.
As today is Friday, the upwards correction is limited to 50% (1.1403) of the large candlestick from the 20th of March. Yesterday, this level acted as a key support for the bulls, as anyone who opened a long position above this level suffered losses. The drop intensified as traders closed their long positions.
The pound is showing decent growth today. We’re keeping an eye on Brexit news. Barring any negative headlines from the UK or EU, the euro could gather some momentum. We’ve had a lot of swings this week thanks to the FOMC and Brexit.
During the past few years there has been much talk about Bitcoin and other cryptocurrencies. There are several ways that you could take advantage of the cryptocurrency craze, for instance by mining them or trade them. Did you know that it is possible to trade raw materials such as gold as well? Gold is one of those assets that is considered to be by some as a safe haven asset during uncertain financial times as it might be in demand.
Trading commodities such as gold trading is a trade you may want to consider without the security and storage concerns that come with physically holding the commodity yourself. Since trading gold is considered one of the most complex and volatile Forex markets to tackle, we recommend to check out Vestle platform for gold CFD trading.
Many experienced traders would advise caution before entering the gold trading market due to its large fluctuations and broad pip range. Here are some useful tips on what you should know if you’re interested in getting started in the world of gold trading.
Know your facts & read up on the history of gold: Gold as a major trading commodity has a history dating back over 100 years. You’ll want to study the gold fluctuation record extensively to get a good feel for how it changes given certain circumstances/events.
2. Identify the catalysts: Gold contracts are a strange member of the Forex currency field. It occupies an unusual place in the human psyche thanks to its multi-faceted role is history as both an ornament, a symbol of status and a stand-in for physical currency. As such, there are many misconceptions and false opinions on how it behaves as a CFD in the Forex market. Four things have a big impact on the fluctuation of gold: inflation, greed, fear, and supply. Understanding the current mix of these four elements will help you get a better sense of how gold CFDs are going to behave in the near future.
3. Acclimatize to the range: Gold’s pip range can be larger than other CFD instruments even from one day to the next. These shifts can be a little disorientating for some people at first so make sure you are comfortable with the larger numbers before making any big trades.
4. Learn to differentiate the swings from the runs: As a Forex currency, gold is highly volatile and regularly swings 100 pips one way or the other. However, it also goes on consistent runs while everyone is waiting for a reversal. Many traders attempt to identify these trends. Check out Vestle’s live rates and the current fluctuation in gold prices.
5. You may want to consider waiting for candle close: If you have an important decision to make, consider waiting until the candle has fully closed. Gold’s volatility means it can experience big swings even in the last minute of a candle.
6. Have a plan: Try to make sure that your strategy is well thought out and consistent.
7. Beginners beware: Gold is a complex market and it is often a good idea to take on other, less volatile markets before tackling the metals.
8. Avoid the ‘Hail Mary’ approach as well: If you are struggling in other markets, then it would be best to avoid the temptation of jumping into gold trading. For gold trading, it’s best to keep a clear head and not get into desperation.
9. Understand the players: Forex gold trading attracts a particular crowd, such as ‘Gold bugs’ and institutional investors.
The materials contained on this document are not made by Vestle but by an independent third party and should not in any way be construed, either explicitly or implicitly, directly or indirectly, as investment advice, recommendation or suggestion of an investment strategy with respect to a financial instrument, in any manner whatsoever. CFDs are complex instruments and come with a high risk of losing money rapidly due to leverage. 88% of retail investor accounts lose money when trading CFDs with Vestle. You should consider whether you understand how CFDs work and whether you can afford to take the high risk of losing your money. Full disclaimer: https://www.vestle.com/legal/analysis-disclaimer-third-party.html