The USD has recovered perfectly against the common currency, with the investors easily overcoming the Fed meeting stress.
The Fed was very dovish this time and issued a few hints on not hiking the rates in the coming months. This is most likely the ‘White House effect’, as Trump previously said he didn’t need a strong dollar.
No hikes are actually expected before 2020. The Fed said this is to help the businesses. Besides, the US central bank is going to buy out less cash liquidity in May, which means the security limits will drop and stop keeping the cash market under pressure.
There’s no wonder the dollar was very much weakened, but nevertheless it recovered in just a couple of days. The investors are likely to believe the Eurozone is doing even worse.
On H4, the EURUSD broke out the midterm descending channel resistance last week due to the Fed comments. Now it looks like the market priced it too much, and the quotes got back to the previous channel. This may be an ascending trend signal, too, though. If the price succeeds in breaking out the resistance at 1.1340 once more, it may then reach the projection resistance at 1.1550. This is now confirmed by the MACD.
The H1 chart shows the descending trend in detail, with a support breakout attempt after a local pullback. The correction is headed towards the resistance at 1.1340; once it gets tested, a new downward move is expected, which is signaled by the MACD.
Disclaimer
Any predictions contained herein are based on the authors’ particular opinion. This analysis shall not be treated as trading advice. RoboForex shall not be held liable for the results of the trades arising from relying upon trading recommendations and reviews contained herein.
Wow, what a week for USD! First, on Wednesday, traders were surprised by the ‘more than expected’ dovish approach from the FOMC, which provoked them to short the US dollar. Then, on Thursday and Friday, this pessimism towards the USD vanished almost entirely. Well, it depends on the pair, but on AUDUSD, for example, we are even lower than before the FOMC meeting.
On Wednesday, after the FOMC, everything looked great for buyers. The pair defended the orange support at around 0.707 and went higher. In addition to this, we managed to break two important resistances. The first of these was the mid-term downwards trend line (black) and the second one was the upper line of the flag formation (upper blue). In theory, that was a very strong buy signal. Well, sometimes theory doesn’t work in practice. The pair didn’t manage to hold on to Wednesday’s gains and dropped like a rock. Today, we are testing the 0.707 support again, which is holding up so far. We have a bounce, but the size and momentum of the reversal is so far questionable. I would wait a little bit more before opening a long position. The risk of a bearish breakout is still quite high.
As long as we stay above the orange area, we do not have a legitimate sell signal. This will be available if the pair closes the day below that support. After last week’s reversal, the chances of that are quite high.
The EURUSD went below 1.1280, thus completing its downtrend target. Today, the pair is trading sideways and consolidating near 1.1294. The price may run further down to 1.1268, and then rise to 1.1320, thus forming a range. This range may then either get broken out top down, falling to 1.1155, or bottom up, hitting 1.1389.
GBPUSD
The GBPUSD is rising to 1.3266, but can sink today to 1.3240. The next move is likely to be a rise to 1.3266, and then another plunge to 1.3140.
USDCHF
The USD/CHF reached its rise and correction target. Today, it may rise to 0.9984. After that, it is likely to get down to 0.9955, and finally rise, reaching 1.0017, which is going to be the first target.
USDJPY
The pair is being pushed down, and may reach $109.55 today. Then a rise to 110.53 is likely, and then a sink to 109.29, i.e. a local target.
AUDUSD
The Aussie is going down in search of 0.7054; then a rise to 0.7108 is likely, and after that, it may go back to 0.6996, i.e. a local target.
USDRUB
The Russian currency is correcting, trying to reach 64.90. It may then fall till 62.77, i.e. a local target.
GOLD
The yellow metal is being pushed upwards. Once the it goes above $1,314.75, it may start rising towards $1,325.75, and then a sink to $1,308.50.
BRENT
The Brent is working out the first downward wave, the target lying at 65.45. Then a rise to 67.07 is likely, and then a fall back to $63.95, i.e. a local target.
Attention! Forecasts presented in this section only reflect the author’s private opinion and should not be considered as guidance for trading. RoboForex LP bears no responsibility for trading results based on trading recommendations described in these analytical reviews.
It was another interesting Fed meeting and statement that caused some serious volatility in the markets to end the week. No doubt a risk off trade has developed as yields fell hard around the world. Be sure to go back through the week and listen to some of the daily editorials posted post-Fed. There’s a lot of good information.
Segment 1 – Marc Chandler, Managing Partner at Bannockburn Global ForEx shares his thoughts on the Fed statement and situation that the central banks are in. Interest rates are historically low, and even negative in many countries, but the global economy continues to slow.
Segment 2 – Chris Vermeulen, Founder of The Technical Traders has some thoughts on how far the market could breakdown.
Segment 3 – Jeff Christian, Managing Partner at the CPM Group weighs in on the precious metals markets and when he sees a recession hitting the US.
Segment 4 – We get an update from IsoEnergy and the President and CEO Craig Parry. IsoEnergy has been drilling some good exploration holes and looking to continue stepping out through the year. Click here to visit the IsoEnergy website.
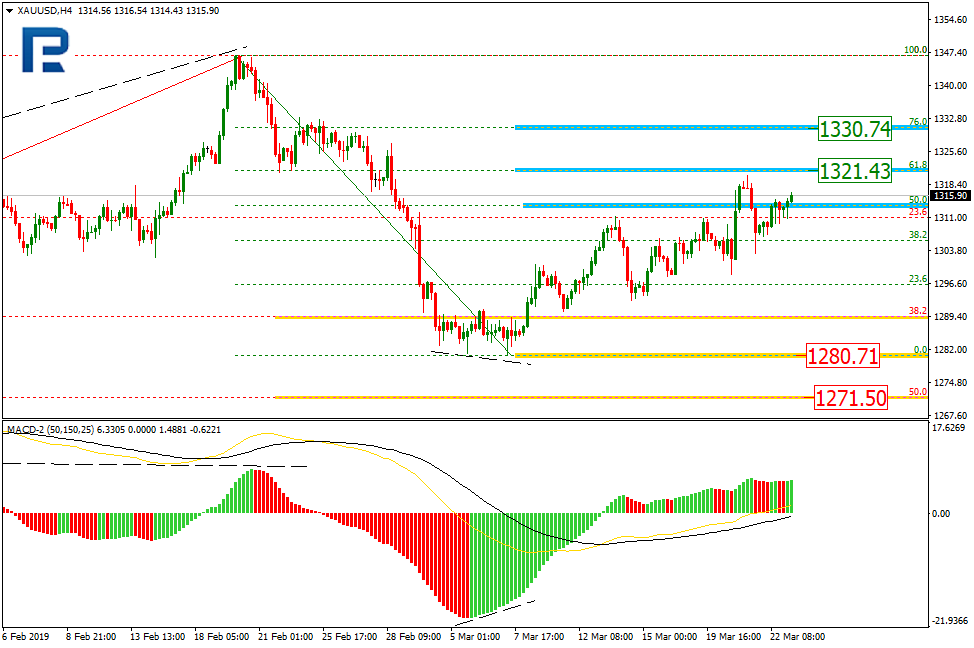
On H4, the gold is forming a correction uptrend, which reached 50% Fibo. The next targets may lie at 61.8%, or $1,321.43, and at 76%, or $1,330.74. The major support is meanwhile at $1,280.71. If it gets broken out, the price may hit the midterm 50% level, or $1,271.50.
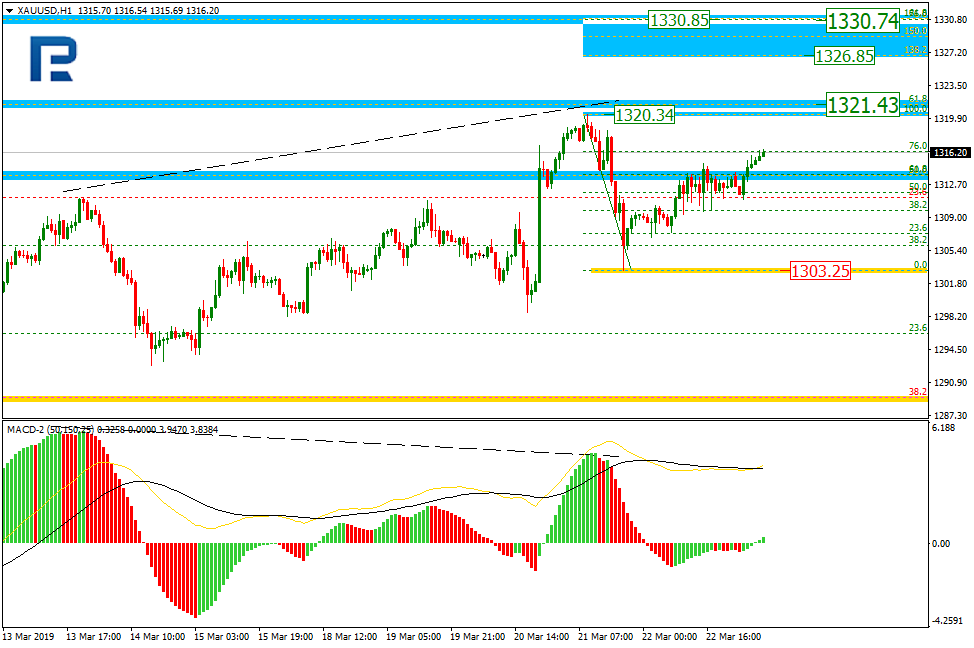
On H1, another upward move is forming after the pullback. Once the local high at $1,320.34 gets broken out, the price is likely to reach the range of 138.20% to 161.80% Fibo, or $1,326.85 to $1,330.85. The major support is meanwhile at the low, or $1,303.25.
USDCHF
On H4, the USDCHF is falling, having reached 23.60% Fibo. The price is starting a long term downtrend, with the next target at at 38.2%, or 0.9782. The resistance is meanwhile at the 1.0149 high.
On H1, the USDCHF is correcting upwards. The correctional trend reached 23.6o% Fibo and may move to 38.20% (0,9982) and 50% (1.0009).
Attention! Forecasts presented in this section only reflect the author’s private opinion and should not be considered as guidance for trading. RoboForex LP bears no responsibility for trading results based on trading recommendations described in these analytical reviews.
On Friday, March 22, the EUR/USD quotes fell after the publication of weak reports from the EU. The PMI indices reached the long-time minimums. The investors are worried about the risk of a recession in the EU. Right now the quotes are consolidating around 1.12800-1.13150 and has a tendency to descend further. You should open positions from the key levels.
At 11:00 (GMT+2:00) Germany will publish the IFO business climate index.
The indicators do not provide precise data, 50 MA is crossing 200 MA.
The MACD histogram is in the negative zone but above the signal line which gives a weak signal to sell EUR/USD.
The Stochastic Oscillator is in the overbought zonem the %K line is crossing the %D line. There are no signals at the moment.
Trading recommendations
Support levels: 1.12800, 1.12500
Resistance levels: 1.13150, 1.13500, 1.13900
If the price fixes below the local support 1.12800, expect the quotes to fall toward 1.125001.12300.
Alternatively, the quotes can recover toward 1.13500-1.13700.
The GBP/USD currency pair
Technical indicators of the currency pair:
Prev Open: 1.31129
Open: 1.32141
% chg. over the last day: +0.79
Day’s range: 1.31597 – 1.32154
52 wk range: 1.2438 – 1.4378
GBP/USD has an ambiguous technical picture. Right now the GBP is consolidating. The financial market participants are waiting for the next Brexit vote. As a reminder, the EU agreed to postpone Brexit until May 22, should the British Parliament approve this vote. If the quorum won’t be reached until March 29, the Brexit will happen on April 12. The key support and resistance levels are 1.31600 and 1.32250. You should open positions from these levels.
The Economic News Feed for 25.03.2019 is calm.
The indicators do not provide precise signals, the price fixed between 50 MA and 200 MA.
The MACD histogram is in the positive zone but below the signal line which gives a weak signal to buy GBP/USD.
The Stochastic Oscillator is in the neutral zone, the %K line is above the %D line which points to the bullish mood.
Trading recommendations
Support levels: 1.31600, 1.31000, 1.30300
Resistance levels: 1.32250, 1.33000, 1.33600
Should the price fix above 1.32250, expect the quotes to grow toward 1.32750-1.33000.
Alternatively, the quotes can fall toward 1.31000.
This article reflects a personal opinion and should not be interpreted as an investment advice, and/or offer, and/or a persistent request for carrying out financial transactions, and/or a guarantee, and/or a forecast of future events.
CAD kept losing positions on Friday against the USD. The quotes grew by 65 points. The trading instrument reached the monthly maximums. The pressure on CAD is caused by the weak retail sales in Canada. The quotes are consolidating around 1.34000-+1.34400. You should open positions from the key levels and keep an eye on the oil quotes dynamics.
The Economic News Feed for 25.03.2019 is calm.
The price fixed above 50 MA and 200 MA which points to the power of the buyers.
The MACD histogram is in the positive zone but below the signal line which points to the growth of USD/CAD.
The Stochastic Oscillator is in the oversold zone, the %K line is above the %D line which points to the bullish mood.
Trading recommendations
Support levels: 1.34000, 1.33750, 1.33500
Resistance levels: 1.34400, 1.35000
If the price fixes above 1.34400, expect the quotes to grow toward 1.35000.
Alternatively, the quotes can fall toward 1.33750-1.33500.
The USD/JPY currency pair
Technical indicators of the currency pair:
Prev Open: 110.854
Open: 109.996
% chg. over the last day: -0.80
Day’s range: 109.708 – 110.240
52 wk range: 104.56 – 114.56
USD/JPY is in an agressive sell-off again. The quotes fell by 100 points and updated the local minimums. The demand for the safe assets has grown. The investors are worried about the recession in the world economy. Right now USD/JPY has stabilized around 109.800-110.300. You should open positions from these levels and keep an eye on the US Treasury bond’s dynamics.
The Economic News Feed for 25.03.2019 is calm.
The price fixed below 50 MA and 200 MA which points to the power of the sellers.
The MACD histogram is in the negative zone but above the signal line which gives a weak signal to sell USD/JPY.
The Stochastic Oscillator is in the neutral zone, the %K line is above the %D line which points to the bullish mood.
Trading recommendations
Support levels: 109.800, 109.500
Resistance levels: 110.300, 110.600, 110.900
If the price fixes below 109.800, expect the quotes to fall toward 109.500-109.300.
Alternatively, the quotes can recover toward 110.600-110.900.
Our researchers have been glued to Gold, Silver and the Precious Metals sector for many months. We believe the current setup in Gold is a once-in-a-lifetime opportunity for skilled traders to stake positions below $1300 before a potentially incredible upside price move. We’ve been alerting our members and follower to this opportunity since well before the October/December 2018 downside price rotation in the US markets.
Additionally, our researchers called the bottom in the US equities markets and warned of an incredible upside price rotation setting up just before the actual price bottom occurred on December 24, 2018.
Our research continues to suggest that Gold and Silver will rotate within a fairly narrow range over the next 3~5 weeks before setting up a likely price bottom near April 21, 2019. We’ve been predicting this bottom formation for many months and have been warning our followers to prepare for this move and grab opportunities below $1300 when they set up.
This first chart, a Monthly chart showing our TT Charger price modeling system, clearly illustrates the strength of this bullish price trend and the initiation of this trend back in early 2016. One of the strengths of the TT Charger modeling system is that it establishes a number of key price data points and trend factors. The background color highlighted ranges show price range breadth and range expansion or contraction. The dual channel facets show where price is likely to find support and resistance. The DOT LEVELS show where critical support or resistance is in terms of the overall trend channels.
Right now, we are still in a bullish trend with key support near $1165. The Dual Channel system is showing the $1260 to $1285 level is currently the most likely active support levels just below current price. Thus, we could see a move to near these levels over the next 3+ weeks and I would suggest skilled traders jump on this opportunity. The Range system is showing a current $250~350 price range, thus, any upside price breakout could easily rally within this range and push prices at least $250+ higher than current levels – likely well above $1550. If range expansion sets up, we could see prices well above $1750.
We’ve authored hundreds of research posts over the past 12+ months and the one thing that we continue to mention is that Fibonacci price theory continues to operate on the premise that “price must always attempt to find and establish new price highs or lows – at all times”. Please keep this in mind as we continue.
Take a look at the TT Charger chart, above, and the raw Monthly price chart, below. Price must always attempt to find and establish new price highs or lows – so where is price going based on the most recent price rotations? Let’s review…
After rallying in early 2016 to establish a price high of $1377.50, gold immediately rotated downward to establish a higher low near $1124.50. The $1377.50 high price was a “new price high” in terms of previous rotational highs while the $1124.50 low was a higher low price rotation point. Thus, a failed “new price low”.
Since these two price points, Gold has settled into a sideways price channel where new price highs and lows have been attempted, but have failed to breakout out of the existing previous high and low price levels. As a technician of price, we can immediately identify this as a possible “Pennant or Flag” formation. With the last “new price level” being a “new price high” we still believe that Gold will attempt to break above the recent high price levels and attempt a much bigger upside price swing.
Our analysis suggests the April 21 date as a critical date for the potential price bottom in Gold and Silver. Our belief is that this date will like result in a near-term momentum bottom in price. Where price may fall, briefly, below $1290 and rotate into a “washout low” price rotation. The opportunity for this move could come 3~5 days before or after the April 21 date.
This last chart, a Monthly price chart, illustrating the Pennant/Flag formation in Gold should be the clearest example we can provide that Gold will soon break out to the upside and rally extensively higher if our research and analysis are correct. The momentum that has built up over the past 2+ years, as well as the global demand for Gold by central banks and by investors as a hedging instrument, could prompt Gold and Silver to rally at least 50~60% in this first upside breakout wave – resulting in $1900 gold prices. Silver could rally to well above $18~19 in a similar move and the number our researchers believe may become the upside target in Silver is $21.
This big picture chart and technical pattern could still take months to unfold if the price is to test the lower end of the trading range at $1225. If our analysis is correct, Gold and Silver could begin an upside price breakout shortly after April 21 (very likely to become evident in early May 2019). The upside potential for this move is at least $1550 in Gold and at least $18 in Silver.
Please understand that any upside breakout in Gold and Silver will likely be associated with general global market weakness including the potential for some type of global crisis event. This could be related to the EU, BREXIT, China, France or any other nation burdened by debt, dealing with election turmoil or related to social or economic angst. We could almost throw a dart at a map of the globe and hit some area that is poised for some type of economic crisis.
Our last buy signal for gold and gold miners was in Sept 2018 and subscribers and our team profited from that $100 gold rally. This next opportunity here is to understand that we only have about 20~25 days to search out and isolate the best entry prices we can find in Gold and Silver before our April 21 momentum bottom date hits. This means we need to prepare for this upside breakout move in Precious Metals and prepare our other open positions for the possibility of extended downside pricing concerns. If you read our continued research posts, you’ll understand that we believe the US stock market will rotate a bit lower prior to this April 21 date and rally as well.
We believe the US equities markets will become a safe-haven, like Gold, where foreign investors can balance the strength of the US Dollar with the strong US economy and continued equity price appreciation while more fragile nations deal with economic crisis events and debt concerns. Thus, we believe capital will flood the US markets after April 21 as evidence of these economic concerns drives foreign investors into US equities.
Take a minute to find out why Technical Traders Ltd. is quickly becoming one of the best research and trading services you can find anywhere on the planet. We are about to launch a new technology product to assist our members and we continue to deliver incredible research posts, like this one, where we can highlight our proprietary price modeling systems and adaptive learning solutions. If you want to stay ahead of these markets moves and find greater success in 2019 and beyond Join Our Wealth Trading Newsletter Today.
On Friday, the US dollar strengthened slightly against a basket of major currencies. The dollar index (#DX) closed the trading session in the positive zone (+0.17%). The euro collapsed after the publication of weak economic data. Thus, German manufacturing PMI fell to 44.7, while experts expected 48.0. Markit composite PMI also updated the lows and counted to 51.3 instead of 52.0.
Demand for safe assets has increased significantly. The yield spread between 3-month and 10-year US bonds has been first inverted since 2007. Financial market participants are increasingly concerned about rising recession risks in the global economy. Meanwhile, the US currency was additionally supported by an optimistic report on existing home sales for February. The indicator rose to 5.51M instead of the forecasted value of 5.10M.
Investors are still focused on Brexit. It should be recalled that the EU agreed to delay Brexit until May 22, if British parliamentarians approve the agreement. If legislators do not accept the Brexit until March 29, the extension will be valid until April 12. However, it became known that the British parliamentarians wanted to hold a vote on taking Brexit in their hands, and Theresa May’s ministers intended to force her to resign. Meanwhile, anti-Brexit petition has gained almost 5 million signatures.
The “black gold” prices are falling. At the moment, futures for the WTI crude oil are testing the mark of $58.85 per barrel.
Market Indicators
On Friday, aggressive sales were observed in the US stock market: #SPY (-1.92%), #DIA (-1.78%), #QQQ (-2.20%).
The 10-year US government bonds yield fell significantly. At the moment, the indicator is at the level of 2.45-2.46%.
The news feed on 25.03.2019:
– German IFO business climate index at 11:00 (GMT+2:00).
Last week was pretty rough for the US Dollar. We witnessed an impressive decline after the FOMC meeting followed by a nice recovery on Friday. On most of the currency pairs on the market, USD is trying to recover all its losses from Wednesday. This is not the case on USDJPY, where yes, we do have a correction now, but it is pretty small and does not change the strong bearish sentiment here. USDJPY was on our radar on Thursday when our outlook was also bearish. That was a great call as the price declined sharply.
The big picture here is that on Wednesday, sellers managed to break the lower line of the flag pattern (red) and the lower line of the symmetrical triangle formation (blue). That was a combination of a fundamental event (dovish FOMC) and a proper technical setup. When these two factors combine, there can only be one result; a massive drop, which is what happened here. On Friday, sellers additionally managed to break the support around 110.2, even despite the fact that on the other pairs, USD was gaining strength. One of the main reasons for this was the strength of the second currency in this pair – JPY.
From a technical point of view, this pair s pretty much doomed. We’ve managed to escape from those two patterns, we are below the support, and the long-term trend is now negative. That is bad and buyers should not have big hopes for the future. As long, as we stay below the orange area, the sentiment is negative and the pair should be able to make new mid-term lows.
‘Even more dovish than the market expected’ – Good summary quote of the FOMC’s March meeting, which in itself is interesting considering the market has been considerably bearish on the outlook of the global growth story over the past 6 months.
Bring it back to a USD perspective: we have been expecting a moderation in the USD in 2019 after a stellar 2018. Now, in some crosses, this has indeed been the case i.e. GBP. However, DXY (the USD Basket) as be rather resilient to this moderate as the likes of the EUR face headwinds of their own due to domestic and international economics.
So, has the Fed finally caused the forecasted moderation in the USD on the back of the March meeting?
In the short term yes, medium term unlikely, here is why: – Dot Plots: moved to ‘No Move’ in 2019 with 1 hike in 2020 which would take the Fed funds rate to 2.5% in the next 21 months. No hikes are expected in 2021 meaning sometime in 2022 or beyond another rate rise is needed to reach the median estimate of the neutral rate which remained at 2.75%. The sharp change to the dots explains the fast and sharp decline in the USD and the steepened US yield curve post the press conference. The market actually believes the next movement in the Fed funds rate is actually a cut. All this is a clear a USD moderator.
– Balance sheet runoff: As foreshadowed by the Board the balance sheet run-off will conclude come September with a reduction in the current speed starting in May. When all is said and done the Fed’s balance sheet will stand at 17% of US GDP or US$3.7 trillion, significantly higher than originally wished. This will release the pressure building in fixed income and the overall financial ‘tightness’ that has been felt in lending. Again, one could argue a USD moderate on this point.
However, its Powell’s testimony that points to why the sharp USD declines are unlikely to last over the year. – He is clearly not concerned about the domestic growth outlook; noting the weak December retail sales read was “inconsistent with a significant amount of other data.” i.e. wealth effect, employment, wage growth and corporate earnings.
– Notes some downside risks to inflation, which the Fed is using as its justification for its back down around its rate hike case. Powell stated that “some indicators of longer-term inflation expectations remain at the low end of their ranges in recent years,” and followed that up with “feel that we have [not] convincingly achieved our 2% mandate in a symmetrical way.”
– His synopsis of all of this is the current policy rate as already “in the range of neutral”, that it was “a great time for us to be patient” and reiterate twice that the policy rate is “in a good place’.
The conclusion from all of this is the Fed is more concerned about the impacts of the global growth slowdown on the US economy rather than the domestic economy itself. Europe, China and Japan are slowing, and this would suggest the EUR, JPY and EM currencies are going to slide as traders shed risk and head to stronger currency economies, namely the US.
Yes, this will irk the President and to some extent the Fed too, but as 2019 drifts on the current declines in the USD are likely to tempter as the crosses see higher economic risks.