Analytics by JustForex
The EUR/USD currency pair
- Prev Open: 1.12696
- Open: 1.12516
- % chg. over the last day: -0.12
- Day’s range: 1.12342 – 1.12612
- 52 wk range: 1.1214 – 1.2557
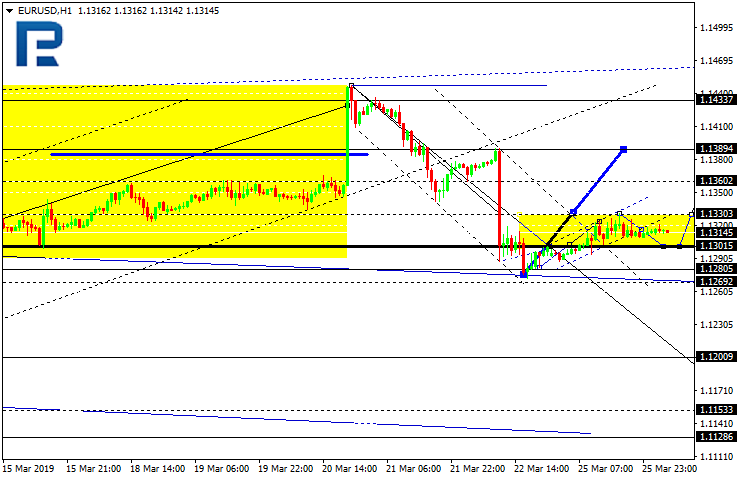
EUR/USD keeps the bearish mood. EUR is under pressure after Mario Draghi’s statements that the key ineterest rates` growth can be postponed further. Right now the key support and resistance levels are 1.12350 and 1.12750. Today the investors will be evaluaing the important economic releases in the US. Open the positions from the key levels.
The Economic News Feed for 28.03.2019:
- – GDP report (US) – 14:30 (GMT+2:00);
- – Unfinished Real Estate Sales Index (EU) – 16:00 (GMT+2:00);

The price is below 50 MA and 200 MA which points to the power of the sellers.
The MACD histogram is in the negative zone but above the signal line which gives a weak signal to sell EUR/USD.
The Stochastic Oscillator is in the neutral zone, the %K line is below the %D line which points to the bearish mood.
- Support levels: 1.12350, 1.12000
- Resistance levels: 1.12750, 1.13000, 1.13250
If the price fixes below 1.12350, expect the quotes to fall toward 1.12000.
Alternatively, the quotes can recover toward 1.13000-1.13250.
The GBP/USD currency pair
- Prev Open: 1.32053
- Open: 1.31560
- % chg. over the last day: -0.43
- Day’s range: 1.31254 – 1.31985
- 52 wk range: 1.2438 – 1.4378
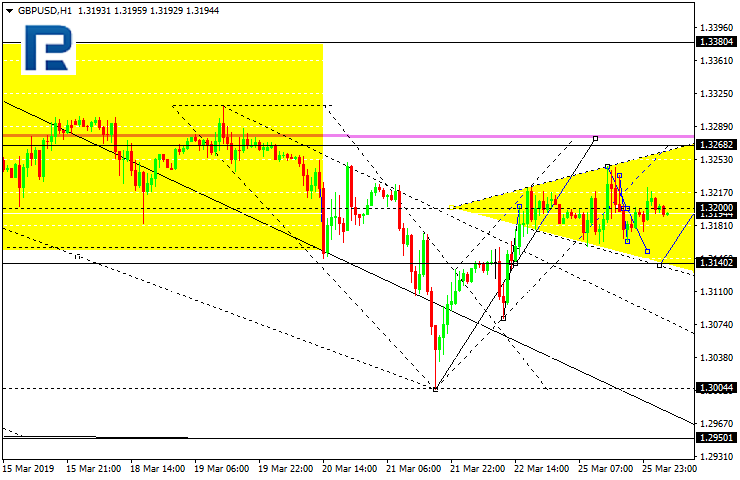
GBP/USD started to descend. The trading instrument updated the local minimums. An ambigous situation around Brexit keeps pushing GBP down. Yesterday the British Parliament rejected all 8 Brexit project. The key support and resistance levels are 1.31400 and 1.32000. The GBP/?USD quotes have a tendency to descend. You should open positions from the key levels.
The UK Economic News Feed for 28.03.2019 is calm. Keep an eye on the US news feed.

The indicators point to the power of the sellers, the price fixed below 50 MA and 200 MA.
The MACD histogram is in the negative zone and below the signal line which gives a signal to sell GBP/USD.
The Stochastic Oscillator is in the neutral zone, the %K line is below the %D line which also points to the bearish mood.
- Support levels: 1.31400, 1.31000, 1.30300
- Resistance levels: 1.32000, 1.32500, 1.33000
If the price fixes below 1.31400, expect the qutoes to fall toward 1.31000.
Alternatively, the qutoes can grow toward 1.32300-1.32600.
This article reflects a personal opinion and should not be interpreted as an investment advice, and/or offer, and/or a persistent request for carrying out financial transactions, and/or a guarantee, and/or a forecast of future events.
Registration The USD/CAD currency pair
- Prev Open: 1.33843
- Open: 1.34113
- % chg. over the last day: +0.23
- Day’s range: 1.34014 – 1.34313
- 52 wk range: 1.2248 – 1.3664
USD/CAD keeps its ambiguous technical picture. The quotes are in a flat, currently testing 1.34000 and 1.34400 levels. The financial market participants are waiting for important reports from the US. Keep an eye on the oil quotes dynamics. You should open positions from the key levels.
The Economic News Feed for 28.03.2019 is calm.

The indicators point to the power of the buyers, the price fixed above 50 MA and 200 MA.
The MACD histogram is in the positive zone and keeps rising, which points to the growth of USD/CAD.
The Stochastic Oscillator is in the neutral zone, the %K line is above the %D line which points to the bullish mood.
- Support levels: 1.34000, 1.33750, 1.33500
- Resistance levels: 1.34400, 1.35000
If the price fixes above 1.34400, expect the quotes to grow toward 1.35000.
Alternatively, the quotes can descend toward 1.33750-1.33500.
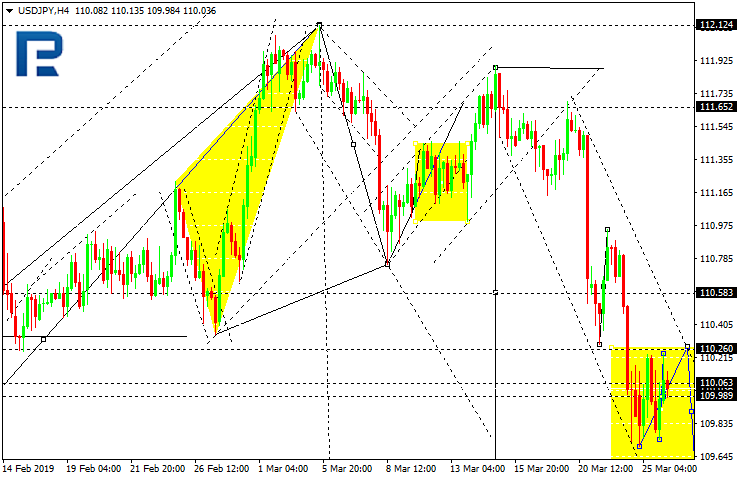
The USD/JPY currency pair
- Prev Open: 110.591
- Open: 110.457
- % chg. over the last day: -0.13
- Day’s range: 110.018 – 110.531
- 52 wk range: 104.56 – 114.56
USD/JPY shows an ambigous technical picture. The trading instrument is moving in a flat, the supply and demand zones are 110.000-109.800 and 110.500-110.700. The investors are waiting for additional drivers. Keep an eye on the economic releases and the US Treasury Bonds` yield. Open the positions from the key levels.
The Economic News Feed for 28.03.2019 is calm.

The indicators do not provide precise signals, the price is testing 50 MA.
The MACD histogram is in the negative zone but above the signal line which gives a weak signal to sell USD/JPY.
The Stochastic Oscillator is in the neutral zone, the %K line is above the %D line which points to the bullish mood.
- Support levels: 110.000, 109.800, 109.500
- Resistance levels: 110.500, 110.700, 111.150
If the price fixes below the round 110.000, expect the quotes to fall toward 109.600-109.400.
Alternatively, the quotes can grow toward 110.800-111.000.
Analytics by JustForex