The EURUSD is still forming a descending trend, with the price bouncing off 1.1258 and headed to 1.1186. Then, the pair may correct to 1.1236, and then fall till 1.1144, i.e. a local target.
GBPUSD
The GBP/USD is being under pressure, with the target lying at 1.3000. The pair may correct today to 1.3100. After that the pair is likely to get down to 1.3000, then, to form a consolidation range, and then, once a breakout occurs, to hit 1.2950, which is going to be the first target.
USDCHF
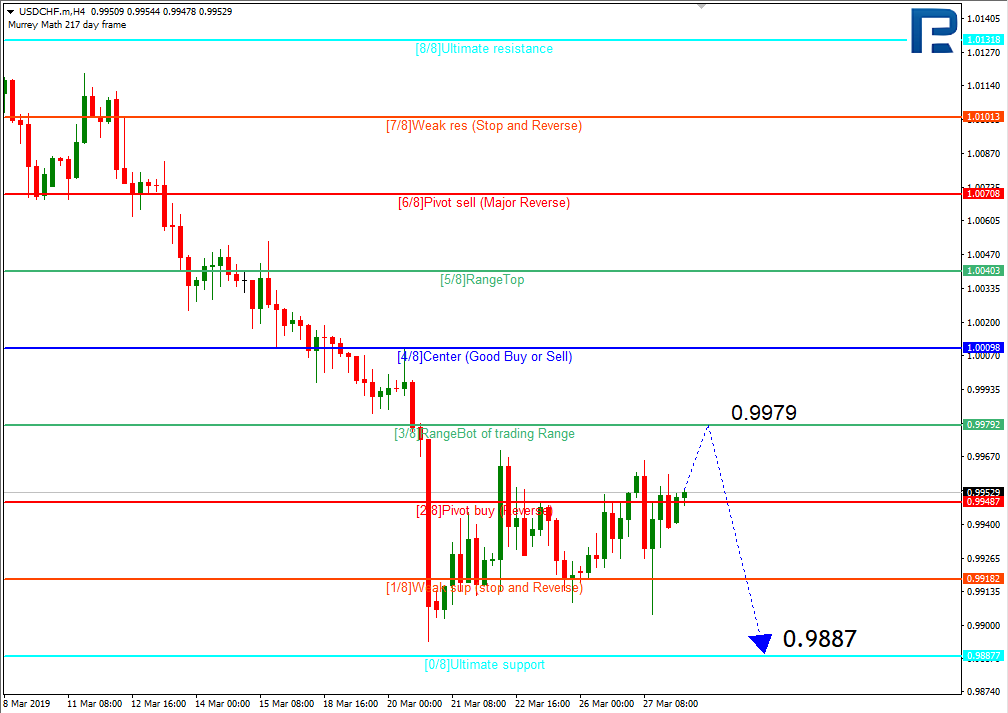
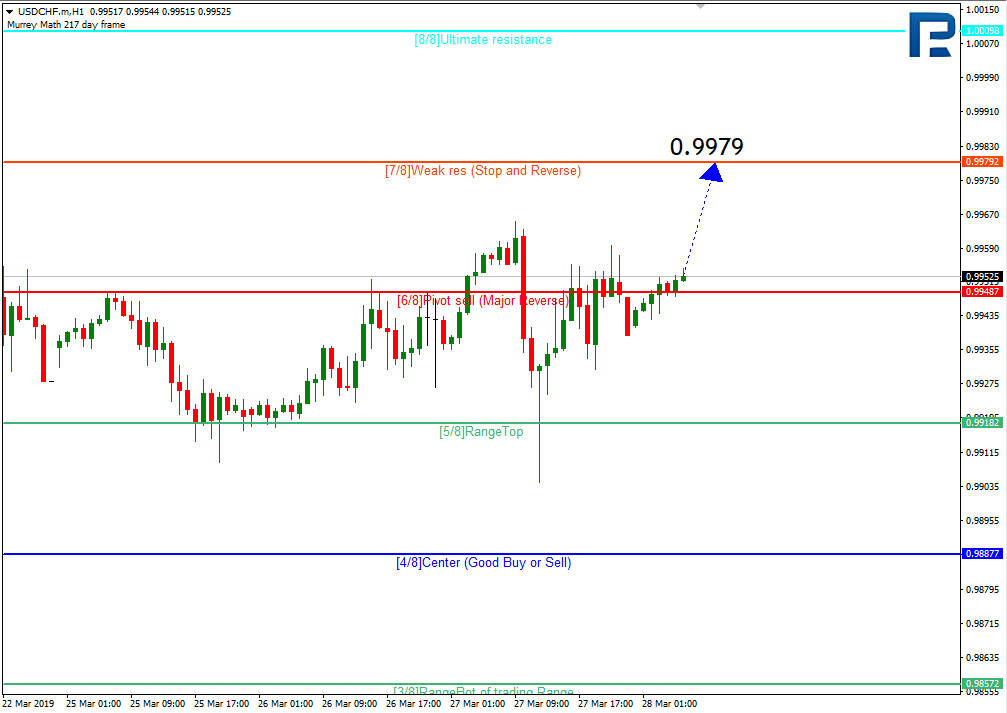
The pair is being pushed upwards; it may hit 0.9956 soon and continue the trend, with a local target at 1.0000. Then, after a breakout, it may hit 1.0066, which is going to be the first target.
USDJPY
The USDJPY is trying to break out 110.54 bottom up, probably to reach then 111.04, but this can be considered just as alternative, with the major scenario being a fall to 109.50, which can occur at any moment.
AUDUSD
The Aussie is heading down, in search of 0.7054; once a breakout occurs, it may hit 0.6963, i.e. a local target. Then, it is likely to rise to 0.7054, and then go down again to 0.6925.
USDRUB
The RUB formed a consolidation range below 64.90 and then broke it out top down. The correction may probably reach 65.37. However, any rise may only be considered as an alternative, while the major scenario is a fall to 62.77, i.e. a local target.
GOLD
Gold is under pressure and is going down, having already reached the target at 1,291.80. The price is currently consolidating near this level, which may either end with the price going up to 1,310, or continuing the trend by falling to 1,253.86, which is going to be the first target.
BRENT
Brent crude was unable to break out 66.15, and bounced. The price is now rising without any correction. Today we are expecting the Brent to rise to 68.06, and then, once a breakout occurs, to hit 70.30. Any rising patterns may only be considered as an alternative, however, as the price may abruptly correct to 63.65 at any moment.
Attention! Forecasts presented in this section only reflect the author’s private opinion and should not be considered as guidance for trading. RoboForex LP bears no responsibility for trading results based on trading recommendations described in these analytical reviews.
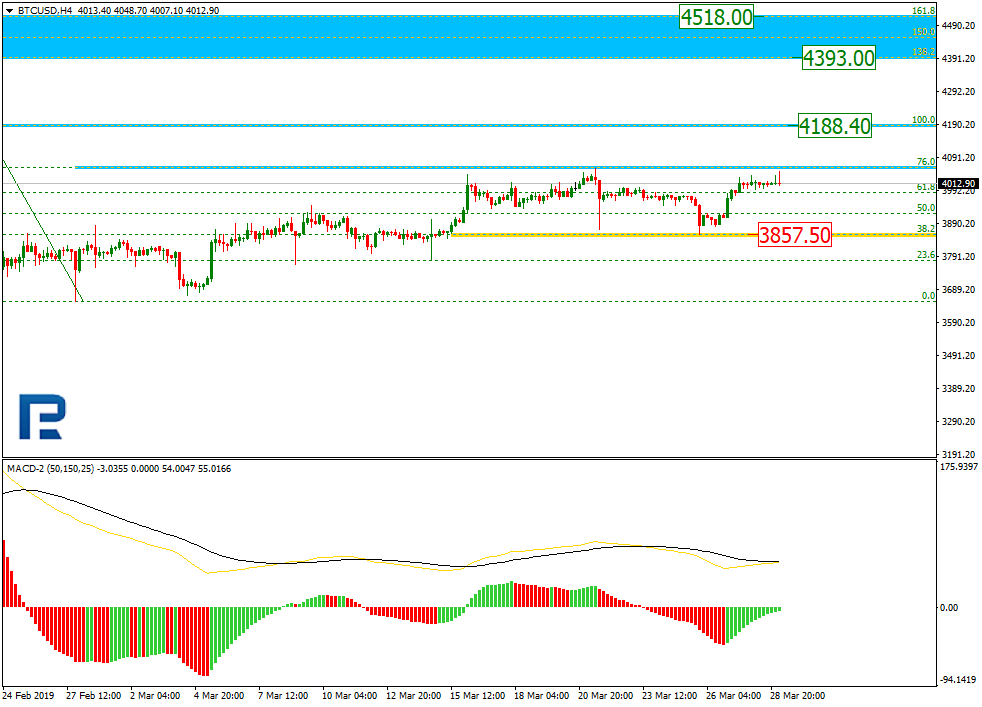
On H4, the BTC stopped correcting and started testing 76% Fibo again. If the rally continues, the crypto may reach not only the high at $4,188.40, but also the range between 138.20%-$161.80 ($4,393 to $4,518). The support is meanwhile at 38.20% ($3,857.50).
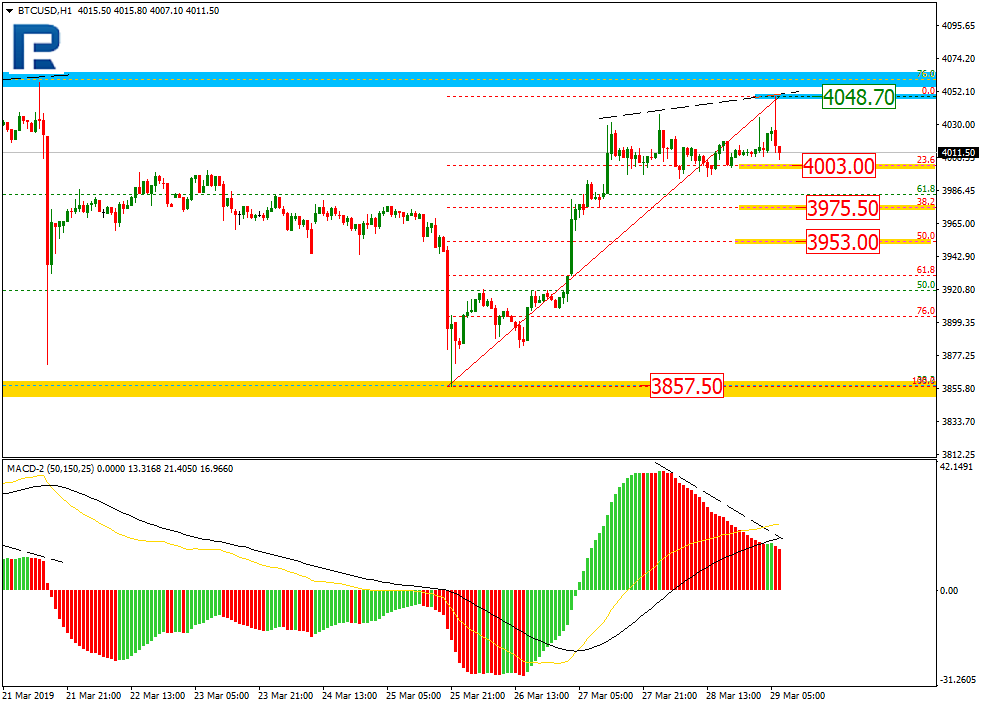
On H1, the BTC is falling after the divergence, with the descending trend targeting 23.60% ($4,003), 38.20% ($3,975.50), and 50% ($3,953). The resistance is at $4,048.70.
Ethereum
On H4, the Ether is still correcting upwards. This correction trend has tested 38.20% for the third time and may head further to 50% ($144.30), 61.80% ($149.40), and 76% ($155.60). The support is meanwhile at $122.57.
On H1, the Ether is downtrending, falling towards 38.2% (136.16) and 50.0% (135.12) Fibo. Meanwhile, the local resistance is at 139.62.
Attention! Forecasts presented in this section only reflect the author’s private opinion and should not be considered as guidance for trading. RoboForex LP bears no responsibility for trading results based on trading recommendations described in these analytical reviews.
Sterling will rally and the economy will have a growth spurt should UK Prime Minister Theresa May’s Brexit deal pass Friday – but this could be reversed if Boris Johnson becomes PM.
This is the warning from Nigel Green, founder and CEO of deVere Group, one of the world’s largest independent financial advisory organizations, on the day the UK was originally meant to have officially left the EU.
His comments come ahead of UK politicians voting on Friday on the withdrawal agreement – the legally binding document that sets out the terms of the UK’s departure from the EU. In a bid to end the impasse, the government has split the original deal into two parts: the withdrawal agreement and the political declaration.
Nigel Green notes: “MPs will vote today on whether to accept the Prime Minister’s version of Brexit, face crashing out without a deal on 12 April, a much longer extension, or a general election. No-one – really no-one – wants this uncertainty to continue.
“Since she vowed to quit, if has she gathered some more support in parliament, there is seemingly a gradual shift towards Mrs May’s plan as it will allow the UK to leave in, supposedly, a more orderly manner.”
He continues: “Should the PM’s deal pass on Friday, sterling will rally and the economy will have a growth spurt as pent-up household spending and investment kicks in.
“Domestic-focused small and mid-cap stocks would outperform large caps in a stock market rally.”
He goes on to say: “However, the economic future of the UK now really depends on Theresa May’s successor.
“Boris Johnson, who is now also widely expected to be backed by arch Brexiteer Jacob Rees-Mogg amongst others in the leadership contest, is seen as the likely winner. He would push for a much harder Brexit. This can be expected to create more uncertainty, spook markets, and negatively impact sterling and UK financial assets.”
The deVere CEO concludes: “Whatever happens in the UK parliament with today’s vote, or on Monday’s, many question marks remain. We don’t know who the successor, the one who will shape the UK’s future relationship with the EU and global trading partners, will be, and what their approach will look like.
“This is why to mitigate risks and to take advantage of the potential opportunities the volatility is creating, investors must ensure their portfolios are properly diversified.”
About:
deVere Group is one of the world’s largest independent advisors of specialist global financial solutions to international, local mass affluent, and high-net-worth clients. It has a network of more than 70 offices across the world, over 80,000 clients and $12bn under advisement.
EUR/USD keeps the bearish mood. EUR is under pressure after Mario Draghi’s statements that the key ineterest rates` growth can be postponed further. Right now the key support and resistance levels are 1.12350 and 1.12750. Today the investors will be evaluaing the important economic releases in the US. Open the positions from the key levels.
The Economic News Feed for 28.03.2019:
– GDP report (US) – 14:30 (GMT+2:00);
– Unfinished Real Estate Sales Index (EU) – 16:00 (GMT+2:00);
The price is below 50 MA and 200 MA which points to the power of the sellers.
The MACD histogram is in the negative zone but above the signal line which gives a weak signal to sell EUR/USD.
The Stochastic Oscillator is in the neutral zone, the %K line is below the %D line which points to the bearish mood.
Trading recommendations
Support levels: 1.12350, 1.12000
Resistance levels: 1.12750, 1.13000, 1.13250
If the price fixes below 1.12350, expect the quotes to fall toward 1.12000.
Alternatively, the quotes can recover toward 1.13000-1.13250.
The GBP/USD currency pair
Technical indicators of the currency pair:
Prev Open: 1.32053
Open: 1.31560
% chg. over the last day: -0.43
Day’s range: 1.31254 – 1.31985
52 wk range: 1.2438 – 1.4378
GBP/USD started to descend. The trading instrument updated the local minimums. An ambigous situation around Brexit keeps pushing GBP down. Yesterday the British Parliament rejected all 8 Brexit project. The key support and resistance levels are 1.31400 and 1.32000. The GBP/?USD quotes have a tendency to descend. You should open positions from the key levels.
The UK Economic News Feed for 28.03.2019 is calm. Keep an eye on the US news feed.
The indicators point to the power of the sellers, the price fixed below 50 MA and 200 MA.
The MACD histogram is in the negative zone and below the signal line which gives a signal to sell GBP/USD.
The Stochastic Oscillator is in the neutral zone, the %K line is below the %D line which also points to the bearish mood.
Trading recommendations
Support levels: 1.31400, 1.31000, 1.30300
Resistance levels: 1.32000, 1.32500, 1.33000
If the price fixes below 1.31400, expect the qutoes to fall toward 1.31000.
Alternatively, the qutoes can grow toward 1.32300-1.32600.
This article reflects a personal opinion and should not be interpreted as an investment advice, and/or offer, and/or a persistent request for carrying out financial transactions, and/or a guarantee, and/or a forecast of future events.
USD/CAD keeps its ambiguous technical picture. The quotes are in a flat, currently testing 1.34000 and 1.34400 levels. The financial market participants are waiting for important reports from the US. Keep an eye on the oil quotes dynamics. You should open positions from the key levels.
The Economic News Feed for 28.03.2019 is calm.
The indicators point to the power of the buyers, the price fixed above 50 MA and 200 MA.
The MACD histogram is in the positive zone and keeps rising, which points to the growth of USD/CAD.
The Stochastic Oscillator is in the neutral zone, the %K line is above the %D line which points to the bullish mood.
Trading recommendations
Support levels: 1.34000, 1.33750, 1.33500
Resistance levels: 1.34400, 1.35000
If the price fixes above 1.34400, expect the quotes to grow toward 1.35000.
Alternatively, the quotes can descend toward 1.33750-1.33500.
The USD/JPY currency pair
Technical indicators of the currency pair:
Prev Open: 110.591
Open: 110.457
% chg. over the last day: -0.13
Day’s range: 110.018 – 110.531
52 wk range: 104.56 – 114.56
USD/JPY shows an ambigous technical picture. The trading instrument is moving in a flat, the supply and demand zones are 110.000-109.800 and 110.500-110.700. The investors are waiting for additional drivers. Keep an eye on the economic releases and the US Treasury Bonds` yield. Open the positions from the key levels.
The Economic News Feed for 28.03.2019 is calm.
The indicators do not provide precise signals, the price is testing 50 MA.
The MACD histogram is in the negative zone but above the signal line which gives a weak signal to sell USD/JPY.
The Stochastic Oscillator is in the neutral zone, the %K line is above the %D line which points to the bullish mood.
Trading recommendations
Support levels: 110.000, 109.800, 109.500
Resistance levels: 110.500, 110.700, 111.150
If the price fixes below the round 110.000, expect the quotes to fall toward 109.600-109.400.
Alternatively, the quotes can grow toward 110.800-111.000.
The US dollar strengthened against a basket of major currencies despite weak economic data. Thus, GDP growth (q/q) counted to 2.2% in the 4th quarter of 2018, while experts expected 2.4%. Pending home sales index fell by 1.0%, although investors expected growth by 0.1%. Meanwhile, the number of initial jobless claims dropped to 211K instead of 220K. The dollar index (#DX) updated weekly highs and closed the trading session in the positive zone (+0.50%). The US dollar was supported by the recovery in the US government bonds yield, as well as the “soft” rhetoric of the Central Banks.
The British pound is still under pressure due to the uncertainty concerning Brexit. The British Parliament has not approved any of the bills, alternative to the draft agreement on Brexit, offered by Theresa May. The Prime Minister still hopes that parliamentarians will vote for her option for Brexit, and even has promised to resign if this agreement is approved. Today, Brexit debate will be held in the House of Commons.
The black gold” prices have been growing again. At the moment, futures for the WTI crude oil are testing the mark of $59.65 per barrel.
Market Indicators
Yesterday, the bullish sentiment was observed in the US stock market: #SPY (+0.38%), #DIA (+0.38%), #QQQ (+0.23%).
The 10-year US government bonds yield is recovering. At the moment, the indicator is at the level of 2.40-2.41%.
The news feed on 29.03.2019:
– German unemployment change at 10:55 (GMT+2:00); – UK GDP data at 11:30 (GMT+2:00); – Consumer price index in the Eurozone at 12:00 (GMT+2:00); – Canada GDP at 14:30 (GMT+2:00); – New home sales in the US at 16:00 (GMT+2:00).
Also according to preliminary data, Brexit debate should be held in the British Parliament.
On Thursday the 28th of March, the single currency once again hit a new low against the US dollar. The EURUSD pair reached a new low of 1.1214. During the US session, the pair rose to 1.1236 before entering a sideways trend, where it currently remains.
The major currencies have declined on the back of the US dollar index’s rise to 97.30. The greenback’s rise was brought about by a retreat from risky assets as well as a rise in US bond yields from 2.35% to 2.41%.
12:30 UK: current account (Q4), GDP (Q4), total business investment (Q4), net lending to individuals (Feb), mortgage approvals (Feb).
15:30 Canada: GDP (Jan), industrial product price (Feb).
15:30 US: personal spending (Jan), personal income (Jan).
16:45 US: Chicago PMI (Mar).
17:00 US: new home sales (Feb), Michigan consumer sentiment index (Mar).
20:00 US: Baker Hughes US oil rig count.
Current situation:
I’ve left yesterday’s markings on the chart. The bears went on the attack as trading opened in Europe, triggering the stop levels below 1.1240. The bulls bought up the euro from 1.1234. From 1.1259, the drop recommenced with renewed strength. Now we’re in the same situation, with the pair consolidating at 1.1229. Before moving downwards, the pair could head back to 1.1339 to trigger some stop levels before dropping to 1.1214. The bearish trend is getting weaker. Shorting is becoming riskier.
Today’s central focus for traders will be the votes in the British parliament. The UK was supposed to leave the EU on the 29th of March, but an agreement still has yet to be reached.
US officials were in Beijing for another round of trade talks. These talks will be picked up again in Washington next week. China looks ready to compromise, so keep an eye on the headlines. Progress in these talks means an increased appetite for risk and a stronger euro. If we look at technical analysis, the bears are preventing the euro from undergoing a proper correction as they’ve got their eyes on 1.1205. I reckon that they will start to take profit on their short positions at around 1.1200.
Our research team, at Technical Traders Ltd., has been all over the precious metals markets for the past 16+ months. We’ve been so deep into research and study with regards to price action and technical/fundamental data, that we’ve been able to call market moves many months in advance.
Recently, over the past few months, we’ve been warning that an April 21~24 date is likely to set up an ultimate price bottom in the precious metals market. It could prompt a broader upside price swing that should eventually lead to a much bigger upside breakout move. On March 8, 2019, we posted this article that clearly outlined our thinking at that time saying a bounce to $1315-1320 before heading down to $1255.
Take a minute to read that article and consider this current downside price action as a gift the precious metals markets are allowing for all of us. This is the move that we’ve been warning about for months – the retracement from the $1315~1320 level that should bottom out near $1240~1265 and will ultimately become the “momentum base” for the future upside move. Precious metals are starting a move that we predicted many months ago. Our researchers believe Gold will trade below $1275 for a brief period of time (likely just a few days or weeks) before setting up a broad-based momentum bottom. Our objective is to “leg into” this setup with a series of long trades for the ultimate upside breakout.
Our research suggests that near the end of April 2019 or in early May 2019, Gold prices will likely begin a strong upside price move that will quickly target the $1500+ price level. We believe this current price swing will set up as the last real opportunity for skilled traders to accumulate long positions in precious metals while we wait for the April/May breakout move. Any opportunity to buy near the lower range of our Buy Zones would be an excellent entry position given our future prediction that a massive upside breakout move is just 20~30 days away from starting.
This Daily Gold chart shows just how deep the Buy Zone is for Gold. Any price activity below $1275 would be a solid entry for skilled traders. Any further opportunity to add to that position below $1265 is even better. Ultimately, we believe the $1240 to $1250 level will hold as support for the momentum bottom.
This Weekly Gold chart highlights our Buy Zone in broader price perspective. As you can see, the $1250 level corresponds to a price peak back in October/November 2018. We believe this level will act as long-term support and that price will bottom between $1240 and $1265 before the upside price swing begins.
This last Weekly Silver chart highlights the fairly narrow Buy Zone in silver that will allow traders to accumulate long position near of just above $16.50. We believe this $16.50 level will become key support throughout this April 2019 lower price rotation. Remember, near the end of April or in early May, we strongly believe a new upside price move will take place that will blow through recent highs and prompt a 12 to 25% upside price move. Our target for Gold is above $1500 (likely $1575 to $1675). Our upside target for Silver is $17.50 to $19.50 with this first upside leg. Our opinion is that this initial upside leg could be the start of a much larger and much more profitable price advance – lasting many months.
On H4, USD/JPY is expected to test 3/8, after which a pullback and a fall to the support at 0/8 may occur.
On H1, the price is above the consolidation range, and is likely to hit 7/8.
Gold
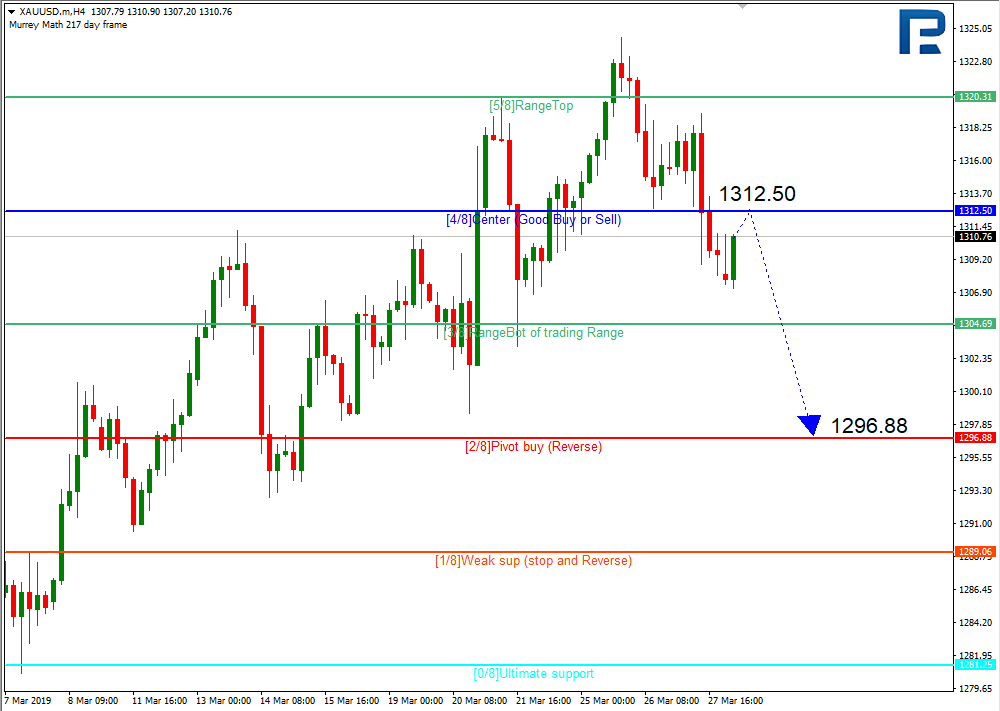
On H4, the price is declining within a consolidation range between 3/8 and 5/8. The 4/8 is going to get tested, after which the price is likely to bounce and fall to the support at 2/8.
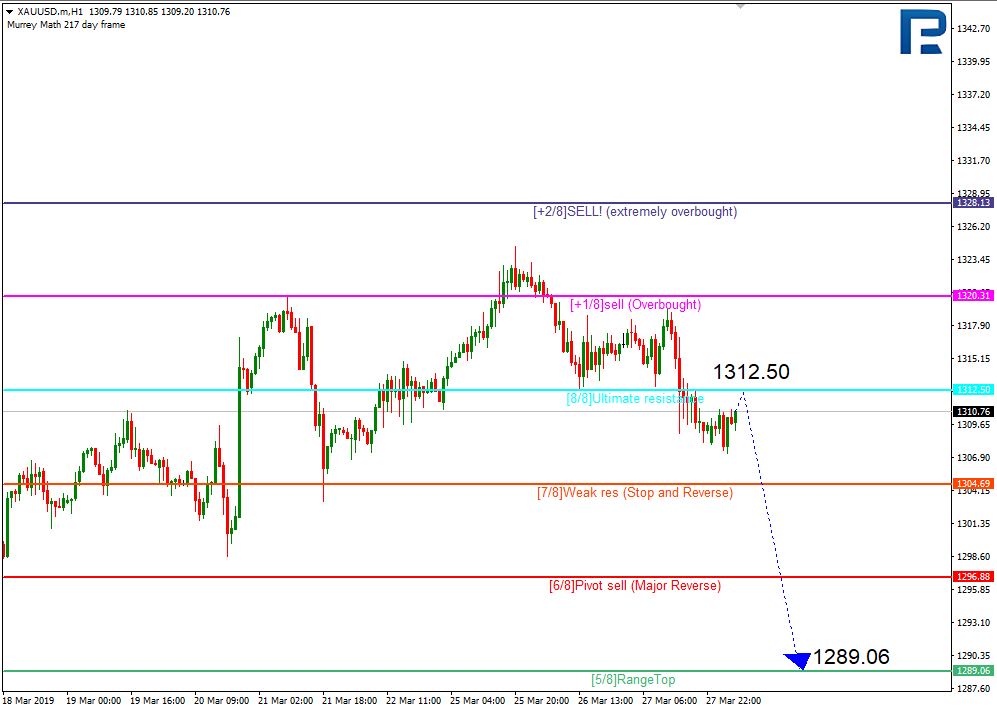
On H1, the price has left the overbought territory and now is likely to reach the 5/8 support.
On M15, the lower VoltyChannel line has been broken out, which means a descending trend is prevailing.
Attention! Forecasts presented in this section only reflect the author’s private opinion and should not be considered as guidance for trading. RoboForex LP bears no responsibility for trading results based on trading recommendations described in these analytical reviews.
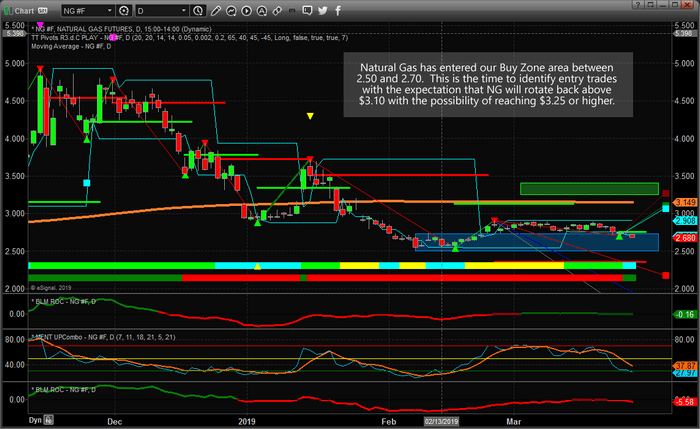
Recently, we warned that Natural Gas may set up another opportunity for traders to buy into a support zone below $2.70 with a selling range near or above $3.00. Our upside target zone is between $3.25 and $3.45. The price of Natural Gas has recently fallen below $2.69 and we believe this could be the start of a setup for skilled traders to identify key buying opportunity in preparation for a quick +8% to +15% upside swing.
Historically, March and April have been pretty solid months for Natural Gas. Let’s go over the historical data using three different seasonality charts which all point to higher prices.
Taking a look at the data, above for both March and April it appears we should have a positive price outcome over the next 20+ trading sessions. Thus, we can determine that the likelihood of a positive price swing between now and the end of April is highly likely.
When we take a look at the chart data to see how our BUY and SELL zones are setting up, it becomes clear that any opportunity to BUY into the lower support channel, with a moderate degree of risk, could result in a very nice profit potential of between $0.35 to $0.70 on data that supports the Bullish potential as a 200%~220% advantage over downside potential.
Take a look at the data that we are presenting and try to understand that these types of historical price triggers are not foolproof, yet they do provide a clear advantage. They allow us to see if and when there is any type of advantage to our decision making and if we can identify any real opportunity for future success. We believe any further downside price activity in Natural Gas will result in additional opportunities for Long trades with $2.45 being our absolute low entry target. Our upside exit target would be any level above $2.95, or higher, and our ultimate target objective would be $3.15 or higher. Our last trade in natural gas (UGAZ) gave us 30% return in just two weeks in February!
This could be another opportunity for a trader to target a quick 8% to 15% swing trade in Natural Gas over the next 20+ days. Time to put Natural Gas on your radar again!
Are you ready for this next move? Want to know how we can help you find and execute better trades? Visit TheTechnicalTraders.com to get our, technical indicators, market analysis, daily videos and trade alerts.
The AUDUSD is trading at 0.7090, below the Ichimoku cloud, which means there’s a downtrend forming. We are expecting a test of the lower cloud boundary at 0.7105, and then a downward pullback to 0.7020, which may be confirmed with the price bouncing off the resistance area. This fall may be prevented in case the price breaks out the upper boundary and closes above 0.7115, which will be a signal for a further rise to 0.7205 and above. Conversely, the fall will be confirmed once the bottom boundary of the triangle pattern gets broken out and the price closes below 0.7055.
NZDUSD
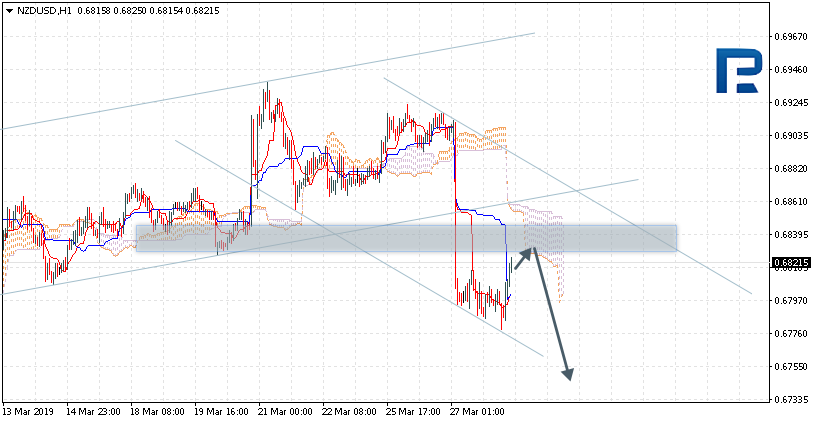
The NZDUSD is trading at 0.6821, below the Ichimoku cloud, which means there’s a downtrend forming. We are expecting a test of the lower cloud boundary at 0.6830, and then a downward pullback to 0.6745, which may be confirmed with the price bouncing off the resistance area. This fall may be prevented in case price breaks out the upper boundary and closes above 0.6865, which will be a signal for a further rise to 0.6985.
USDCAD
The USDCAD is trading at 1.3406, above the Ichimoku cloud, which means there’s an uptrend forming. We are expecting a test of the upper cloud boundary at 1.3375, and then a downward pullback to 1.3535, which will be confirmed with the price bouncing off the lower boundary of the ascending channel. This rise may be prevented in case price breaks out the lower boundary and closes below 1.3320, which will be a signal for a further fall to 1.3215.
Attention! Forecasts presented in this section only reflect the author’s private opinion and should not be considered as guidance for trading. RoboForex LP bears no responsibility for trading results based on trading recommendations described in these analytical reviews.