Demand for risky assets has resumed again amid the prospects for a truce between the US and China. According to the Financial Times, Washington and Beijing are very close to reaching the final trade deal. The US continues to publish weak economic releases, which put additional pressure on the greenback. Thus, the ADP nonfarm employment change increased by 129K in March instead of 184K. The ISM non-manufacturing PMI dropped to 56.1 in March, while investors expected 58.1. The dollar index (#DX) updated local lows and closed in the negative zone (-0.23%).
The British pound has become stable after a significant rally the day before. Investors continue to assess the situation concerning Brexit. British Prime Minister Theresa May intends to meet with opposition leader Jeremy Corbyn to try to find a way out of the Brexit situation. The opposition Labour Party wants the kingdom to remain in the customs union with the EU. The pound is under pressure due to weak economic data. Thus, UK services PMI fell to 48.9 in March, while experts forecasted 51.0.
The “black gold” prices are testing annual highs. At the moment, futures for the WTI crude oil are consolidating near $62.30 per barrel.
Market Indicators
Yesterday, the bullish sentiment was observed in the US stock market: #SPY (+0.16%), #DIA (+0.12%), #QQQ (+0.57%).
The 10-year US government bonds yield is at the level of 2.50-2.51%.
The news feed on 04.04.2019:
– ECB monetary policy meeting account at 14:30 (GMT+3:00); – Initial jobless claims in the US at 14:30 (GMT+3:00); – Canada Ivey PMI at 17:00 (GMT+3:00).
On Wednesday the 3rd of April, trading on the euro closed up. The bulls pushed the pair up to 1.1255, but were unable to stay above the 1.1250 resistance. In the US session, the bulls retreated to 1.1225. Their second attempt at breaking 1.1250 also fell short, and trading on the pair stabilised at 1.1240. On the hourly timeframe, the conditions look ripe for an upwards impulse.
The bulls are drawing their strength from expectations that the US and China will conclude a trade deal, and that the Brexit deadlock will be broken. A bill to prevent a no-deal Brexit was passed by the House of Commons at the third reading. Now the government needs to discuss alternative options with other party leaders and reach an agreement on how to proceed.
A symmetrical triangle has formed around 1.1240 over the last few hours. The triangle is a trend continuation pattern, but could appear an order lower in the wave structure. If we suppose this is an a-b-c correction, then the triangle is wave b.
Trading robots have changed the market situation, so we often see false movements and breakouts when constructing pricing models. Big market players need classical technical analysis to know where the crowd will place their stop levels, and then they make use of newsfeeds and investment ideas to get their background information and push prices in their direction.
A good example is the bitcoin rally from the 2nd of April. The price rose by nearly 1,000 USD (+20%) on the back of stop levels being triggered on short positions. The big players entered the market on the rebound. Some people managed to do some scalping during this movement, but they quickly closed their positions as the spread reached 25 USD at one point.
Given the current situation, I’m still expecting a rise to 1.1263 (67 degrees). If the pair doesn’t drop any lower, we can expect the pair to go as high as 1.1273.
Our research continues to support a Bullish price bias over the next 30+ days, very likely reaching to new all-time highs again, before June/July 2019. For many months, other researchers have continued to predict “doom and gloom” with warnings of Treasury yield inversions, global collapse events, and other crisis events. Yes, we believe continued price rotation will drive future price swings and they could be volatile moves – yet we believe any crisis event will actually become an incredible opportunity for long traders to BUY into the markets at extreme lows.
Recently, our researchers focused on OIL and the Transportation Index as key elements suggesting this upside move is far from over. Oil has moved from below $55 ppb to well above $60 ppb. We believe this move will continue higher to target the $64 ppb level were resistance is likely to be found. We do believe that some price rotation in Oil is likely to happen in the Summer months – when travel increases and Summer blend gas hits the markets. Winter has been uniquely difficult this year and the rise in Oil prices, where OPEC and foreign market events have attempted to push prices above $50 ppb, is warranted given global economic activities.
While Oil continues to climb, the Transportation Index is also rallying above recent resistance near $10,500 and pushing higher targeting the $11,250 level. This is important because the Transportation Index typically leads the US economy by about 3~6 months and is a key indicator of investors future expectations for the US and global economy. Any push above $11,000 in the Transportation Index would likely mean we are going to attempt to reach all-time highs near $11,634. A move like this would likely push the US Stock Market Indexes well above recent all-time highs as well.
Much of our recent analysis has been an attempt to relate the opportunity that exists over the next 30~60 days in the US Stock Market. For well over 12 months, we’ve been suggesting a capital shift is taking place where the US stock market, and the US Dollar, are uniquely positioned to become safe-haven investments for foreign investors. We believe this process is still taking place and we believe the US market could continue to push up to new all-time highs before another rotational move sets up. Our most recent research suggests a peak may form near June/July 2019 that should concern traders. Until then, we believe the upside price bias will continue and we still believe new all-time highs are about to be reached.
As of today, we have technical confirmation that a renewed upside price move is taking place and we continue to watch the precious metals for any signs of a base/momentum bottom. Follow our research and learn how we can help you find and execute better trades.
Take a minute to find out why Technical Traders Ltd. is quickly becoming one of the best research and trading services you can find anywhere. We are about to launch a new technology product to assist our members and we continue to deliver incredible research posts, like this one, where we can highlight our proprietary price modeling systems and adaptive learning solutions. If you want to stay ahead of these markets moves and find greater success in 2019 and beyond, then please take a minute to see how we can help you. Once this June/July peak begins, you won’t want to miss the next big move… Join TheTechnicalTraders.com today.
EURUSD has reached another downside target at 1.1185; right now, it is being corrected. Today, the pair may fall to reach 1.1202 and then continue the correction towards 1.1231. Later, the market may continue trading inside the downtrend with the short-term target at 1.1165.
GBPUSD, “Great Britain Pound vs US Dollar”
GBPUSD is consolidating; it has formed another ascending structure to reach the upside border. Possibly, today the pair may form a new descending structure to break 1.3081 and then continue trading downwards, thus forming the Flag correctional pattern. According to the main scenario, the price is expected to continue trading inside the downtrend with the first target at 1.2950.
USDCHF, “US Dollar vs Swiss Franc”
USDCHF is still forming the third ascending wave with the target at 1.0008; by now, it has returned to 0.9973. Possibly, the pair may form a new descending structure to reach 0.9965. According to the main scenario, the price is expected to continue growing to reach 1.0008, at least.
USDJPY, “US Dollar vs Japanese Yen”
USDJPY is trading upwards; it is trying to break the upside border of the range. Possibly, the pair may break 111.49 and then continue growing to reach 111.69. After that, the instrument may start a new correction with the target at 110.72 and then form one more ascending structure towards 112.00.
AUDUSD, “Australian Dollar vs US Dollar”
AUDUSD has rebounded from 0.7030 and returned to the center of the range. According to the main scenario, the price is expected to continue trading inside the downtrend with the target at 0.7030. An alternative scenario implies that the pair may break 0.7133 and then continue trading upwards to reach 0.7165. Later, the market may start a new decline towards 0.6993.
USDRUB, “US Dollar vs Russian Ruble”
USDRUB is consolidating above 65.19. Possibly, the pair may break this level and form a reversal pattern for a new downtrend with the first target at 64.60. In fact, the price is expected to start the fifth wave to the downside towards 62.77.
XAUUSD, “Gold vs US Dollar”
Gold is still consolidating around 1292.00. According to the main scenario, the price is expected to break the range to the downside and continue forming the third wave with the target at 1260.00. If the pair breaks 1300.00, the market may choose an alternative scenario and start another correction towards 1312.31. Later, the market may resume trading downwards with the short-term target at 1260.00.
BRENT
Brent is still trading upwards. Today, the pair may reach 70.88 and then start another correction towards 68.60. After that, the instrument may be form one more ascending structure with the target at 73.03.
Attention! Forecasts presented in this section only reflect the author’s private opinion and should not be considered as guidance for trading. RoboForex LP bears no responsibility for trading results based on trading recommendations described in these analytical reviews.
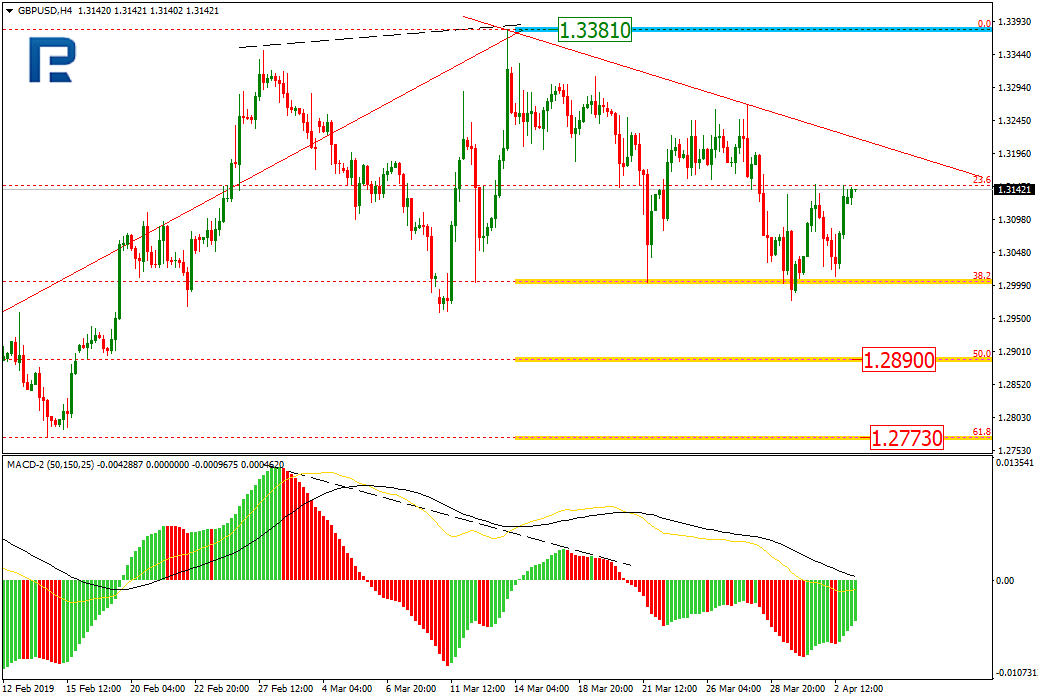
As we can see in the H4 chart, after reaching the retracement of 38.2%, GBPUSD is forming another ascending impulse to reach the resistance line. The key upside target is the high at 1.3381. if the price rebound from the line, the instrument may resume falling towards the retracements of 50.0% and 61.8% at 1.2890 and 1.2773.
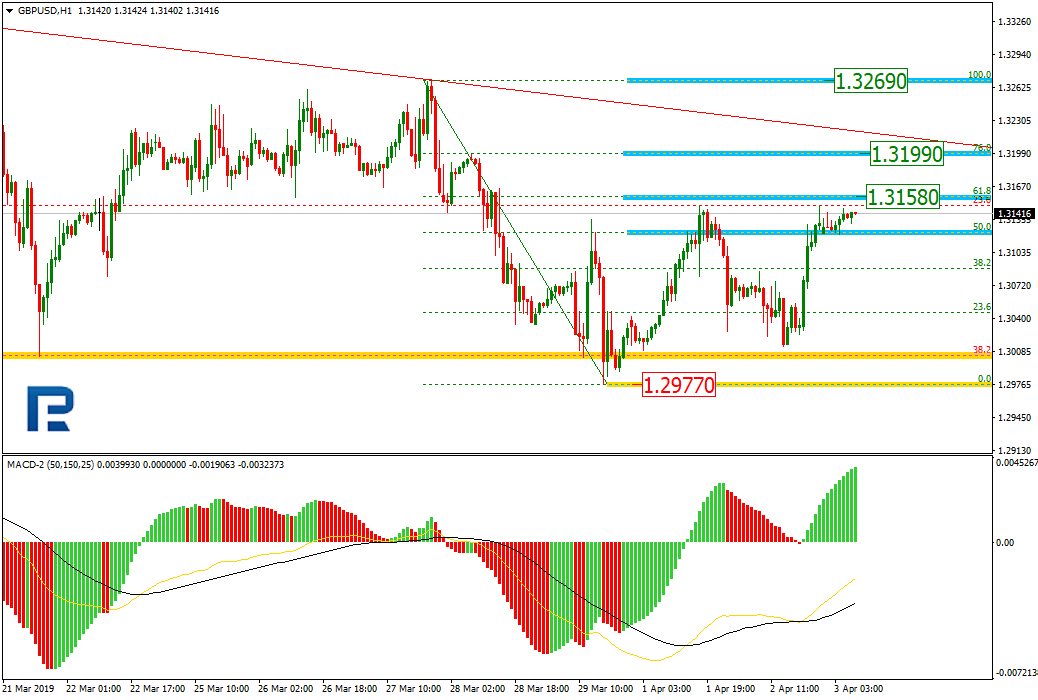
In the H1 chart, the pair has formed the second short-term correctional wave, which is heading towards the retracements of 61.8% and 76.0% at 1.3168 and 1.3199 respectively. The next possible target is the high at 1.3269. The support level is the low at 1.2977.
EURJPY, “Euro vs. Japanese Yen”
As we can see in the H4 chart, there was a convergence on MACD and after reaching the retracement of 38.2%, EURJPY started a new pullback, which may transform into a new growth. The upside targets are the retracements of 50.0%, 61.8%, and 76.0% at 125.57, 126.03, and 126.58 respectively. If the price breaks the low at 123.65, the instrument may resume falling towards the retracements of 50.0% at 122.74.
In the H1 chart, the pair has reached the retracement of 38.2%. At the same time, there is a divergence on MACD, which may indicate a new pullback soon.
Attention! Forecasts presented in this section only reflect the author’s private opinion and should not be considered as guidance for trading. RoboForex LP bears no responsibility for trading results based on trading recommendations described in these analytical reviews.
EUR partially recovered against the USD. Right now the quotes are testing the local supply zone at 1.12250-1.12450. The key support is at 1.11850. The financial market participants are watching the US/China trading negotiations. According to the Financial Times, both sides have settled their differences and are going to sign the deal soon. Keep an eye on this issue, as well as the today’s economic releases that can offer insight in the future of major currencies. Open the positions from the key levels.
The Economic News Feed for 03.04.2019:
– Business activity indicators (EU) – 11:00 (GMT+3:00);
– ADP’s Preliminary Labour Market Report (US) – 15:15 (GMT+3:00);
– Non-industrial PMI by ISM (US) – 17:00 (GMT+3:00);
The indicators do not provide precise data, the price fixed between 50 MA and 200 MA.
The MACD histogram moved to the positive zone, which points to the bullish mood.
The Stochastic Oscillator is in the neutral zone, the %K line is below the %D line which gives a signal to sell EUR/USD.
Trading recommendations
Support levels: 1.11850, 1.11500
Resistance levels: 1.12250, 1.12450, 1.12800
If the price fixes above 1.12250, expect the qutoes to correct further toward 1.12700-1.13000.
Alternatively, the quotes can descend toward 1.11600-1.11400.
The GBP/USD currency pair
Technical indicators of the currency pair:
Prev Open: 1.30925
Open: 1.31302
% chg. over the last day: +0.20
Day’s range: 1.31215 – 1.31931
52 wk range: 1.2438 – 1.4378
GBP/USD started to grow and updated the local maximums. The worries about the “hard Brexit” were debunked by Theresa May’s statement that she will request another delay for Brexit. Right now the quotes are close to 1.32000 with 1.31500 acting as a mirror support. GBP can recover further. You should open positions from the key levels.
At 11:30 (GMT+3:00) the UK will release a service industry PMI.
The price fixed above 50 MA and 200 MA which points to the power of the buyers.
The MACD histogram is in the positive zone and above the signal line which points to the bullish mood.
The Stochastic Oscillator is inear the overbought zone, the %K line is above the %D line which also gives a weak signal to buy GBP/USD.
Trading recommendations
Support levels: 1.31500, 1.31200, 1.30800
Resistance levels: 1.32000, 1.32400, 1.32650
If the price fixes above the round 1.32000, expect the qutoes to grow toward 1.32400-1.32650.
Alternatively, the qutoes can fall toward 1.31200-1.31000.
This article reflects a personal opinion and should not be interpreted as an investment advice, and/or offer, and/or a persistent request for carrying out financial transactions, and/or a guarantee, and/or a forecast of future events.
USD/CAD started to descend again. Right now the trading instrument is testing 1.33000. The key resistance is as 1.33400. The pressure on the USD is caused by the weak economic releases. The bullish mood on the oil market keeps up the demand for CAD. The currency pair can descend further, so keep an eye on the US news feed and open the positions from the key levels.
The Economic News Feed for 03.04.2019 is calm.
The price fixed below 50 MA and 200 MA which points to the power of the buyers.
The MACD histogram is in the negative zone and below the signal line which gives a strong signal to sell USD/CAD.
The Stochastic Oscillator is in the oversold zone, the %K line is crossing the %D line. There are no signals at the moment.
Trading recommendations
Support levels: 1.33000, 1.32650
Resistance levels: 1.33400, 1.33750, 1.34000
If the price fixes below the round 1.33000, expect the quotes to fall further toward 1.32700-1.32500.
Alternatively, the quotes can grow toward 1.33700-1.33900.
The USD/JPY currency pair
Technical indicators of the currency pair:
Prev Open: 111.344
Open: 111.314
% chg. over the last day: -0.03
Day’s range: 111.209 – 111.579
52 wk range: 104.56 – 114.56
USD/JPY keeps showing a positive trend. Right now the trading instrument is testing the local resistance at 111.550. 111.150 acts as a mirror support. USD/JPY has further growth prospects. Keep an eye on the relevant data regarding the US/China negotiations. Open the positions from the key levels.
The Economic News Feed for 03.04.2019 is calm.
The price fixed above 50 MA and 200 MA which points to the power of the buyers.
The MACD histogram is in the positive zone and above the signal line which gives a strong signal to buy USD/JPY.
The Stochastic Oscillator is in the neutral zone and above the signal line which also points to the bullish mood.
Trading recommendations
Support levels: 111.150, 110.850, 110.500
Resistance levels: 111.550, 112.000
If the price fixes above 111.550, expect the further growth toward 112.000.
Alternatively, the qutoes can fall toward 110.850-110.600.
The Euro Futures chart is highlighting recent support and our proprietary Fibonacci price modeling systems are suggesting that a current support zone may be setting up for a decent upside move to near 1.15. Momentum has stalled to the downside after the Brexit kerfuffle. It is our opinion that this move to near 1.125 will likely hold as support and prompt an upside price move towards the 1.15 price level.
Volatility within the ZE is normal and this type of price rotation appears to continue. An upside bottom/base near 1.125 may prompt a larger upside price swing in the Euro Futures because it relates a “higher low” price formation following Fibonacci Price Theory. This set would indicate that a “lower low” attempt has failed and would suggest that the Euro Futures price would now attempt a new Higher High (above 1.155).
Skilled traders should watch for any breakout above 1.134 as confirmation of the upside price rally and target 1.15 or higher. This could also drive the US Dollar a bit weaker over this same time-span. Might be an excellent setup for quick profits.
Do you want to find a team of dedicated researchers and traders that can help you find and execute more winning trades in 2019 and beyond visit our trade alert newsletter at TheTechnicalTraders.com or learn our trading techniques through our Trading Courses today?
The US dollar has been declining against a basket of world currencies. The dollar index (#DX) updated local lows and reached 96.60. The US continue to publish weak economic releases. Thus, core durable goods orders rose by only 0.1% in February, while experts expected growth by 0.3%. The dollar index (#DX) closed with a slight minus (+0.05%). Investors are focused on trade negotiations between the US and China. Today, a new round of talks between the Chinese delegation led by Vice Premier Liu He and the US regarding the trade agreement, which is in the final stage, will begin.
Yesterday, Theresa May said that she intended to ask the EU to extend Article 50. She still wishes to negotiate with the Labour leader to reconsider her Brexit agreement. The British Prime Minister wants the kingdom and the European Union to remain in close relationship after the country’s exit from the block.
Today, during the Asian trading session, optimistic data has been published in Australia. Thus, the volume of retail sales rose by 0.8% in February, while experts expected 0.3%. The trade balance increased to 4.801B in February instead of 3.710B. Financial market participants expect important economic statistics from the UK and the US.
The “black gold” prices are growing. At the moment, futures for the WTI crude oil are testing $62.80 per barrel. At 17:30 (GMT+3:00), a report on crude oil inventories will be published in the US.
Market Indicators
Yesterday, there was a variety of trends in the US stock market: #SPY (+0.05%), #DIA (-0.27%), #QQQ (+0.38%).
The 10-year US government bonds yield has continued to grow. Currently, the indicator is at the level of 2.50-2.51%.
The news feed on 03.04.2019:
– Services PMI in the UK at 11:30 (GMT+3:00); – ADP nonfarm employment change at 15:15 (GMT+3:00); – ISM non-manufacturing PMI at 17:00 (GMT+3:00).
On Tuesday the 2nd of April, the pound was the centre of attention among traders against the backdrop of Brexit news. While trading on our main pair closed slightly down, the euro recovered to 1.1229 in this morning’s Asian session.
Once again, the rise of the majors against the greenback was driven by British Prime Minister Theresa May’s statement that she is ready to seek an alternative approach to Brexit with the leader of the Labour Party, Jeremy Corbyn. She is looking to find a compromise on this issue that all parties can agree on.
Day’s news (GMT+3):
10:15 Spain: Markit services PMI (Mar).
10:45 Italy: Markit services PMI (Mar).
10:50 France: Markit services PMI (Mar).
10:55 Germany: Markit services PMI (Mar).
11:00 Eurozone: Markit services PMI (Mar).
11:30 UK: Markit services PMI (Mar).
12:00 Eurozone: retail sales (Feb).
15:15 US: ADP employment change (Mar).
16:45 US: Markit services PMI (Mar).
17:00 US: ISM non-manufacturing PMI (Mar).
17:30 US: EIA crude oil stocks change (29 Mar).
Current situation:
In today’s Asian session, the US dollar is trading down against all the majors except for the yen. The bulls broke through the trend lines on our main pair this morning. On the chart, I’ve got one that runs through the 1.1326 high from the 26th of March. The main trend line, drawn from 1.1448 (20th of March), runs through 1.1207. The trend line breakout signifies the end of the downwards movement. We can start talking about a full reversal when the pair breaks 1.1250.
At the time of making the chart, the pair was trading at 1.1216. The pair has returned to the balance line. The bulls now need to defend 1.1210. If this level is broken, there’s a risk of dropping to 1.1184. If the pair exits the channel (dashed line) upwards, then we can turn our attention towards the 1.1263 mark.
Be warned that Brexit is going to dominate the headlines until Friday. On Friday, US labour market data will be released.
The Bitcoin price has bottomed and the crypto-winter has come to an end, affirms the CEO of one of the world’s largest independent financial advisory organizations.
The comments from Nigel Green, founder and chief executive of deVere Group, comes as Bitcoin, the world’s largest cryptocurrency by market capitalisation, jumped 20 per cent in less than an hour Tuesday morning.
Mr Green says: “After being in bear territory there is a growing sense that Bitcoin is back. I’m now calling that the market has bottomed and the so-called crypto winter has come to an end.
“I believe Bitcoin will now move higher over the next few weeks and months, making steady gains for investors. As the largest cryptocurrency by market cap, this will have a positive impact on prices in the wider crypto sector.”
The Bitcoin price crossed the $5,000, touching the highest level since November 2018 in the early hours of Tuesday, London time. All other major cryptocurrencies, including Ethereum, XRP and Litecoin have experienced gains of around 10 per cent.”
He continues: “This dramatic jump is likely to attract many investors who have been sitting on the sidelines.
“In addition, it can be expected to reignite institutional interest.”
Late last year, the deVere CEO suggested that Bitcoin and other cryptocurrencies are, on the verge of a true global breakout, largely due to ‘FOMO’, the fear of missing out.
“Adoption is increasing all the time. This is evidenced not only in the financial sector, in which major banks are increasingly looking at blockchain and crypto, but with big names within the tech and retail sectors too,” he observed.
“I feel that there’s a growing sense amongst institutions that unless they embrace this sector, their competitors could move way out in front and they might find it difficult to catch up. This is especially true as the public – their customers – are increasingly eager to explore the opportunities themselves.”
Nigel Green concludes: “There is increasing acceptance that cryptocurrencies are inevitably the future of money, and the environment is now right for a sustained climb in prices.
“I think we could reasonably see the Bitcoin price hitting $7,000 in the next few months.”
About:
deVere Group is one of the world’s largest independent advisors of specialist global financial solutions to international, local mass affluent, and high-net-worth clients. It has a network of more than 70 offices across the world, over 80,000 clients and $12bn under advisement.