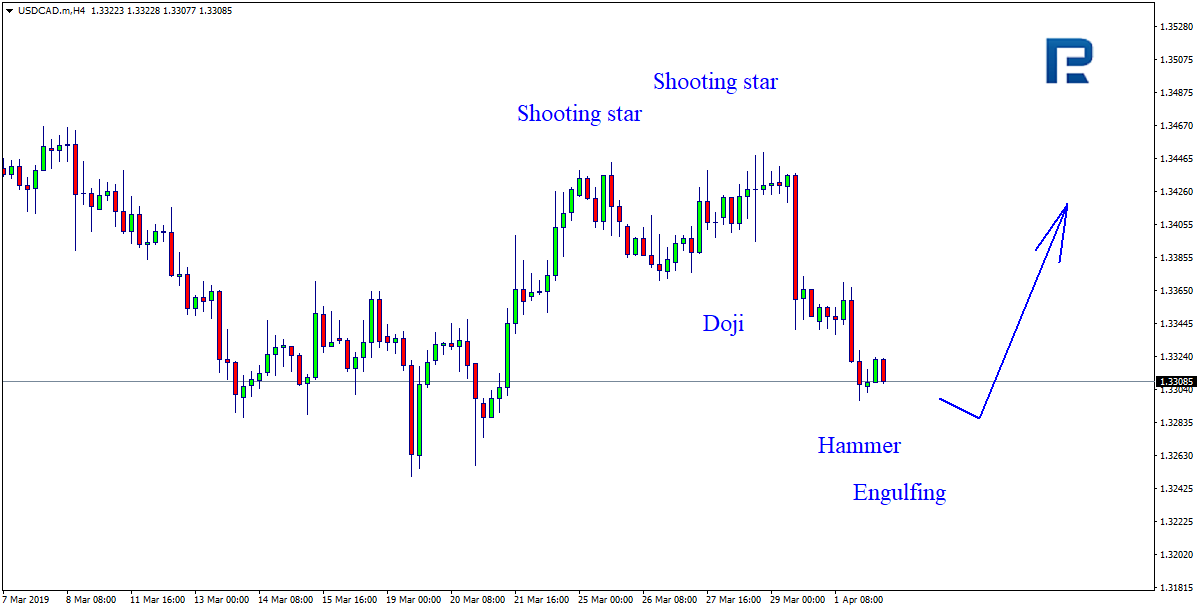
The second half of March was great for the Russian ruble. The main reasons for that were the strong uptrend on oil and the recent positive sentiment towards emerging markets. The new month hasn’t started off so well though. Instead of continuing the drop, USDRUB is aiming higher, possibly starting a new mid-term uptrend.
A few days ago, the technical situation was favoring the short side of the market. The price was under the super important resistance at 65 and the 38.2% Fibonacci. Sellers could have been optimistic thanks to the big double top formation that has been forming for the past few months. I have to tell you that it was all looking really sweet. April crashed the bearish dreams though. The pair didn’t manage to defend that line as the closest resistance and the area was broken. What’s more, the price created a wedge (blue lines) and the breakout of its upper line promotes a further rise. That is my current scenario for this instrument.
Positive sentiment will be denied if the pair breaks the orange line again, but this time from the top. As long as we stay above it, the buy signal is on and we should see a further upswing. The first target is at 23.6% Fibo and the chances that we will get there are quite high.
As we can see in the H4 chart, USDCAD is testing the support level and forming Hammer and Engulfing reversal patterns. Judging by the previous movements, it may be assumed that the instrument may finish the correction and then resume its ascending movement.
AUDUSD, “Australian Dollar vs US Dollar”
As we can see in the H4 chart, AUDUSD is still trading upwards; by now, it has completed another correction and formed Inverted Hammer and Harami reversal patterns. Judging by the previous movements, right now it may be assumed that after finishing the pullback the instrument may start a new growth.
Attention! Forecasts presented in this section only reflect the author’s private opinion and should not be considered as guidance for trading. RoboForex LP bears no responsibility for trading results based on trading recommendations described in these analytical reviews.
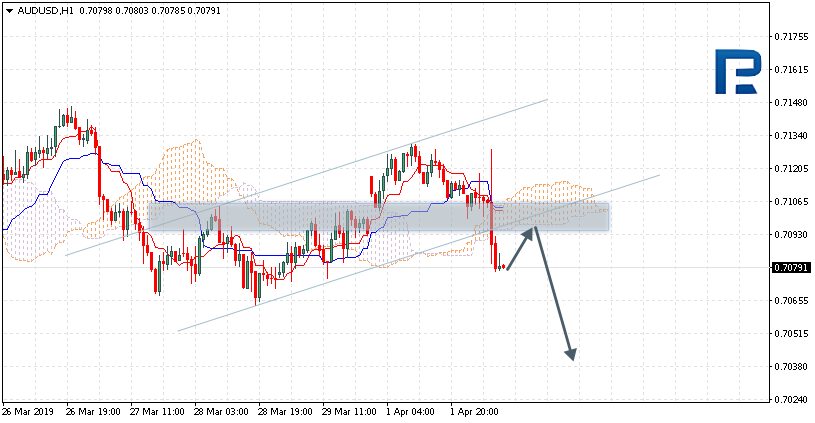
AUDUSD is trading at 0.7079; the instrument is moving below Ichimoku Cloud, thus indicating a descending tendency. The markets could indicate that the price may test the downside border of the cloud at 0.7095 and then resume moving downwards to reach 0.7035. Another signal to confirm further descending movement is the price’s rebounding from the resistance level. However, the scenario that implies further decline may be cancelled if the price breaks the upside border of the cloud and fixes above 0.7125. In this case, the pair may continue growing towards 0.7195.
NZDUSD, “New Zealand Dollar vs US Dollar”
NZDUSD is trading at 0.6777; the instrument is moving below Ichimoku Cloud, thus indicating a descending tendency. The markets could indicate that the price may test Tenkan-Sen and Kijun-Sen at 0.6810 and then resume moving downwards to reach 0.6705. Another signal to confirm further descending movement is the price’s rebounding from the channel’s upside border. However, the scenario that implies further decline may be cancelled if the price breaks the upside border of the cloud and fixes above 0.6865. In this case, the pair may continue growing towards 0.6975.
USDCAD, “US Dollar vs Canadian Dollar”
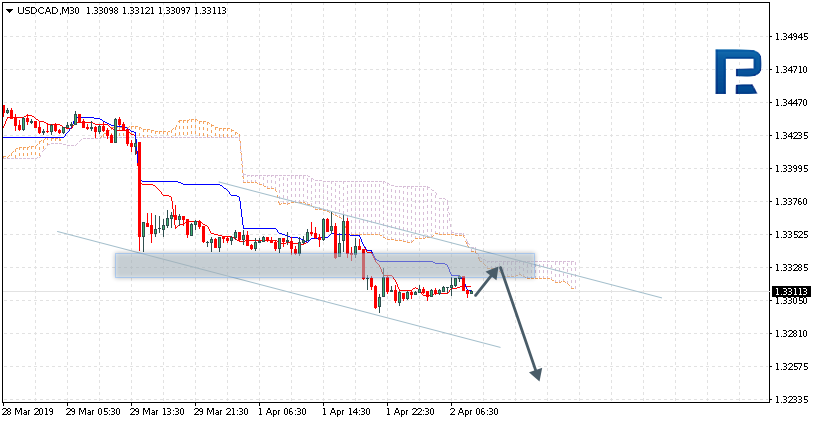
USDCAD is trading at 1.3311; the instrument is moving below Ichimoku Cloud, thus indicating a descending tendency. The markets could indicate that the price may test the downside border of the cloud at 1.3325 and then resume moving downwards to reach 1.3245. Another signal to confirm further descending movement is the price’s rebounding from the channel’s downside border. However, the scenario that implies further decline may be cancelled if the price breaks the upside border of the cloud and fixes above 1.3335. In this case, the pair may continue growing towards 1.3385.
Attention! Forecasts presented in this section only reflect the author’s private opinion and should not be considered as guidance for trading. RoboForex LP bears no responsibility for trading results based on trading recommendations described in these analytical reviews.
EUR/USD remains in a bearish mood. Right now the trading instrument is consolidating around 1.12000. The pressure on the EUR is caused by the weak economic releases.
The Economic News Feed for 02.04.2019:
– Primary Orders on Durable Goods (US) – 15:30 (GMT+2:00);
The indicators point to the power of the buyers, the price fixed below 50 MA and 200 MA.
The MACD histogram is in the negative zone and keeps falling which gives a signal to sell EUR/USD.
The Stochastic Oscillator is in the neutral zone, the %K line is crossing the %D line. There are no signals at the moment.
Trading recommendations
Support levels: 1.11850, 1.11500
Resistance levels: 1.12150, 1.12450, 1.12800
If the price fixed below 1.11850, expect the quotes to fall toward 1.1500-1.11300.
Alternatively, the quotes can correct toward 1.12450-1.12600.
The GBP/USD currency pair
Technical indicators of the currency pair:
Prev Open: 1.30395
Open: 1.30925
% chg. over the last day: +0.35
Day’s range: 1.30238 – 1.31141
52 wk range: 1.2438 – 1.4378
GBP/USD remains active. The financial market participants are evaluating the Brexit situation – so far the British parliament refused to approve 4 alternative Brexit strategies. The EU representatives consider “hard Brexit” the most plausible option. The GBP/USD quotes are testing the 1.30300 and 1.30800 support and resistance levels. You should open positions from them.
At 11:30 (GMT+3:00) the UK will publish a construction PMI.
The indicators point to the power of the sellers, the price fixed below 50 MA and 200 MA.
The MACD histogram is in the negative zone, which points to the bearish mood.
The Stochastic Oscillator is in the neutral zone, the %K line is below the %D line which gives a signal to sell GBP/USD.
Trading recommendations
Support levels: 1.30300, 1.29850
Resistance levels: 1.30800, 1.31200, 1.31500
If the price fixes below 1.30300, expect the quotes to fall toward 1.29850-1.29700.
Alternatively, the quotes can grow toward 1.31200-1.31500.
This article reflects a personal opinion and should not be interpreted as an investment advice, and/or offer, and/or a persistent request for carrying out financial transactions, and/or a guarantee, and/or a forecast of future events.
CAD kept strengthening against the USD. The quotes updated the local minimums and found support at 1.33100. 1.33400 acts as a mirror support. The demand for USD weakened after ambiguous economic releases while CAD is supported by the oil quotes dynamics. The currency pair can descend further, you should open positions from the key levels.
The Economic News Feed for 02.04.2019 is calm.
The price fixed below 50 MA and 200 MA, which points to the power of the sellers.
The MACD histogram is in the negative zone but above the signal line which gives a weak signal to sell USD/CAD.
The Stochastic Oscillator is near the overbought zone, the %K line is above the %D line which points to the bullish mood.
Trading recommendations
Support levels: 1.33100, 1.32900, 1.32600
Resistance levels: 1.33400, 1.33750, 1.34000
If the price fixes below 1.33100, expect the qutoes to fall toward 1.32700-1.32500.
Alternatively, the qutoes can grow toward 1.33700-1.33900.
The USD/JPY currency pair
Technical indicators of the currency pair:
Prev Open: 110.015
Open: 111.344
% chg. over the last day: +0.42
Day’s range: 111.285 – 111.455
52 wk range: 104.56 – 114.56
USD/JPY remains in a bullish mood and updated the local maximums yesterday. The quotes are consolidating around 111.450. 111.150 acts as the closest support. Keep an eye on the economic releases and the US Treasury bonds yield. You should open positions from the key levels.
The Economic News Feed for 02.04.2019 is calm.
The price fixed above 50 MA and 200 MA which points to the power of the buyers.
The MACD histogram is in the positive zone but below the signal line which gives a weak signal to buy USD/JPY.
The Stochastic Oscillator is in the neutral zone, the %K line is above the %D line which also points to the bullish mood.
Trading recommendations
Support levels: 111.150, 110.850, 110.500
Resistance levels: 111.450, 111.700, 112.000
If the price fixes above 111.450, expect the quotes to grow toward 112.000.
Alternatively, the quotes can fall toward 110.850-110.600.
While we have recently suggested the US stock market is poised for further upside price activity with a moderately strong upside price “bias”, our researchers continue to believe the US stock markets will not break out to the upside until the Russell 2000 breaks the current price channel, Bull Flag, formation. Even though the US stock markets open with a gap higher this week, skilled traders must pay attention to how the Mid-Caps and the Russell 2000 are moving throughout this move.
As we continue to advise our clients that the upside pricing cycle in the US stock market is being underestimated, see this research post: we also believe that increased volatility and price rotation will continue to drive larger rotations in price before the final breakout upside move takes place. We want to continue to warn traders that we still don’t have any confirmed upside breakout with price continuing to stay within this price channel in the Russell 2000. Eventually, when and if the price does breakout to the upside, we will have a very clear indication that continued higher prices and a larger upside move is happening. Until then, we need to stay cautious about the types and levels of rotation that continue within the markets.
Recently, volatility has started to increase as can be seen in this VIX chart. If the Russell 2000 is not able to break this trend channel with this current upside price move, then we fully expect continued price rotation in the US stock markets and another increase in the VIX as this rotation takes place. The NQ recently rotated downward by nearly 4% while historical volatility continues to narrow. When volatility diminishes in extended price trends, we’ve learned to expect aggressive price rotation can become more of a concern. We expect the VIX to spike above 16~18 on moderate volatility as we get closer to the cycle inflection date near June/July 2019.
Overall, our researchers believe the upside price bias in the US stock market will continue for another 30+ days as our research and predictions regarding precious metals and the longer term equities price cycles continue to play out. Skilled traders need to be aware that this upside price bias may include larger price rotation and volatility as we get closer to the May/June/July 2019 cycle inflection points. Stay aware of the risks as 4~6%+ price rotations should be expected over the next 30+ days throughout this upside price bias.
Do you want to find a team of dedicated researchers and traders that can help you find and execute better trades in 2019 and beyond? Please visit www.TheTechnicalTraders.com to learn how we can help you prepare for the big moves in the global markets and find better opportunities for greater success in the future. Our team of researchers and traders continue to scan the markets for new trades and unique opportunities.
Yesterday, the US dollar fell slightly against a basket of major currencies amid mixed economic statistics. Thus, the core retail sales index fell by 0.4% in February, while experts forecasted growth by 0.4%. Retail sales also fell by 0.2% in February instead of the expected growth by 0.3%. At the same time, ISM manufacturing PMI increased to 55.3 in March instead of 54.5. The dollar index (#DX) closed with a small minus near three-week highs (-0.03%).
Yesterday, the British Parliament failed to decide the future of Britain in the EU again. So, four Brexit alternatives were rejected. The EU’s chief Brexit negotiator, Michel Barnier, announced that the UK was likely to exit the European Union without an agreement. He also said that Britain could still accept the deal offered by Theresa May, exit without an agreement, or ask to delay Brexit.
The euro weakened against the US dollar amid weak economic statistics yesterday. Thus, German manufacturing PMI fell to 44.1 in March, while experts expected 44.7. The consumer price index in the Eurozone rose by only 1.4% in March instead of the forecasted growth by 1.5%.
Today, during the Asian trading session, the Reserve Bank of Australia has decided on a key interest rate. The regulator left the indicator unchanged at 1.50%. Also, optimistic data on building permits was published in Australia, which rose by 19.1% in February, although experts expected a decline by 1.7%
The “black gold” prices are increasing. At the moment, futures for the WTI crude oil are testing the mark of $61.70 per barrel. At 23:30 (GMT+3:00), a report on the API weekly crude oil stock will be published.
Market Indicators
Yesterday, the bullish sentiment was observed in the US stock market: #SPY (+1.19%), #DIA (+1.26%), #QQQ (+1.32%).
The 10-year US government bonds yield is growing. At the moment, the indicator is at the level of 2.46-2.47%.
The news feed on 02.04.2019:
– The index of economic activity in the UK construction sector at 11:30 (GMT+3:00); – Core durable goods orders in the US at 15:30 (GMT+3:00).
On Monday the 1st of April, trading on the euro closed down. The euro collapsed to 1.1204 during the American session. US services and manufacturing PMI data sparked a rise in US10Y bond yields. This caused the dollar to rise, and the euro to fall.
Day’s news (GMT+3):
09:30 Switzerland: CPI (Mar).
10:00 Eurozone: ECB’s Praet speech.
11:30 UK: Markit construction PMI (Mar).
12:00 Eurozone: PPI (Feb), unemployment change (Feb).
15:30 US: durable goods orders (Feb).
23:30 US: API weekly crude oil stock (25 Mar).
Current situation:
I’m tired of the situation with Brexit, so I’ve decided not to include a chart in today’s review. The pound gained ground against the dollar yesterday to revisit Friday’s high. Traders were hoping that the UK would decline to leave the EU without a deal. In Asia, the GBPUSD pair dropped from 1.3115 to 1.3026. The British parliament approved a process for voting on 4 alternative Brexit scenarios.
The news is causing swings in both directions on the EURGBP cross, which in turn is affecting the EURUSD pair. US data and bond yields are adding to the confusion. Once again we have uncertainty on the market.
The biggest losers today are the pound and the Aussie dollar. The Aussie has dropped in response to the RBA downgrading its inflation forecast in its monetary policy statement, while the pound has dropped over inaction over Brexit.
The euro is weak from the pressure being exerted on it via the crosses. It’s worth noting that there’s been a sharp drop in US10Y bond yields, and this favours the euro. The technical picture on the hourly timeframe from the 28th of March looks more like a long flat than a trend movement. Bullish attempts to induce an upwards reversal are being scuppered by fundamental factors. I have no idea what’s going to happen with the euro given that markets are under pressure from Brexit, and officials are arguing amongst themselves. The 112th degree at 1.1189 marks a reversal level. After this, the road is open towards 1.1165. We might see the beginning of a correction from this zone.
The pound will flatline on the outcome of latest parliamentary Brexit vote, affirms the CEO of one of the world’s largest independent financial advisory organizations.
deVere Group’s Nigel Green is speaking out after this evening’s latest parliamentary vote.
Mr Green comments: “MPs have failed to find a way out of the UK’s Brexit crisis, rejecting a series of alternative strategies in the House of Commons for a second time.
“Sterling and UK assets can be expected to flatline now that there is a parliamentary consensus on how to move forward with Brexit.
“The UK economy would have benefitted if there had have been a clear majority of any of the four motions selected by the Speaker, John Bercow. There would have been a likely boost as household spending and investment that had been on the sidelines is unleashed.”
“MPs are failing UK business and the legacy of this failure will last a generation.”
He continues: “With so many question marks hanging over the Brexit process,
It’s essential for those who are serious about safeguarding, creating and growing their wealth to ensure that their portfolios are properly diversified. Diversification is the investor’s best weapon to mitigate risk and capitalise on the opportunities as they arise.”
The deVere CEO concludes: “MPs must find a way forward. Failure to do so is too high.”
About:
deVere Group is one of the world’s largest independent advisors of specialist global financial solutions to international, local mass affluent, and high-net-worth clients. It has a network of more than 70 offices across the world, over 80,000 clients and $12bn under advisement.
As we’ve been suggesting for months, expect continued moderate price weakness in Gold and Silver through most of April 2019 and possibly into early May 2019 before a strong price rally will setup and push Gold prices well above $1500 before the end of 2019. Our Adaptive Dynamic Learning predictive price modeling system has been calling for this move for many months (see the chart below). This advanced predictive price modeling system is suggesting that in May/June of 2019, we will likely see a bigger price rally unfold in Gold and Silver which may be paired with some type of geopolitical or global economic event. See this article for more details.
Gold rallies on fear (in most cases) and the only reason for Gold to really as our ADL predictive modeling system is suggesting is that some renewed level of fear could enter the global markets. This could be from any type of global crisis event or even a regional crisis event (think Brexit, EU crisis or some other foreign nation crisis). We believe skilled traders should be actively seeking to identify buying opportunities below $1295 in Gold as we only have about 20 days left before our original bottom/base date of April 21, 2019.
This Gold Monthly chart, below, highlights the ADL predictive modeling systems expectations as well as the three support levels that we believe all Gold traders should be targeting. Gold is currently within the first target level and an opportunity to buy below $1295 would be an excellent starting position. Further, any additional opportunity to buy below $1250 should be an incredible opportunity – if it happens. Lastly, our lowest support level is below $1165. Although unlikely, if Gold retraces to below this level, then please don’t miss this opportunity to get into additional long positions.
Our ADL predictive price modeling system is suggesting that May & June 2019 will start a bullish price rally in Gold and Silver that should push prices well above $1500 by October/November 2019 – possibly much higher. Overall, we believe this could be the beginning of a much bigger upside leg in Precious metals and all traders need to be aware of this future price move.
We’ve been suggesting this could be the “move of a lifetime” setting up in the metals because it will likely pair or align with some type of broader global stock market move to the downside. Our opinion is that May/June are dates that all traders should consider developing very protective positions as the markets shake up and Gold begins this incredible run higher.
Take a minute to visit TheTechnicalTraders.com to learn how we help our members find and execute better trades while keeping them aware of market trends, cycles and key insights using our proprietary predictive price modeling utilities. We are certain you will find our research above and beyond anything else you’ve seen anywhere on the planet. Please consider joining our other hundreds of members in developing better skills and finding incredible opportunities for future success while trading with TheTechnicalTraders.com.
Last week, as well as several previous months, all attention in GBPUSD was focused on the Brexit talks. Emotions ran high, thus making the Pound fall significantly at the end of the week.
On Thursday, the British Prime Minister Theresa May offered her colleagues from the Parliament a deal: she would resign if they approved the Brexit agreement and no longer prevented it from being signed. This move failed – the British policymakers once again confirmed that they do not alter their decisions. Evening Standard wrote last week that “Theresa May’s Brexit deal was dead” because the third consecutive vote on the Brexit agreement with the European Union failed.
As a result, the vote that took place on Friday was no success for May: 344 members of the Parliament said “no” to the Brexit agreement.
What’s next? The European parliament is going to have a special summit on April 10th to decide what to do with these difficult and complicated Brits, who first decided to leave the Union, but later couldn’t settle their choice among themselves.
The most probable scenario for the nearest future is the United Kingdom’s exiting the European Union without any agreements at all. This is the most “hardcore” scenario, which two of the country’s Prime Ministers attempted to avoid, but was made inevitable by the British Parliament. The Brexit date might be April 12th. The European Union will do the Brits no more favors – there must be serious reasons for delaying the Brexit and the British lords’ disagreement with the reality is not one of them.
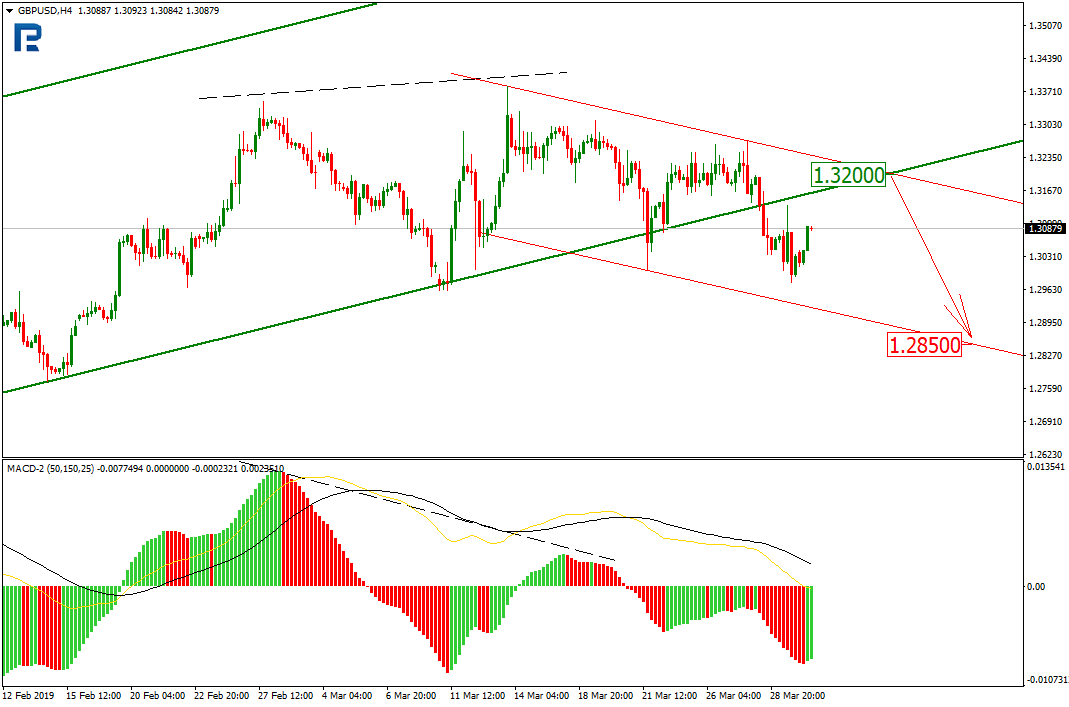
In the H4 chart, GBPUSD is trying to break its rising tendency and start a new one to the downside. The pair is attempting to fix below the support line of the previous channel. The short-term growth may be heading towards the key resistance level at 1.3200. This movement may be considered as a correction tor testing investors’ sentiment. The instrument has already formed the descending channel, which means that after testing 1.3200 it is expected to resume falling towards the support at 1.2850.
Disclaimer
Any predictions contained herein are based on the authors’ particular opinion. This analysis shall not be treated as trading advice. RoboForex shall not be held liable for the results of the trades arising from relying upon trading recommendations and reviews contained herein.