EURUSD has completed the correction; right now, it is moving downwards. Today, the pair may fall to reach 1.1190 and then resume growing towards 1.1222. Later, the market may continue trading inside the downtrend to reach 1.1177. The short-term target of this descending wave is at 1.1111.
GBPUSD, “Great Britain Pound vs US Dollar”
GBPUSD has broken 1.3120 and completed another descending structure. Possibly, today the pair may continue this descending wave with the target at 1.3030 and form a new consolidation range around 1.3100. The key target of this wave is at 1.2950.
USDCHF, “US Dollar vs Swiss Franc”
USDCHF is trading to break 0.9999. Possibly, today the pair may reach 1.0025 and then start a new correction towards 0.9965. Later, the market may resume growing with the first target at 1.0035.
USDJPY, “US Dollar vs Japanese Yen”
USDJPY has reached the short-term upside target. Today, the pair may form a new consolidation range with a reversal pattern near the highs. After that, the instrument may start the fourth correctional structure with the target at 111.04.
AUDUSD, “Australian Dollar vs US Dollar”
AUDUSD is consolidating below 0.7128. If later the price breaks this range to the downside, the instrument may resume trading inside the downtrend with the short-term target at 0.6980; it to the upside – continue the correction towards 0.7167.
USDRUB, “US Dollar vs Russian Ruble”
USDRUB has finished the first descending wave along with the correction. Possibly, today the pair may form a new descending structure with the short-term target at 64.60. Later, the market may resume growing to reach 65.06 and then start a new decline towards 64.27.
XAUUSD, “Gold vs US Dollar”
Gold has completed another descending structure at 1281.90 and tested 1291.70 from below. According to the main scenario, the price is expected to form one more descending structure to 1276.80 and then continue trading inside the downtrend with the short-term target at 1260.00.
BRENT
Brent is consolidating below 70.17. Today, the pair may continue growing with the short-term target at 70.90 and then start another correction towards 68.60. After that, the instrument may form one more ascending structure with the target at 73.05.
Attention! Forecasts presented in this section only reflect the author’s private opinion and should not be considered as guidance for trading. RoboForex LP bears no responsibility for trading results based on trading recommendations described in these analytical reviews.
EUR/USD has stabilized. There is no defined trend, the investors are waiting the US labour market report for March. This report can influence all major currencies so keep an eye on the difference between forecasted and real-life indicator values. EUR is also under pressure after the last ECB meeting regarding monetary policy. The regulator is reviewing additional economy-stimulating measures. The Central Bank does not intend to increase the interest rates until the end of the year. Right now the local support and resistance levels are 1.12100 and 1.12350.
The Economic News Feed for 05.04.2019:
– Labour Market Report (US) – 15:30 (GMT+3:00);
Also keep an eye on the relevant data regarding the US/China trading negotiations. Donald Trump stated on Thursday that both sides are close to an agreement which could be announced in the next four weeks.
The indicators do not provide precise data, the price has crossed 50 MA and 200 MA.
The MACD histogram is close to 0.
The Stochastic Oscillator is in the neutral zone, the %K line is crossing the %D line. There are no signals at the moment.
Trading recommendations
Support levels: 1.12100, 1.11850, 1.11500
Resistance levels: 1.12350, 1.12550, 1.12800
If the price fixes at 1.12100, expect the quotes to fall toward 1.11800-1.11500.
Alternatively, the quotes can recover toward 1.13000.
The GBP/USD currency pair
Technical indicators of the currency pair:
Prev Open: 1.31545
Open: 1.30733
% chg. over the last day: -0.66
Day’s range: 1.30666 – 1.31218
52 wk range: 1.2438 – 1.4378
GBP/USD is in an agressive sell-off. GBP has lost more than 85 points and updated the local minimums. The financial market participants keep watching the Brexit situation. The House of Commons have voted for postponing Brexit. According to Reuters, GBP is set to grow by 3% when the Brexit issue is resolved. Right now the key range is 1.30600-1.31200. You should open positions from these levels and wait for the US Labour Market Report.
The Economic News Feed for 05.04.2019 is calm.
The indicators do not provide precise signals, 50 MA started to cross 200 MA.
The MACD histogram is in the negative zone but above the signal line, which gives a weak signal to sell GBP/USD.
The Stochastic Oscillator is in the neutral zone, the %K line is below the %D line which points to the bearish mood.
Trading recommendations
Support levels: 1.30600, 1.30150, 1.29850
Resistance levels: 1.31200, 1.31500, 1.32000
If 1.31200, expect further growth toward 1.32000.
Alternatively, the quotes can fall toward 1.30400-1.30000.
This article reflects a personal opinion and should not be interpreted as an investment advice, and/or offer, and/or a persistent request for carrying out financial transactions, and/or a guarantee, and/or a forecast of future events.
USD/CAD keeps trading in a flat. There is no defined trend. Right now the investors are waiting for important economic releases. At 15:30 (GMT+3:00) the US and Canada will publish a Labour Market report for March. The key support and resistance levels are 1.33400 and 1.33750. You should open position from these levels.
CAD is supported by the positive business activity’s reports by Ivy.
The indicators do not provide precise signals, the price fixed between 50 MA and 200 MA.
The MACD histogram is close to .
The Stochastic Oscillator is close to the oversold zone, the %K line is crossing the %D line. There are no signals at the moment.
Trading recommendations
Support levels: 1.33400, 1.33000
Resistance levels: 1.33750, 1.34000, 1.34400
If the price fixes below 1.33400, consider selling USD/CAD, the price is expected to fall toward 1.33000.
Alternatively, the quotes can grow toward 1.33900-1.34200.
The USD/JPY currency pair
Technical indicators of the currency pair:
Prev Open: 111.454
Open: 111.643
% chg. over the last day: +0.16
Day’s range: 111.596 – 111.800
52 wk range: 104.56 – 114.56
USD/JPY keeps showing a bullish mood. Yesterday the quotes updated the local maximums. The trading instrument found the resistance at 111.750. 111.450 acts as a mirror support. The demand for safe haven currencies is weakened due to productive US/China negotiations. Right now the financial market participants are waiting for the US Labour Market report. Keep an eye on the US Treasury bonds’ yield and open positions from the key levels.
The Economic News Feed for 05.04.2019 is calm.
The indicators point to the power of the buyers, the price fixed above 50 MA and 200 MA.
The MACD histogram is in the positive zone but below the signal line which gives a weak signal to buy USD/JPY.
The Stochastic Oscillator is in the neutral zone, the %K line is above the %D line which points to the bullish mood.
Trading recommendations
Support levels: 111.450, 111.150, 110.850
Resistance levels: 111.750, 112.000
If the price fixes above 111.750, expect further growth toward 112.250-112.500.
Alternatively, the quotes can fall toward 111.000.
The US dollar strengthened against a basket of major currencies amid optimistic news regarding US-China trade relations. Yesterday, US President Donald Trump announced that Washington and Beijing intended to complete negotiations and conclude a new trade deal in the next four weeks. Chinese President Xi Jinping is also pleased with the progress of the negotiations. The dollar index (#DX) closed in the positive zone (+0.27%).
Positive statistics from the United States supported the US currency. Thus, the number of initial jobless claims fell to 202K, while experts expected 216K. Today, investors have taken a wait-and-see attitude before the publication of the report on the US labor market for March. We recommend paying attention to the difference between the actual and forecasted values.
The situation concerning Brexit is still in the spotlight. Earlier, members of the House of Commons supported the bill, which obliges the government to seek the Brexit delay from the EU. Theresa May intends to persuade the opposition to support the Brexit agreement, which has been rejected three times already. Earlier it was reported that the leader of the opposition Labour Party, Jeremy Corbyn, and the British Prime Minister held constructive negotiations and agreed on a joint work program on the implementation of Brexit.
The “black gold” prices have moved away from annual highs. At the moment, futures for the WTI crude oil are consolidating near $62.00 per barrel.
Market Indicators
Yesterday, there was a variety of trends in the US stock market: #SPY (+0.27%), #DIA (+0.68%), #QQQ (-0.04%).
The 10-year US government bonds yield is at the level of 2.51-2.52%.
The news feed on 05.04.2019:
At 15:30 (GMT+3:00) reports on the labor market will be published in the United States and Canada.
As we can see in the H4 chart, the mid-term ascending correction has reached the retracement of 61.8%. The next target may be the retracement of 76.0% at 5717.00. The support is the retracement of 38.2% at 4433.00.
In the H1 chart, the divergence made the pair resume falling; it has already reached the retracement of 38.2%. The next targets are the retracements of 50.0% and 61.8% at 4700.00 and 4547.00 respectively. The resistance is the high at 5345.00.
ETHUSD, “Ethereum vs. US Dollar”
As we can see in the H4 chart, the correctional uptrend has already reached the retracements of 61.8%. The next target may be the retracement of 76.0% at 189.00. The support level is the retracement of 38.2% at 135.30.
In the H1 chart, ETHUSD is being corrected and has already reached the retracement of 61.8%. The next target may be the retracement of 76.0% at 148.89. The local resistance is the high at 179.97.
Attention! Forecasts presented in this section only reflect the author’s private opinion and should not be considered as guidance for trading. RoboForex LP bears no responsibility for trading results based on trading recommendations described in these analytical reviews.
On Thursday the 4th of April, trading on the euro closed down. During the European session, the single currency dropped to 1.1231 against the greenback amid weak German and Italian data. Factory orders in Germany came out lower than expected, and Italy downgraded its economic growth forecast for 2019 to 0.3%, while increasing its budget deficit to around 2.3% of GDP.
Pressure on the euro increased during the US session on the back of a broadly stronger dollar and a weaker pound. The US labour market situation has improved ahead of the payrolls report on account of the number of initial jobless claims reported.
Pressure on the pound increased over reports that talks between the British government and the opposition Labour party are not going very smoothly. The euro dropped to 1.1206. By close, the pair had recovered to 1.1220.
15:30 US: nonfarm payrolls (Mar), unemployment rate (Mar), average hourly earnings (Mar), average weekly hours (Mar), labour force participation rate (Mar).
20:00 US: Baker Hughes US oil rig count.
22:00 US: consumer credit change (Feb).
Current situation:
The drop on the EURUSD pair stopped at the 61.8% Fibonacci level of the growth from 1.1184 to 1.1255 around the 45th degree (1.1202). At the time of writing, the pair is trading at 1.1234.
The fundamentals dominated the technicals yesterday. Trader attention today will be turned towards the US labour market report for March set to be released at 15:30 (GMT+3). This is important data for the US Fed as well as the market in general. If the number of new jobs created turns out to be low like last month (20k), it could ignite speculation on the possibility of lowering interest rates in the US this year, which would heap pressure on the dollar.
There’s no forecast on today’s chart due to the payrolls report. Also, this week has been particularly volatile, whether due to Brexit news, or the retreat from risky assets.
Our researchers, at Technical Traders Ltd., believe a current pennant/flag formation in the Canadian Dollar is suggesting an upside breakout move may be setting up over the next 5~7+ days. Recently, the Canadian Dollar has weakened from 0.76875 to lows near 0.74375. Current price rotation is almost perfectly aligned with Fibonacci Price theory suggesting that the recent failure to establish any new lower price level (highlighted on this chart in MAGENTA), suggests a tightening price range as the current pennant/flag formation completes over the next 5~7+ days. It is our belief that as long as the current price level stays above the 0.74375 level throughout the completed pennant apex, an upside price break is very likely.
Skilled traders may look at this opportunity for an incredible 200+ pip upside price swing. We believe the current downward price trend will be the last opportunity to target lower prices before the upside breakout occurs. The next 3~5 days will likely see prices move a bit lower, targeting the lower support channel before the breakout rally begins.
Interestingly enough, this move in the Canadian Dollar aligns with our Gold/Silver research suggesting an April 21~24 date as a major bottom/basing date. Could it be that some currency fluctuation or global market event will drive bigger moves in many of the major currencies while pushing traders into the precious metals markets at the same time? We’ll know more as we get closer to the April 21~24 date, but right now we believe all the tea leaves are aligning for some type of bigger move in later April and skilled traders should begin positioning their trades accordingly.
If you want to learn how valuable a team of dedicated researchers and traders can be to your bottom line, visit TheTechnicalTraders.com to learn how we can help you find and profit from these moves. We believe you won’t find anything like our proprietary research and trading triggers anywhere else on the planet. Do yourself a favor and read some of our recent research posts to see just how valuable we can be to your future – then consider supporting our team and effort to assist you.
As we can see in the H4 chart, XAUUSD has reached the support level; right now, it is trading close to it and forming Hammer, Inverted Hammer, and Doji reversal patterns. Judging by the previous movements, it may be assumed that after finishing the pullback the instrument may continue its ascending movement.
NZDUSD, “New Zealand vs. US Dollar”
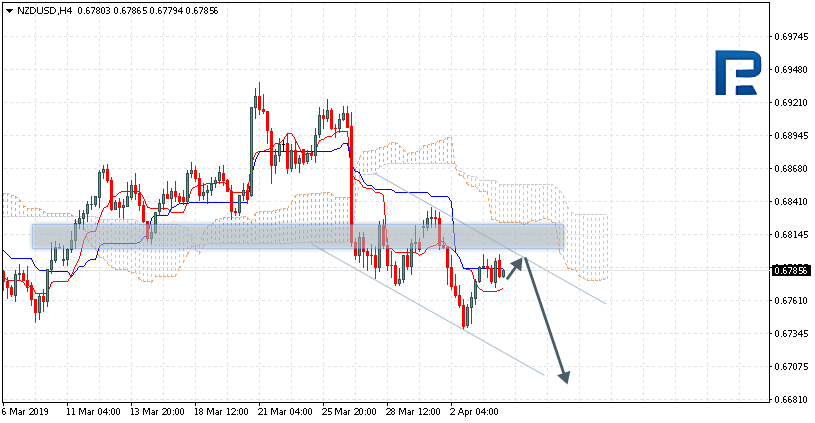
As we can see in the H4 chart, NZDUSD is testing the support level and forming Hammer, Harami, and Doji reversal patterns. Judging by the previous movements, it may be assumed that after testing the level the instrument may continue its growth.
Attention! Forecasts presented in this section only reflect the author’s private opinion and should not be considered as guidance for trading. RoboForex LP bears no responsibility for trading results based on trading recommendations described in these analytical reviews.
UK and global business will welcome Britain’s political leaders finally beginning to show leadership, affirms the CEO of one of the world’s largest independent financial advisory organizations.
Nigel Green, chief executive and founder of deVere Group, is speaking after Prime Minister Theresa May had “constructive” talks with opposition leader Jeremy Corbyn on Wednesday afternoon to end the deadlock over Brexit. Further discussions between the two sides will take place over the coming days.
A spokesman for No 10 said both sides were “showing flexibility.”
The observation also comes as the House of Commons voted in favour of legislation which forces the UK government to request another extension to the Brexit process.
Mr Green comments: “Finally it appears that some cross-party leadership is being shown in an effort to end the impasse. This must be and will be championed by businesses in the UK and those around the world that trade with Britain.
“It is a national disgrace that nine days to go until the fifth largest economy in the world is supposed to be leaving the world’s largest trading bloc and no-one still knows what’s going to happen.
“It must now be hoped that a consensus can be found, giving the roadmap more clarity for business.”
He continues: “Should this happen, the pound and UK assets can be expected to rally.
“The UK economy will benefit from a likely boost as household spending and investment that had been on the sidelines is unleashed.”
“Whilst this is not the Brexit some people want, it is now essential to foster unity and build back momentum in the economy to ensure long-term, sustainable economic growth.”
Mr Green goes on to add: “However, simultaneously, there are genuine concerns in business that Mrs May has also increased the possibility of a general election by proposing a cross-party Brexit deal, and this would have a negative impact on the pound and UK assets.”
The deVere CEO concludes: “All the continuing uncertainty makes it essential for those who are serious about safeguarding, creating and growing their wealth to ensure that their portfolios are properly diversified. Diversification is the investor’s best weapon to mitigate risk and capitalise on the opportunities as they arise.”
About:
deVere Group is one of the world’s largest independent advisors of specialist global financial solutions to international, local mass affluent, and high-net-worth clients. It has a network of more than 70 offices across the world, over 80,000 clients and $12bn under advisement.
AUDUSD is trading at 0.7116; the instrument is moving above Ichimoku Cloud, thus indicating an ascending tendency. The markets could indicate that the price may test the upside border of the cloud at 0.7100 and then resume moving upwards to reach 0.7175. Another signal to confirm further ascending movement is the price’s rebounding from the support level. However, the scenario that implies further growth may be cancelled if the price breaks the downside border of the cloud and fixes below 0.7075. In this case, the pair may continue falling towards 0.7035. After breaking the channel’s upside border and fixing above 0.7145, the price may continue moving upwards.
NZDUSD, “New Zealand Dollar vs US Dollar”
NZDUSD is trading at 0.6785; the instrument is moving below Ichimoku Cloud, thus indicating a descending tendency. The markets could indicate that the price may test Tenkan-Sen and Kijun-Sen at 0.6795 and then resume moving downwards to reach 0.6695. Another signal to confirm further descending movement is the price’s rebounding from the channel’s upside border. However, the scenario that implies further decline may be cancelled if the price breaks the upside border of the cloud and fixes above 0.6855. In this case, the pair may continue growing towards 0.6965.
USDCAD, “US Dollar vs Canadian Dollar”
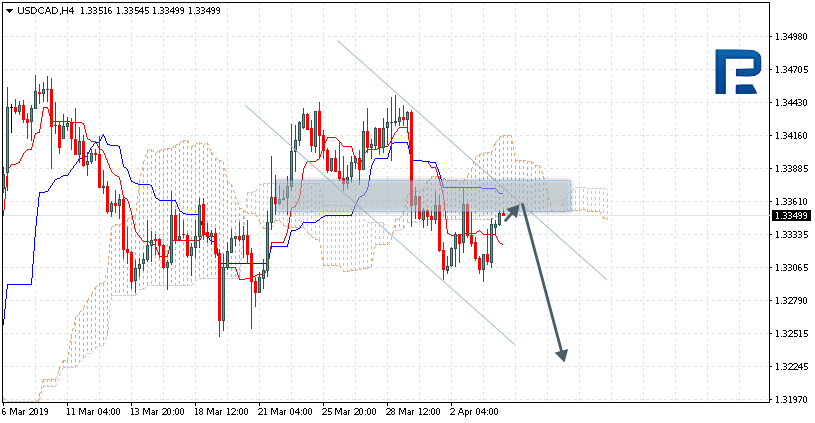
USDCAD is trading at 1.3349; the instrument is moving below Ichimoku Cloud, thus indicating a descending tendency. The markets could indicate that the price may test the downside border of the cloud at 1.3355 and then resume moving downwards to reach 1.3225. Another signal to confirm further descending movement is the price’s rebounding from the resistance level. However, the scenario that implies further decline may be cancelled if the price breaks the upside border of the cloud and fixes above 1.3355. In this case, the pair may continue growing towards 1.3395.
Attention! Forecasts presented in this section only reflect the author’s private opinion and should not be considered as guidance for trading. RoboForex LP bears no responsibility for trading results based on trading recommendations described in these analytical reviews.
EUR keeps recovering against the USD. Yesterday the currency pair updated the local minimums. Hopes for a coming resolution of the US/China conflict have cause the risky assets’ value to grow. According to Financial Times, Washington and Beijing are close to singing the final trade agreement. USD is under pressure due to weak business activity reports in the non-industrial sector, as well as the labour market reports. Right now the quotes are consolidating around 1.12200-1.12500. You should open positions from these levels. EUR/USD has a currency to rescend.
The indicators do not provide precise signals, the price fixed between 50 MA and 200 MA.
The MACD histogram is in the positive zone but below the signal line which gives a weak signal to buy EUR/USD.
The Stochastic Oscillator is in the neutral zone, the %K line is crossing the %D line. There are no signals at the moment.
Trading recommendations
Support levels: 1.12200, 1.11850, 1.11500
Resistance levels: 1.12500, 1.12800, 1.13250
If the price fixes above 1.12500, expect the quotes to fall toward 1.12800-1.13200.
Alternatively, the quotes can fall toward 1.12000-1.11700.
The GBP/USD currency pair
Technical indicators of the currency pair:
Prev Open: 1.31302
Open: 1.31545
% chg. over the last day: +0.36
Day’s range: 1.31525 – 1.31910
52 wk range: 1.2438 – 1.4378
GBP/USD stabilized after the sharp growth before. The quotes are testing the key support and resistance levels at 1.31500 and 1.32000. The Brexit ambiguousness remains in the spotlight. Theresa May plans to meet with the leaders of opposition to find a way out of this situation. Keep an eye on the Brexit situation and open positions from the key levels.
The news feed is calm today.
The indicators do not provide precise signals, 50 MA has crossed 200 MA.
The MACD hitogram is in the positive zone but below the signal line which gives a weak signal to buy EUR/USD.
The Stochastic Oscillator is in the neutral zone, the %K line is above the %D line which points to the bullish mood.
Trading recommendations
Support levels: 1.31500, 1.31200, 1.30800
Resistance levels: 1.32000, 1.32400, 1.32650
If the price fixes above the round 1.32000, expect the quotes to grow toward 1.32400-1.32650.
Alternatively, the quotes can fall toward 1.31200-1.31000.
This article reflects a personal opinion and should not be interpreted as an investment advice, and/or offer, and/or a persistent request for carrying out financial transactions, and/or a guarantee, and/or a forecast of future events.
USD/CAD is trading in a flat with a very wide range. The quotes are consolidating. The financial market participants are waiting for additional drivers. The local support and resistance levels are showing at 1.33350 and 1.33600. CAD is supported by the positive oil quotes dynamics. Open positions from the key levels.
At 17:00 (GMT+3:00) Canada will publish a PMI by Ivey.
The indicators differ. The price fixed between 50 MA and 200 MA which act as strong dynamic support and resistance levels.
The MACD histogram is in the positive zone and above the signal line which gives a strong signal to buy USD/CAD.
The Stochastic Oscillator is in the neutral zone, the %K line is below the %D line which points to the bearish mood.
Trading recommendations
Support levels: 1.33350, 1.33000
Resistance levels: 1.33600, 1.33750, 1.34000
If the price fixes below 1.33350, consider selling USD/CAD with 1.33000 acting as a price-fixation level.
Alternatively, the quotes can grow toward 1.33800-1.34000.
The USD/JPY currency pair
Technical indicators of the currency pair:
Prev Open: 111.314
Open: 111.454
% chg. over the last day: +0.06
Day’s range: 111.336 – 111.522
52 wk range: 104.56 – 114.56
USD/JPY shows an ambiguous technical picture. The quotes are consolidating. The local support and resistance levels are at 111.150-111.550. The demand for safe have currencies is weakened due to US/China negotiations coming to an end. The USD is under pressure due to weak economic resources. Keep an eye on the US Treasury bonds dynamics. Open the positions from the key levels.
The Economic News Feed for 04.04.2019 is calm.
The indicators do not provide precise signals, the price crossed 50 MA.
The MACD histogram is close to 0.
The Stochastic Oscillator is in the neutral zone, the %K line is crossing the %D line. There are no signals at the moment.
Trading recommendations
Support levels: 111.150, 110.850, 110.500
Resistance levels: 111.550, 112.000
If the price fixes above 111.150, expect further growth toward 112.000.
Alternatively, the qutoes can fall toward 110.850-110.600.