On Tuesday the 9th of April, trading on the euro closed slightly down. On the back of Brexit rumours and the rising crosses, the EURUSD pair jumped to 1.1284 during the first half of the European session. Ahead of the ECB’s monetary policy meeting, the pair returned to the 1.1255 support.
Day’s news (GMT+3):
11:30 UK: GDP (Feb), industrial production (Feb), manufacturing production (Feb), trade balance (Feb).
14:45 Eurozone: ECB interest rate decision.
15:30 Eurozone: ECB monetary policy statement and press conference.
15:30 US: CPI (Mar).
20:30 US: EIA crude oil stocks change (5 Apr).
21:00 US: FOMC minutes.
Current situation:
The pair returned to the support and the balance line from which it has rebounded upwards. The pair is now trading at 1.1272. The ECB’s meeting and subsequent press conference with Mario Draghi are at the centre of attention today, along with the FOMC minutes and the EU summit, where officials will discuss moving the UK’s date of exit to the 30th of June.
The UK parliament has approved Theresa May’s plan to move the date of departure from the EU from the 12th of April to the 30th of June. Today, Theresa May will meet with the heads of state of Germany and France. Brexit is already factored in by markets, although individual headlines can still have short-term effects on day traders.
Now everyone is looking at the increased trade tensions between the EU and US. The US is planning to impose import tariffs on the EU to the tune of 11b USD, including on civilian aircraft and agricultural products. This is bad for the euro. I think that markets will start to factor in these trade tensions after Mario Draghi’s speech. On the daily timeframe, yesterday’s candlestick closed with a long tail; a bearish signal.
The pinhole puncture in the global “Fintech” bubble keeps growing, despite drastic attempts to seal it shut. The most recent and radical attempt occurred on February 18, when BaFin, Germany’s financial regulator, issued a temporary short-selling ban in Wirecard after its shares plunged 40% in less than three weeks. Wrote one news source, “Germany bans speculative attacks on Wirecard stock”, as if those shorting the market were wielding pitch forks and lobbing actual threats against the stock’s upside.
Incredibly, vilifying short sellers is as old as the market itself. The first short-selling ban occurred in 1610, after the Dutch East India Company crashed. Notorious short-seller Isaac Le Maire was barred from the market, leaving Amsterdam a pariah. In the 1790s, Napoleon Bonaparte charged short sellers with treason during the financial chaos of the French Revolution.
And, most infamous is Jesse L. Livermore, the brilliant trader who shorted the U.S. stock market in September 1929, earning $100 million ($1.7 billion in today’s money) in the ensuing crash. Livermore was publicly skewered in newspapers as the “Great Bear of Wall Street.”
Still, history shows that the draconian move of banning short selling is hardly effective. Amidst the Livermore debacle, the newly minted U.S. Securities & Exchange Commission made plans to reinstate a century-old short-selling ban, which didn’t go into effect until 1934 — after the U.S. stock market had already lost 89% in value.
In 2008, the SEC, acting in concert with the UK Financial Services Authority, prohibited short selling in 799 financial companies to stem the bleeding from the subprime mortgage meltdown. SEC Chairman Christopher Cox gave this assurance of the ban’s efficacy: “The emergency order… will restore equilibrium to markets.” Yet, instead, the global financial sector entered an accelerated and prolonged period of chaos and value destruction.
Now, we have BaFin’s attempt to save Fintech by banning short selling in one of the sector’s most iconic companies. BaFin noted the importance of Wirecard to the German market and economy, and heartened: “There was risk of further downward spiral without restrictions on shorting the stock,” echoing Christopher Cox’s confidence in 2008. The strategy won’t work, because short selling isn’t causing the market’s decline; an ongoing negative social mood trend in Europe is. As the most sensitive meter of social mood, Fintech stocks warned of this shift long before there was a sustained downturn. (See other signs of a negative shift in social mood across Europe here.
The first signs began to emerge last fall. In September 2018, we observed how the financial technology sector had become another benefactor of society’s blooming optimism. But that optimism had then reached a dangerous extreme, as evidenced in the soaring valuations and growth forecasts across the industry. Soon after, Wirecard replaced Commerzbank, a 149-year old institution, on the DAX 30 index. We warned, “The Global fintech Thematic Index [is]on course for a jaw-dropping setback. … In fact so many mania symptoms plague the sector that the sell-off could be catastrophic.”
Depicted below is the sudden reversal in Wirecard and the Global fintech Thematic Index that followed, in which the latter’s shares dropped 57%.
Jesse L. Livermore, the trader blamed for the 1929 U.S. stock market crash, was known to have said: “All through time, people have basically acted and reacted the same way in the market as a result of: greed, fear, ignorance, and hope.”
When there’s hope, and prices are rising, short selling is deemed a necessary part of a balanced system that encourages free will speculation. When that hope turns to fear, short selling is then vilified as the cause of market crashes. We believe many of the components of that shift are well underway in Europe now.
Our researchers, at Technical Traders Ltd., believe this current upside price move is nearing the end of any immediate upside potential. Yes, back in December 2018 and before, we called for an “Ultimate Low” pattern setup followed by an incredible run to new all-time highs when almost everyone else was calling for a continued downside price move. Now, that the YM/DOW is only 640 points away from reaching all-time highs again, we believe a new price peak will setup sometime near June/July 2019.
Our researchers believe the continued upside price bias will stay in place for at least another 30 days and that the YM.DOW will establish new higher all-time highs in late April or early May 2019. We believe once a “scouting party” type price move completes above the all-time highs near $27,000, a sideways price rotation will begin that may last as long as 25 to 55 days. Our predictive modeling systems are suggesting that June/July are important months for the global equities/stock markets and we believe we’ll know more about the setups that will prompt bigger moves as we get closer to these dates.
Right now, our researchers are suggesting the upside move in the YM/DOW is likely to push higher by +2.5 to +3% or slightly more. Once the $27,000 level is breached to the upside, traders should begin to become much more cautious of price rotation and volatility. As we head into June/July/August 2019, be prepared for a spike in volatility/VIX as price rotation is likely to become much more aggressive.
Read our most recent research to learn more about what we believe will happen over the next few months. Get ready for some bigger price swings and prepare for the last bit of upside price trending before a price peak sets up near June/July. Ultimately, we believe there is an opportunity for skilled traders that can see and create opportunity from these moves. We’ve been warning that 2019 is going to be an incredible year for skilled traders – our call near the end of 2018 that this move higher would target new all-time highs is proof of the opportunity that exists if you pay attention to our research. Do you know of any other firm that called this move as accurately as we did?
On September 17, 2018 our Predictive Trading Model Suggests Falling Stock Prices During US Elections.
Please visit TheTechnicalTraders.com to learn more about how we help our members learn to find and execute incredible trading opportunities. We’ve recently launched a new technology solution for our members that delivers our incredible research and trading solutions. 2019 is going to continue to be an incredible year for skilled traders – you won’t want to miss these big moves that are setting up.
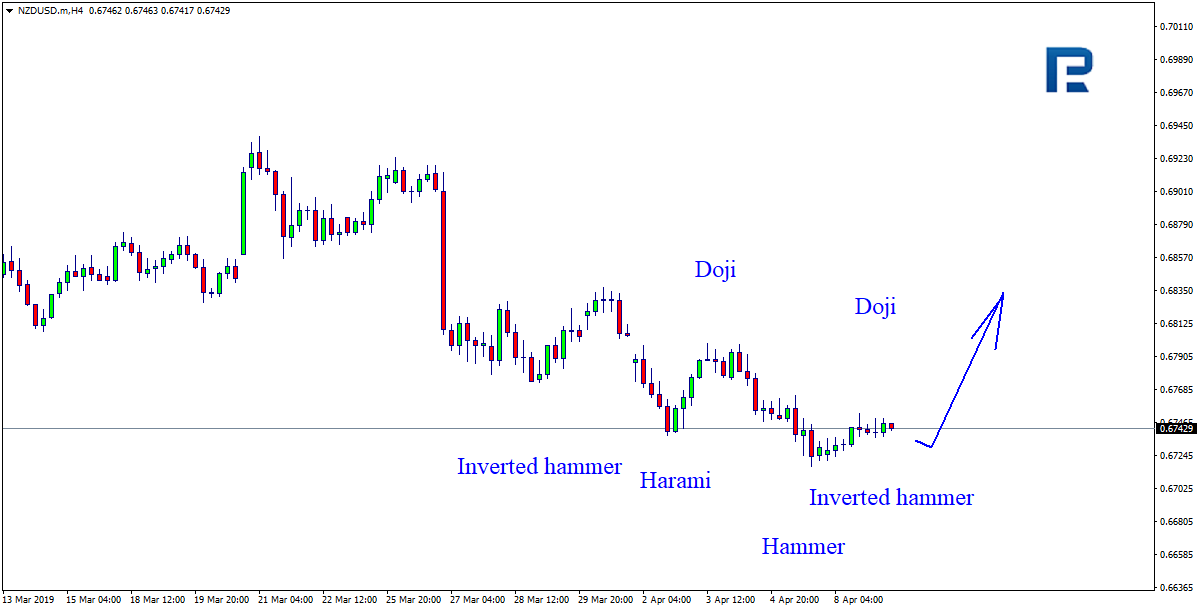
As we can see in the H4 chart, XAUUSD is still trading close to the support level and forming Hammer, Inverted Hammer, Harami, and Doji reversal patterns. Judging by the previous movements, it may be assumed that after testing the level the instrument may continue its ascending movement.
NZDUSD, “New Zealand vs. US Dollar”
As we can see in the H4 chart, NZDUSD is still testing the support level and forming Hammer, Inverted Hammer, and Doji reversal patterns. Judging by the previous movements, it may be assumed that after testing the level the instrument may continue its growth.
Attention! Forecasts presented in this section only reflect the author’s private opinion and should not be considered as guidance for trading. RoboForex LP bears no responsibility for trading results based on trading recommendations described in these analytical reviews.
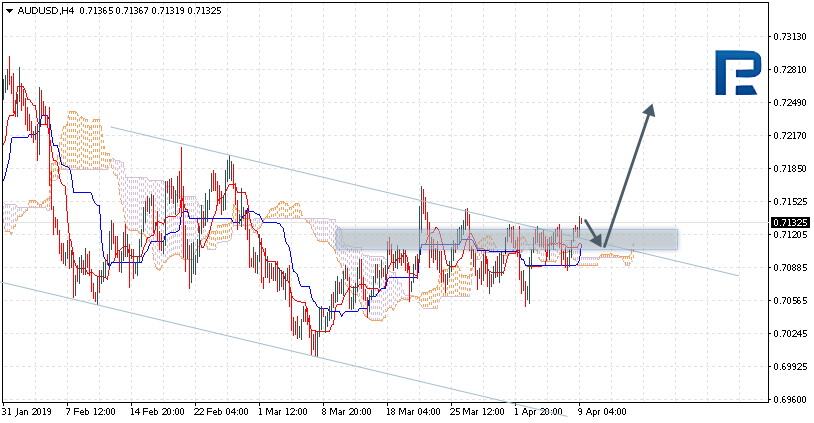
AUDUSD is trading at 0.7132; the instrument is moving above Ichimoku Cloud, thus indicating an ascending tendency. The markets could indicate that the price may test the upside border of the cloud at 0.7110 and then resume moving upwards to reach 0.7250. Another signal to confirm further ascending movement is the price’s rebounding from the channel’s upside border. However, the scenario that implies further growth may be cancelled if the price breaks the downside border of the cloud and fixes below 0.7075. In this case, the pair may continue falling towards 0.6975.
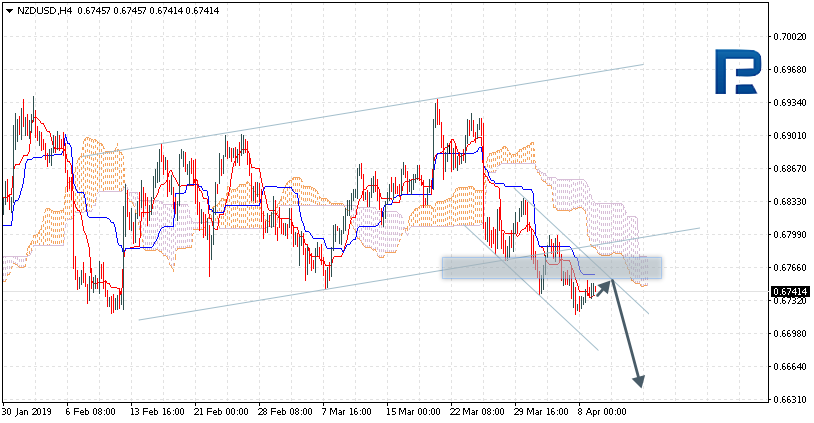
NZDUSD, “New Zealand Dollar vs US Dollar”
NZDUSD is trading at 0.6741; the instrument is moving below Ichimoku Cloud, thus indicating a descending tendency. The markets could indicate that the price may test Tenkan-Sen and Kijun-Sen at 0.6755 and then resume moving downwards to reach 0.6635. Another signal to confirm further descending movement is the price’s rebounding from the channel’s upside border. However, the scenario that implies further decline may be cancelled if the price breaks the upside border of the cloud and fixes above 0.6835. In this case, the pair may continue growing towards 0.6920.
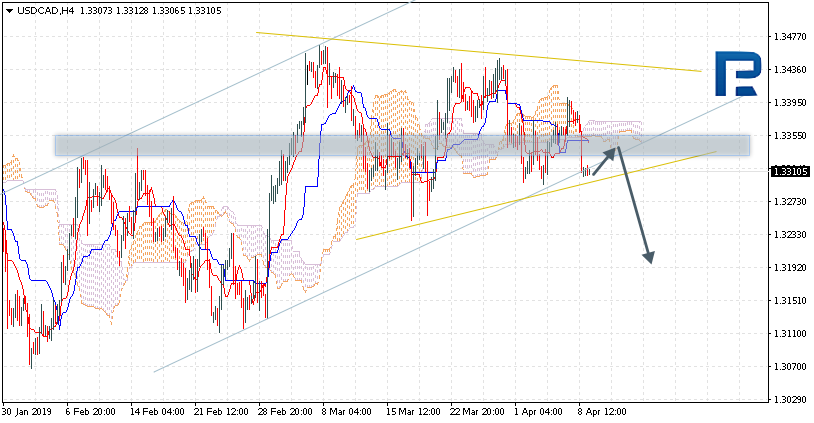
USDCAD, “US Dollar vs Canadian Dollar”
USDCAD is trading at 1.3310; the instrument is moving below Ichimoku Cloud, thus indicating a descending tendency. The markets could indicate that the price may test the downside border of the cloud at 1.3345 and then resume moving downwards to reach 1.3195. Another signal to confirm further descending movement is the price’s rebounding from the resistance level. However, the scenario that implies further decline may be cancelled if the price breaks the upside border of the cloud and fixes above 1.3395. In this case, the pair may continue growing towards 1.3495. After breaking the Triangle’s downside border and fixing below 1.3270, the price may continue moving downwards.
Attention! Forecasts presented in this section only reflect the author’s private opinion and should not be considered as guidance for trading. RoboForex LP bears no responsibility for trading results based on trading recommendations described in these analytical reviews.
EUR\USD started to grow. Yesterday the quotes increased by 50 points and updated the local maximums. This is mostly caused by technical factors as the investors begin to fix their positions before the European Central Bank meeting and the EU summit. Right now the quotes are consolidating around 1.12500-1.12750, with a tendency for further growth. You should open positions from the key levels and track the relevant information regarding the US\China negotiations.
The price fixed above 50 MA and 200 MA which points to the power of the buyers.
The MACD histogram is in the positive zone but below the signal line which gives a weak signal to buy EUR\USD.
The Stochastic Oscillator is in the neutral zone, the %K line is below the %D line which points to the bearish mood.
Trading recommendations
Support levels: 1.12500, 1.12300, 1.12100
Resistance levels: 1.12750, 1.13000
If the price fixes at 1.12750, expect the quotes to recover toward 1.13000-1.13250.
Alternatively, the quotes can recover toward 1.12300-1.12200.
The GBP/USD currency pair
Technical indicators of the currency pair:
Prev Open: 1.30350
Open: 1.30560
% chg. over the last day: +0.18
Day’s range: 1.30490 – 1.30950
52 wk range: 1.2438 – 1.4378
GBP\USD stabilized next to the 1.31000 mark. The technical picture is ambiguous. Investors are waiting before the EU summit. On Wednesday, April 10, the EU will make a final decision regarding the Brexit delay, which is currently set to Friday. Keep an eye on this issue and open positions from the key levels of 1.30550 and 1.31000.
The Economic News Feed for 09.04.2019 is calm.
The indicators do not provide any signals, the price has crossed 50 MA and 200 MA.
The MACD histogram is in the positive zone which points to the bullish mood.
The Stochastic Oscillator started to leave the overbought zone, the %K line is below the %D line which points to the bearish mood.
Trading recommendations
Support levels: 1.30550, 1.30150, 1.29850
Resistance levels: 1.31000, 1.31350, 1.31900
If the quotes fix above 1.31000, expect further fall toward 1.31350-1.31500.
Alternatively, the quotes can grow toward 1.30200-1.30000.
This article reflects a personal opinion and should not be interpreted as an investment advice, and/or offer, and/or a persistent request for carrying out financial transactions, and/or a guarantee, and/or a forecast of future events.
Aggressive sales were observed on the USD/CAD yesterday. The quotes fell by 70 points. Trading instrument updated the key minimums. The demand for commodity currencies is supported against the background of positive dynamics of oil prices. At the moment, USD/CAD is testing the 1.33000. 1.33250 is the nearest resistance. The USD/CAD currency pair has the prospects to decline further. You should open positions from key levels.
The newsfeed is calm for today.
The price fixed below 50 MA and 200 MA, which points to the power of the sellers.
The MACD histogram is in the negative zone but above the signal line which gives a weak signal to buy USD\CAD
The Stochastic Oscillator is in the neutral zone, the %K line is crossing the %D line. There are no signals at the moment.
Trading recommendations
Support levels: 1.33000, 1.32500
Resistance levels: 1.33250, 1.33500, 1.33700
If the price fixes below 1.33000, the price is expected to fall toward 1.32600-1.32400.
Alternatively, the quotes can grow toward 1.33500-1.33700.
The USD/JPY currency pair
Technical indicators of the currency pair:
Prev Open: 111.666
Open: 111.457
% chg. over the last day: -0.23
Day’s range: 111.279 – 111.579
52 wk range: 104.56 – 114.56
USD/JPY is moving sideways. There is no single defined trend. Right now the quotes are testing the 111.300-111.150 demand zone. The resistance is at 111.550. A technical correction is possible soon. Keep an eye on the US Treasury bonds’ yield and open the positions from the key levels.
The Economic News Feed for 09.04.2019 is calm.
The indicators do not provide precise signals, the price fixed between 50 MA and 200 MA.
The MACD histogram is in the negative zone and below the signal line which gives a strong signal to buy USD/JPY.
The Stochastic Oscillator is in the neutral zone, the %K line is above the %D line which points to the bullish mood.
Trading recommendations
Support levels: 111.300, 111.150, 110.850
Resistance levels: 111.550, 111.800, 112.000
If the price fixes above 111.300, expect further growth toward 111.000-110.800.
Alternatively, the quotes can fall toward 111.700-112.000.
The recent recovery in Crude Oil has, partially, been based on increasing expectations of a global economic recovery taking place and the continued news that the US/China will work out a trade deal. Crude inventories. Just last week US Crude Oil inventories came in at +7.2 million barrels vs. expectations of -425,000 barrels (). Additionally, concerns in Syria and Libya are pushing prices a bit higher as well. Whenever there are supply concerns or uncertainty out of this region, prices tend to rise.
The facts remain very dynamic for Oil. The US is continuing to produce more and more oil and is expected to become a “net exporter” of oil this year. Economic issues will, eventually, resolve themselves, yet we don’t know the final outcome of these trade deals or how the economy will react to any milestones that are required within the final settlement. And, again, these continuing issues in Libya, Syria and near this region are likely to cause some increased levels of uncertainty over the next 60+ days.
Our researchers, at TheTechnicalTraders.com, believe the $65.00 level will act as resistance to this current upswing. We believe the upside price move may continue to levels near $67.50 before weakening and beginning a topping formation. We believe our expectation that precious metals will bottom near April 21~24 is key to understanding the dynamics of this move in Oil. As long as FEAR does not enter the market, then Oil will likely react to impulse factors exclusively related to Oil. Once Gold breaks out above $1500 per ounce, our belief is that Oil will react to fear factors related to some broader economic event driving investors into precious metals.
Therefore, we are urging traders to be cautious of the upside price swing in Oil at the moment. Yes, we believe the upside will continue for at least another 10~15 days (possibly changing direction near April 21~24). Yes, we believe current global dynamics support moderately higher Oil prices. Yet, we feel these factors may change within the next 20~45 days as we believe some increased fear levels are about to hit the global markets.
At this point, we would urge Bullish Oil traders to start to become more cautious of any downside risks and begin to prepare for increased volatility. We don’t have any real clue as to how this move will setup, but we do believe our other research support increased volatility within the Crude Oil markets and the potential for a new downside price swing before any further upside move sets up.
Please take a minute to review this research post from January 31, 2019: Learning From our SP500, Gold and Oil Research & Profit.
We’ve recently launched a new technology solution for our members that delivers our incredible research and trading solutions. You can also visit TheTechnicalTraders.com to learn more about our research team and past article. 20129 is going to continue to be an incredible year for skilled traders – you won’t want to miss these big moves that are setting up.
The US dollar weakened against a basket of major currencies amid fears of the economic slowdown. Yesterday, the Ministry of Commerce reported that orders for manufactured goods fell by 0.5%, as experts expected, amid weak orders for cars, transportation equipment, computers and electronic products. The US currency also weakened due to the strengthening of its main competitors. The single currency added more than 50 pips in price. Technical factors mostly caused this movement. Participants in financial markets began to fix positions before the ECB meeting and the EU summit. The positive dynamics of oil prices supports the demand for commodity currencies. The dollar index (#DX) closed in the negative zone (-0.36%).
The situation around Brexit is running high again. There are only a few days left until the UK leaves the EU. It should be recalled that Brexit was to be held on March 29, then it was moved to April 12. However, today, the British Prime Minister, Theresa May, intends to meet with German Chancellor, Angela Merkel, and French President, Emmanuel Macron, to ask Brexit to be postponed. On Wednesday, April 10, the EU summit will take place, at which the leaders of the bloc will decide on the Brexit delay. If the exit date is not extended, then the UK is more likely to leave the unit without an agreement.
Prices for “black gold” continue to rise. At the moment, futures for the WTI crude oil are consolidating near yearly highs ($64.50/barrel). At 23:30 (GMT+3:00) a report on weekly crude oil stocks according to the American Petroleum Institute will be published.
Market Indicators
Yesterday, in the US stock market, multidirectional dynamics was observed: #SPY (+0.08%), #DIA (-0.36%), #QQQ (+0.25%).
The yield on 10-year US government bonds has updated local highs. Currently, the indicator is at the level of 2.51-2.52%.
The news feed for 2019.04.09:
– the number of open jobs in the JOLTS labour market in the United States at 17:00 (GMT+3:00).
On Monday the 8th of April, trading on the euro closed up. The bulls initially broke through the resistance at 1.1240 with some help from the crosses. In the US session, this rise gathered pace to reach 1.1274. Traders are now waiting for a trade deal between China and the US to be finalised, as well as for results on a Brexit vote. The worst case scenarios have already been factored into the price. Long positions on the dollar are being closed ahead of the publication of the FOMC minutes for their March meeting.
Day’s news (GMT+3):
17:00 US: JOLTS job openings (Feb).
23:30 US: API weekly crude oil stock (5 Apr).
Current situation:
Bulls have broken through the resistance zone of 1.1250 – 1.1254 on the back of a weak dollar. The euro is currently trading at 1.1270 against the greenback. The bulls are trying to press forward, but with all the euro crosses trading down except for EURCHF, the single currency is under pressure.
There are two important events planned for Wednesday: the ECB meeting and subsequent press conference with Mario Draghi, and the publication of the FOMC minutes from March. If we add some new Brexit headlines to the mix, it will be a very volatile trading day.
The economic calendar is empty today, so today I’m expecting a retest of yesterday’s resistance as a support. The price is approaching the support from above and there is nothing stopping the bulls from shifting it up along the upwards channel.
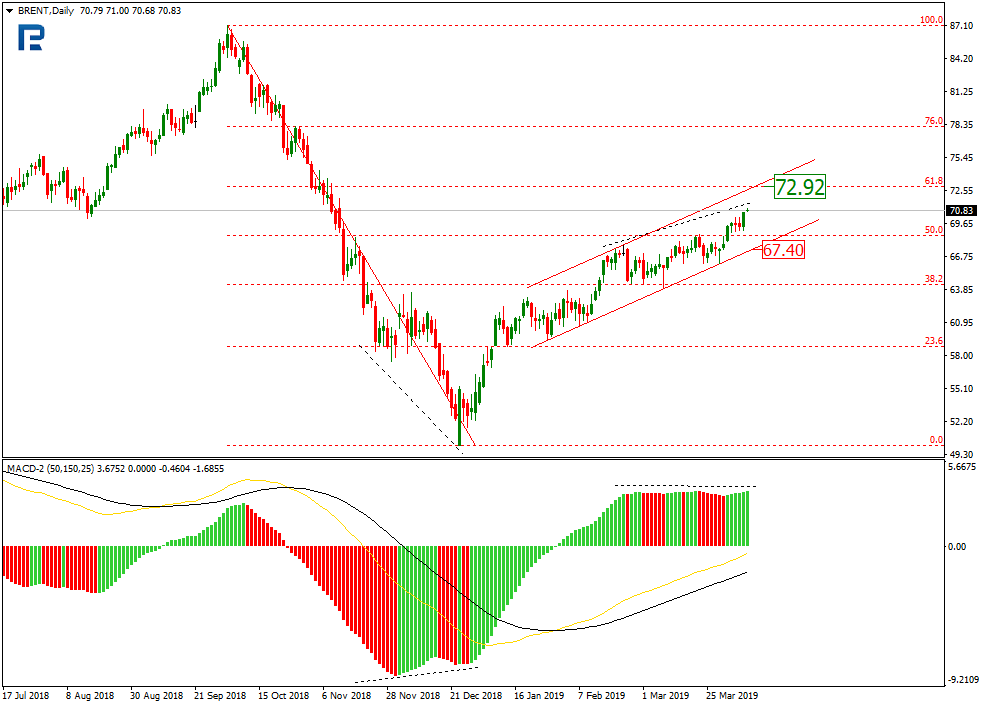
Early in the second week of April, the oil market is on the rise. Brent has broken the psychologically-crucial level of $70 and is trading a little bit above it on Monday, April 8th. Investors continue pushing oil prices upwards with news from Libya, where the conflict escalated, being the key trigger.
At the same time, market players didn’t pay attention to readings from Baker Hughes, which were quite bearish this time: the number of rigs in the USA added 19 units over the week, including 15 oil ones.
It’s clear why the Libya factor is decisive for the oil market right now. First of all, no one can really say if the current conflict may escalate and turn into a real Middle Eastern “fire”. If this scenario comes true, oil prices might continue growing for a long time, because it implies that investors consider possible pipeline damages and disruptions of oil supplies as a very high risk. Secondly, such drivers provide traders with an opportunity to make money and all of them are trying to “catch this train”.
However, of course there is a chance that in a couple of days this Libyan news won’t get any continuation and be interesting for the oil market, thus allowing Brent to start a correction.
The oil market situation should be analyzed using the daily chart. The current uptrend should be considered as a correction of the previous downtrend. This ascending movement has already broken 50.0% fibo and is heading towards 61.8% fibo at 72.92. Technically, the rising channel is looking steadily, but there is a divergence on MACD, which indicates a possible reverse soon. The support level is at 67.40. If the price breaks this level, the instrument may start a new decline.
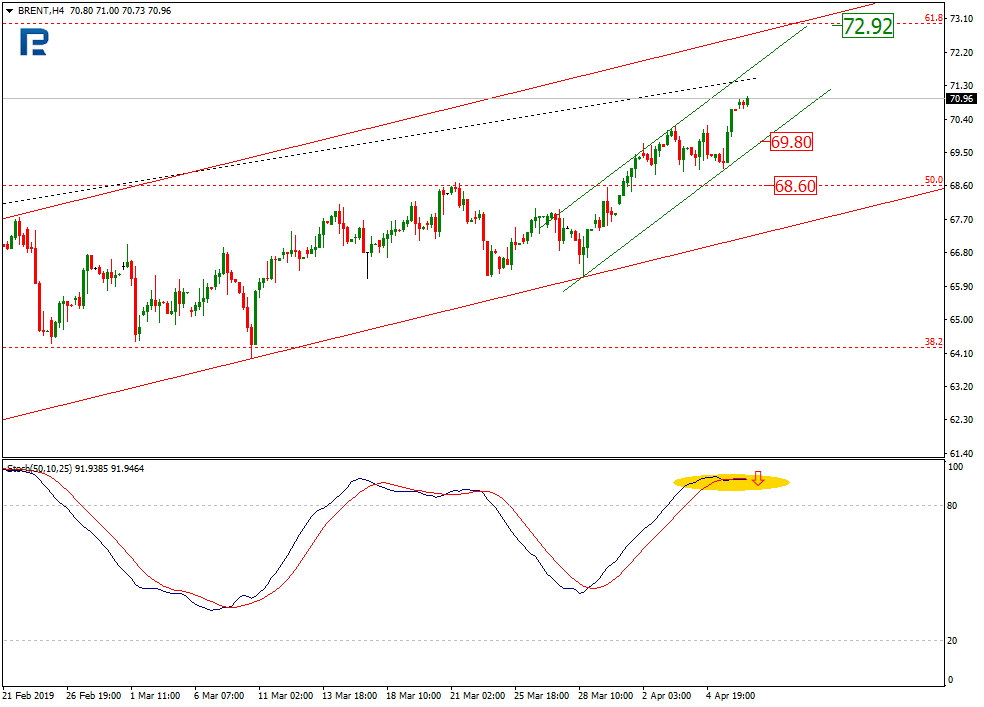
In the H4 chart, Brent is forming an ascending impulse towards the key resistance line. At the same time, there is a black cross inside the “overbought zone” on Stochastic, which may indicate a short-term pullback soon. The first downside correctional target will be the support line at 69.80, while the key one is at 68.60.
Disclaimer
Any predictions contained herein are based on the authors’ particular opinion. This analysis shall not be treated as trading advice. RoboForex shall not be held liable for the results of the trades arising from relying upon trading recommendations and reviews contained herein.
 Current situation: