Yesterday, the US dollar slightly strengthened against a basket of major currencies. The dollar index (#DX) closed the trading session in the positive zone (+0.17%). The euro was under pressure after statements by the ECB representatives. Some politicians believe that the current economic forecasts of the Central Bank are too optimistic. At the moment, financial market participants have taken a wait-and-see attitude before the publication of important economic releases. The Fed’s Beige Book, which will help investors to assess the state of the economic situation in each of the 12 federal districts of the United States, will be published today. We also expect data on the US trade balance.
The British pound ignored fairly positive statistics on the UK labor market. Thus, average earnings including bonuses increased by 3.5% in February, as experts expected. The unemployment rate remained unchanged at 3.9%. The number of new jobs increased by 179.0K, which is higher than the forecasted value of 173.0K. At the same time, jobless claims counted to 28.3K in March instead of the expected value of 20.0K. The British pound was under pressure after the Guardian reported that negotiations between Theresa May and the opposition Labour Party regarding Brexit came to the deadlock. The Labour Party denied this information.
Today, during the Asian trading session, weak economic data from New Zealand have been published. Thus, the consumer price index (q/q) rose by only 0.1% in the first quarter, while experts expected growth by 0.3%. Optimistic data were also published in China. GDP (y/y) grew by 6.4% in the first quarter instead of 6.3%. Industrial production also increased by 8.5% in March, although experts forecasted growth by 5.6%. Today, we expect important economic statistics from the UK, the Eurozone and Canada.
The “black gold” prices have been growing again and reached annual highs. At the moment, futures for the WTI crude oil are testing the mark of $64.50 per barrel. At 17:30 (GMT+3:00), a report on crude oil inventories will be published in the US.
Market Indicators
Yesterday, the bullish sentiment was observed in the US stock market: #SPY (+0.07%), #DIA (+0.27%), #QQQ (+0.34%).
The 10-year US government bonds yield has been growing. Currently, the figure is at the level of 2.59-2.61%.
The news feed for 2019.04.17:
– Consumer price index in the UK at 11:30 (GMT+3:00); – Data on inflation in the Eurozone at 12:00 (GMT+3:00); – Data on inflation in Canada at 15:30 (GMT+3:00); – Fed’s “Beige Book” at 21:00 (GMT+3:00).
We also recommend paying attention to the speech by the Governor of the Bank of England.
A very interesting price pattern is setting up in the financial sector that could lead to a very big move in the US & Global markets. Remember how in 2008-09, the Financial sector and Insurance sector were some of the biggest hit stock sectors to prompt a global market crisis? Well, the next few weeks and months for the financial sector are setting up to be critical for our future expectations of the US stock market and global economy.
Right now, many of the financial sector stocks are poised near an upper price channel that must be breached/broken before any further upside price advance can take place. The current trend has been bullish as prices have rallied off the December 2018 lows. Yet, we are acutely aware of the bigger price channels that could become critical to our future decision making. If there is any price weakness near these upper price channel levels and any downside price rotation, the downside potential for the price is massive and could lead to bigger concerns.
Let’s start off by taking a look at these Monthly charts…
This first Monthly Bank Of America chart is best at showing the price channel (in YELLOW) as well as a key Fibonacci price level (highlighted by the MAGENTA line). We’ve also highlighted a price zone with a green shaded box that we believe is key support/resistance for the current price trend.
As you can see from this chart, since early February 2018, the overall trend has shifted into a sideways bearish trend. The price recovery from December 2018 was impressive, yes, but it is still rotating within this sideways/bearish price channel. Our belief is that this YELLOW upper price channel level MUST be broken in order for the price to continue higher at this point. Any failure to accomplish this will result in a price reversal that could precipitate a 30% price decline in the value of BAC. In other words, “it is do-or-die time – again”.
This Monthly JPM chart shows a similar pattern, yet the price channel is a bit more narrow visually. We have almost the same setup in JPM as we do in BAC. The same channels, the same type of Fibonacci price support level, the same type of sideways price support zone (the shaded box) and the same overall setup. As traders, we have to watch for these types of setup and be aware of the risks that could unfold with a collapse of the financial sector over the next few weeks.
We believe the next few weeks could be critical for the financial sector and for the overall markets. If weakness hits the financial sector as global growth continues to stagnate we could enter a period where the global perception of the future 12~24 months may change. Right now, perception has been relatively optimistic in the global stock markets. Most traders have been optimistic that the markets will recover and a US/China trade deal will get settled. The biggest concern has been the EU and the growth of the European countries.
What if that suddenly changed?
We are not saying it will or that we know anything special about this setup. We are just suggesting that the Monthly charts, above, are suggesting that price will either break above this upper price channel or fail to break this level and move lower. We are suggesting that, as skilled traders, we need to be acutely aware of the risks within the financial sector right now and prepare for either outcome.
This last chart, a Weekly FAS chart, shows a more detailed view of this same price rotation and sideways expanding wedge/channel formation. Pay very close attention to the shaded support channel shown with the GREEN BOX on this chart. Any price rotation within this level should be considered “within a support channel” and not a real risk initially. We want to see price break above the upper price channel fairly quickly, within the next 2 to 5+ weeks, and we can to see it establish a new high (above $78 on this chart) to confirm a new bullish price trend. Once this happens, we’ll be watching for further price rotation and setups. If it fails to happen, then the RED DOWN ARROW is the most likely outcome given the current price setup.
Any downside price move in the Financial sector would have to be associated with some decreased future expectations by investors. Thus, our bigger concern is that something is lurking just below the surface right now that could pull the floor out from under this sector. Is it a surprise Fed rate increase? Is it some news from the EU? Is it a sudden increase in credit defaults? What is the “other shoe” – so to say.
Be prepared. If all goes well, then we’ll know within a few more weeks if the upside price rally will continue or if we need to start digging for clues as to why the support for the financial sector is eroding. This really is a “do or die” setup in the financial sector and we urge all traders to pay very close attention to this sector going forward. We believe it will be the leading sector for any major price weakness across the global markets.
Do you want to find a team of dedicated researchers and traders that can help you find and execute better trades in 2019 and beyond? Please visit TheTechnicalTraders.com to learn how we can help you prepare for the big moves in the global markets and find better opportunities for greater success in the future. Our team of researchers and traders continue to scan the markets for new trades and incredible research for all our members and followers.
On Tuesday the 16th of April, trading on the euro closed down. The EURUSD pair was knocked off its perch of 1.1314 by Reuters, which reported that ECB policymakers doubt the bank’s projected economic growth figures for the second half of 2019, saying that they’re too optimistic. Within two hours, the pair had returned to the 1.1314 resistance, but failed to remain there. Trading on the euro closed in the lower half of the intraday range.
Day’s news (GMT+3):
11:00 Eurozone: current account (Feb).
11:30 UK: CPI (Mar), retail price index (Mar), PPI – input (Mar), PPI – output (Mar).
Headlines in the media caused some fluctuations yesterday, but it’s clear that they did little to change market sentiment as a whole. The EURUSD pair has again returned to 1.1314 on the back of strong Chinese GDP and industrial production data.
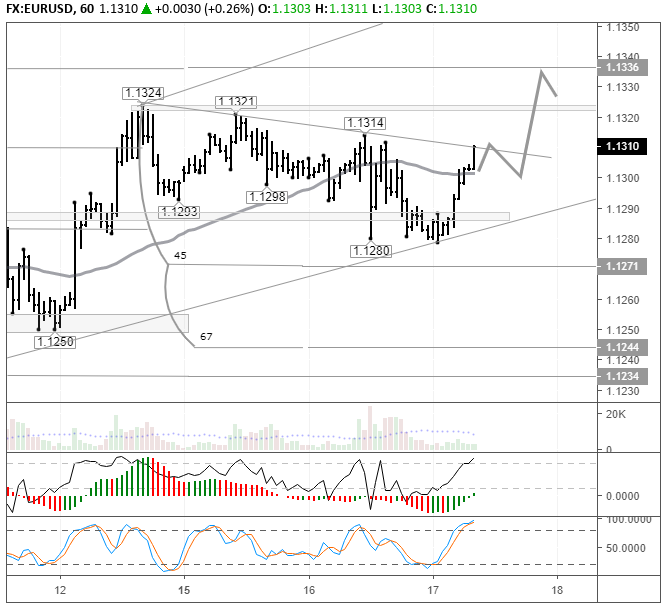
After a short period of consolidation, I expect this morning’s rally to continue to the 90th degree at 1.1336. Look at the pair’s movements from the 10th to 12th of April. The market is currently behaving in a similar way.
With the Easter holidays approaching, along with the long weekend, trader and investor activity is set to decline. Many traders will close their positions ahead of the long weekend, which will likely lead to high market volatility.
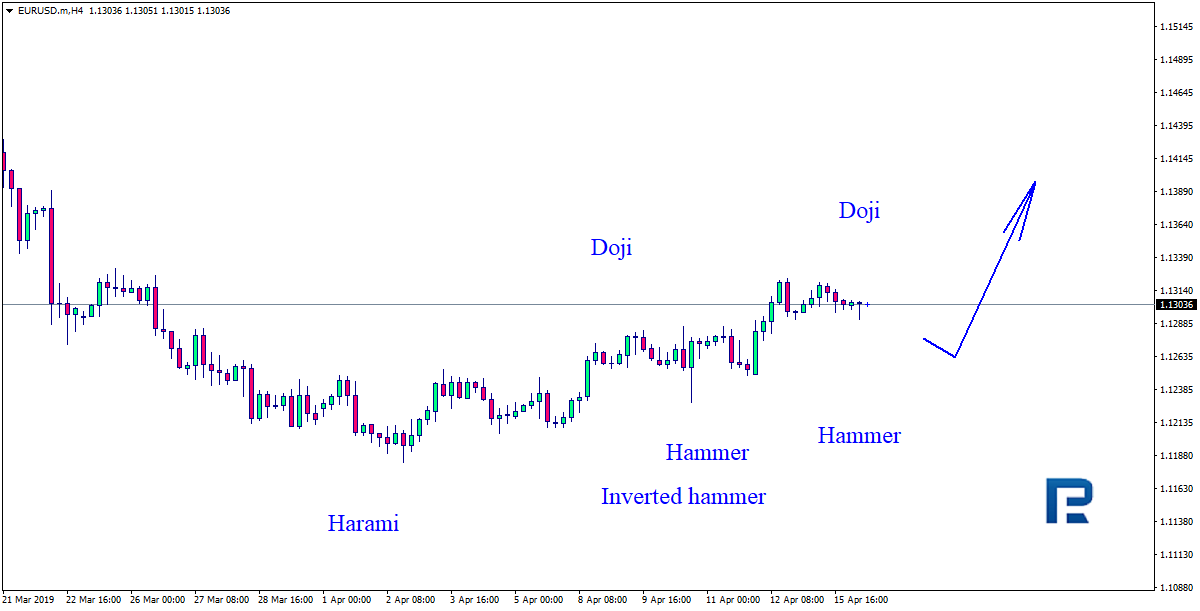
As we can see in the H4 chart, EURUSD is still trading close to the support level and forming Hammer, Doji, and Inverted Hammer reversal patterns. Judging by the previous movements, at the moment it may be assumed that after finishing its sideways movement and testing the level, the instrument may resume moving to the upside.
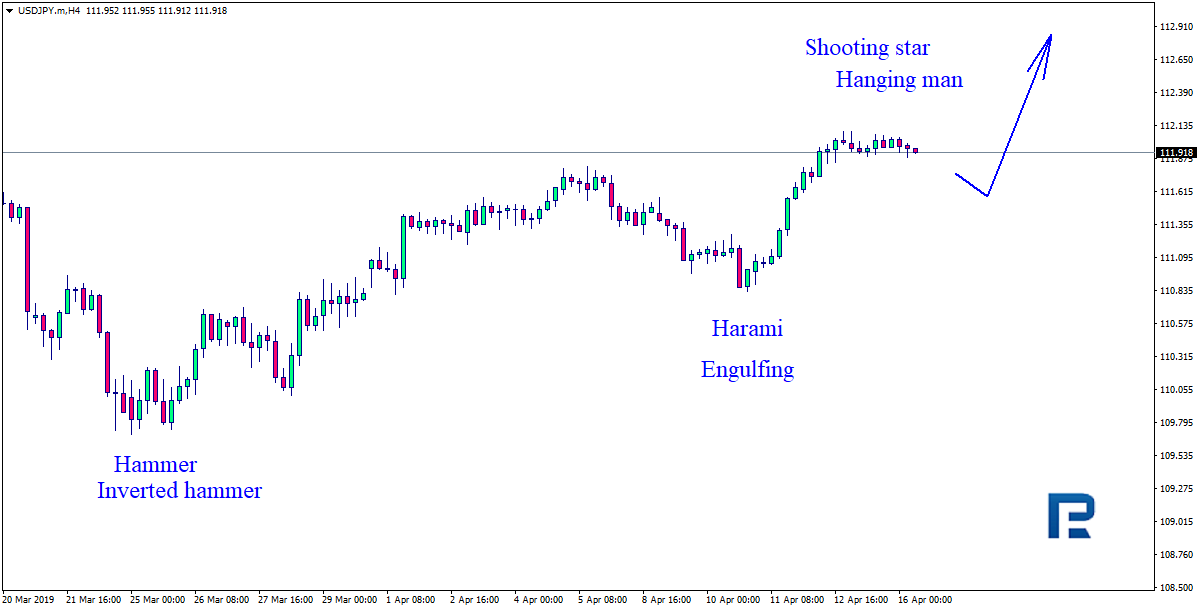
USDJPY, “US Dollar vs. Japanese Yen”
As we can see in the H4 chart, USDJPY is still trading close to the resistance level and forming Shooting Star and Hanging Man reversal patterns. Judging by the previous movements, at the moment it may be assumed that after completing the correction the instrument may continue its ascending tendency.
Attention! Forecasts presented in this section only reflect the author’s private opinion and should not be considered as guidance for trading. RoboForex LP bears no responsibility for trading results based on trading recommendations described in these analytical reviews.
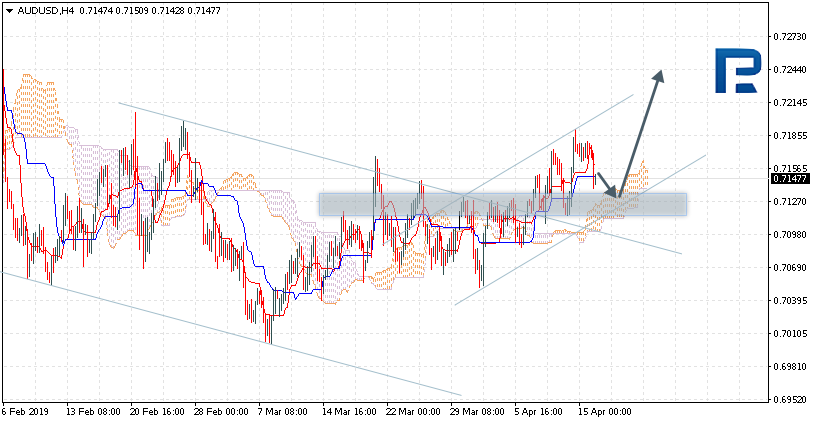
AUDUSD is trading at 0.7147; the instrument is moving above Ichimoku Cloud, thus indicating an ascending tendency. The markets could indicate that the price may test the upside border of the cloud at 0.7130 and then resume moving upwards to reach 0.7245. Another signal to confirm further ascending movement is the price’s rebounding from the channel’s downside border. However, the scenario that implies further growth may be cancelled if the price breaks the downside border of the cloud and fixes below 0.7090. In this case, the pair may continue falling towards 0.7015.
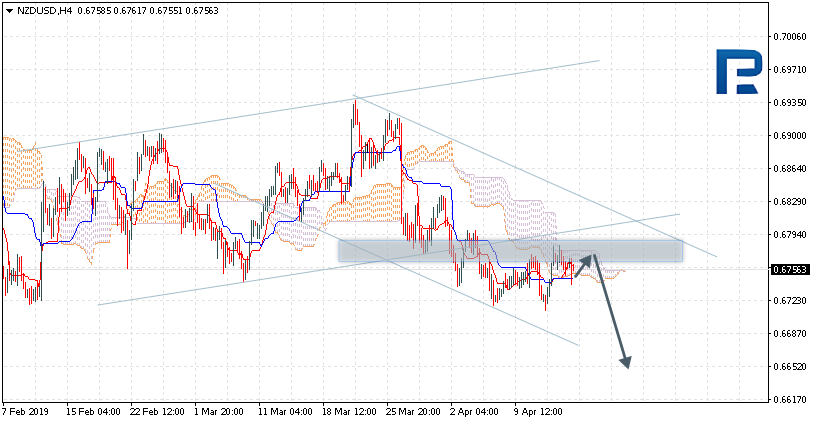
NZDUSD, “New Zealand Dollar vs US Dollar”
NZDUSD is trading at 0.6756; the instrument is moving inside Ichimoku Cloud, thus indicating a sideways tendency. The markets could indicate that the price may test the upside border of the cloud at 0.6765 and then resume moving downwards to reach 0.6655. Another signal to confirm further descending movement is the price’s rebounding from the resistance level. However, the scenario that implies further decline may be cancelled if the price breaks the upside border of the cloud and fixes above 0.6805. In this case, the pair may continue growing towards 0.6900.
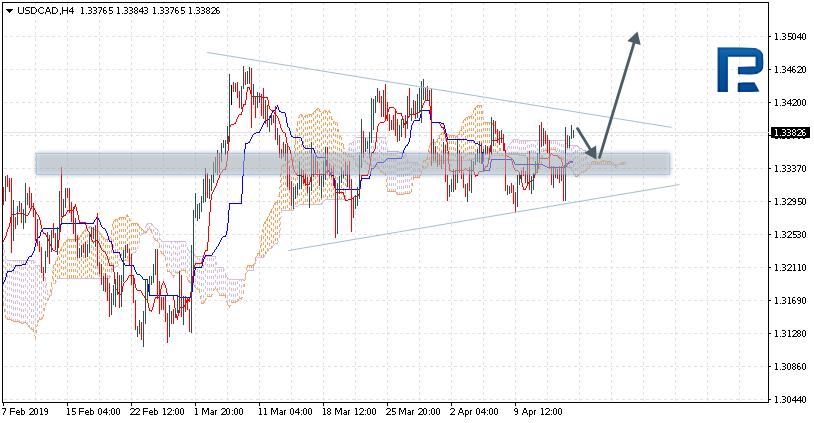
USDCAD, “US Dollar vs Canadian Dollar”
USDCAD is trading at 1.3382; the instrument is moving above Ichimoku Cloud, thus indicating an ascending tendency. The markets could indicate that the price may test the upside border of the cloud at 1.3355 and then resume moving upwards to reach 1.3505. Another signal to confirm further ascending movement is the price’s rebounding from the support level. However, the scenario that implies further growth may be cancelled if the price breaks the downside border of the cloud and fixes below 1.3315. In this case, the pair may continue falling towards 1.3215. After breaking the upside border of the Triangle pattern and fixing above 1.3420, the price may continue moving upwards.
Attention! Forecasts presented in this section only reflect the author’s private opinion and should not be considered as guidance for trading. RoboForex LP bears no responsibility for trading results based on trading recommendations described in these analytical reviews.
Recently, IMF cut global growth forecasts. As US-Sino trade talks will give way to next trade wars, new tariff wars will not resolve US deficits but will further impair global economic prospects.
Ever since the US-Sino trade talks began almost four months ago, the United States has pushed for a broad commitment focusing on China’s economic practices, including participation of U.S. firms in certain industries and protection of U.S. intellectual property rights (IPRs).
In a recent CNBC interview, Treasury Secretary Steven Mnuchin claimed that the countries had “pretty much agreed” on an enforcement mechanism for a trade deal. After his meeting with the Chinese delegation last week, President Trump stated that negotiators may need four more weeks to package the deal.
But the enthusiasm may prove premature.
The state of US-Sino trade talks
As the last globalist in the Trump administration, Mnuchin’s views carry some weight, but he lacks clout to enforce those views. That’s been the case since Gary Cohn, Mnuchin’s former Goldman Sachs colleague, resigned from the White House ahead of the tariff wars. In turn, Commerce Secretary Wilbur Ross has proven too weak, reluctant and old (81 years) to press for compromise.
That’s why trade talks are led by Peter Navarro, Director of National Trade Council, and Robert Lighthizer, U.S. Trade Representative. The former is an advocate of trade mercantilism, who has a dark track record in China-bashing; the latter’s trade wars began against Japan in the Reagan administration.
In addition to enforcement mechanisms, the two are pressing for a pact that would allow US tariffs on Chinese goods to snap back in case of violations – but without permitting China to retaliate in response.
Understandably, Chinese negotiators consider such conditions unacceptable. Such conditionality has surprised even Craig Allen, President of US-China Business Council, who believes that Mnuchin may have been too optimistic about the deal, if it is burdened by a conditionality clause.
Indeed, US business groups tend to focus on commitments, including the proposed “enforcement offices.” They dislike negotiating tactics that needlessly prolong the talks and may undermine the progress achieved.
Chinese Vice-Premier Liu He has expressed greater caution by stressing that, by the end the proposed four weeks, the two countries may learn whether a trade deal could be reached. And even if a final deal is achieved, it will take another year or two to verify the structural changes associated with the pact.
Trade wars’ next targets
However, a US-China deal will not resolve US trade deficits, which have increased for half a century. The imbalances began in the postwar era after the recovery of the key EU economies – UK, Germany, France and Italy – and the subsequent rise of Japan. Toward the late 20th century, the deficits reflected the emergence of the four dragons; i.e., Taiwan, South Korea, Hong Kong and Singapore. China’s role in these deficits became prominent in the 2000s.
Today, the largest deficits prevail with China, US NAFTA partners (Mexico, Canada), key EU countries (Germany, Ireland, Italy), ASEAN (Vietnam, Malaysia) and India. China has been targeted first, but others will follow.
Last year, Mexico and Canada were pressured to a revised “US first” regional pact. Friction has been steadily rising with Japan and Germany. And Trump has pledged to extend the trade war to ASEAN – where the deficits are likely to climb if US companies begin to relocate.
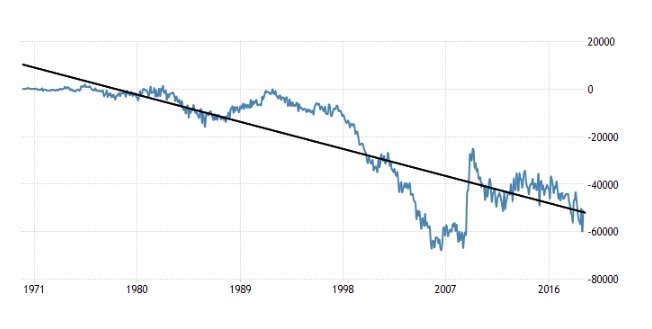
Despite half a century of promises to bring an end to deficits, US dependency on trade deficits has only deepened as Washington has become increasingly dependent on foreign financing and sovereign debt (which now exceeds $22.2 trillion, or 106% of US GDP). The net effect is a falling trend line (Figure).
Figure U.S. trade deficits have deepened for half a century (US$ Million)
Why tariff wars won’t resolve US deficits
Do the US tariff wars make economic sense? No. Here are some reasons why:
US deficit issue is multilateral and regional, not bilateral and national. Trying to resolve it by forcing the bilateral trade deficit down is a bit like mimicking the fictional story of the little Dutch boy who discovered a leak in the dyke and stuck his finger in it to save his country. That’s Trump’s strategy.
Unfortunately, it ignores the dyke’s many other leaks and may thus make the flood more likely.
Second, Trump’s trade hawks presume that international trade is a competition between companies representing different countries. They ignore the fact that, for decades – and particularly since the 1980s – national industry leaders have built multinational value activities around the world. Consequently – as even the OECD has concluded – conventional data on bilateral trade deficits can be misleading, due to multinationals’ global supply chains.
Third, it is the overall size of the trade balance that matters, and that is largely a function of macroeconomic forces, such as domestic savings and investment. If the US domestic investment continues to exceed savings, it will have to continue to import capital and will have a large trade deficit.
Since late 2017, the Trump administration has made this challenge much worse, thanks to large tax cuts, which have caused US fiscal deficits to soar. That is likely to cause the trade deficit to increase, irrespective the outcome of the trade war. Of course, one way to avoid this is that the White House will lead the US into a recession, with incomes declining adequately for investment and imports to plummet – as with the aftermath of the 2008 crisis (see the Figure).
Why tariff wars will weaken global prospects
Unfortunately, that path would further penalize American middle-class and working people, but it would also have even more severe implications internationally. It has potential to further derail global economic prospects (which would harm the very same US multinationals Trump claims to support).
As US tariff wars undermined the global recovery momentum in early 2018, the IMF now predicts that global economic activity is notably slowing. Global growth is projected to slow to 3.3% in 2019.
In the absence of more positive signals, the international environment is faltering toward a darker path.
About the Author:
Dr. Dan Steinbock is the founder of Difference Group and has served at the India, China and America Institute (US), Shanghai Institute for International Studies (China) and the EU Center (Singapore). For more, see http://www.differencegroup.net/
The commentary is based on Dr. Steinbock’s recent presentation on the state of US tariff wars and global prospects.
At the moment, the euro has become stable after the rally last week. A unidirectional trend is not observed. Investors have taken a wait-and-see attitude before important economic releases coming later this week. Local support and resistance levels are still 1.12900 and 1.13200, respectively. The EUR/USD quotes have the potential for further growth. Donald Trump сriticized the Fed again, which puts additional pressure on the US currency. We recommend opening positions from the key levels.
The News Feed on 16.04.2019:
– German ZEW economic sentiment index at 12:00 (GMT+3:00);
– Industrial production in the US at 16:15 (GMT+3:00).
Indicators do not send accurate signals: the price has crossed 50 MA.
The MACD histogram is near the 0 mark.
Stochastic Oscillator is in the overbought zone, the %K line is above the %D line, which gives a weak signal to buy EUR/USD.
Trading recommendations
Support levels: 1.12900, 1.12750, 1.12500
Resistance levels: 1.13200, 1.13500, 1.14000
If the price fixes above the level of 1.13200, further growth of the EUR/USD quotes is expected. The movement is tending to 1.13500-1.13800.
An alternative may be the decrease of the EUR/USD currency pair to 1.12700-1.12500.
The GBP/USD currency pair
Technical indicators of the currency pair:
Prev Open: 1.30722
Open: 1.30883
% chg. over the last day: +0.13
Day’s range: 1.30753 – 1.31015
52 wk range: 1.2438 – 1.4378
The British pound is being traded in a protracted flat. The technical pattern is ambiguous. Investors expect up-to-date information on the Brexit issue. On Monday British Foreign Secretary Jeremy Hunt said that negotiations between the government and the opposition Labour Party were proceeding progressively and constructively. Local support and resistance levels are still 1.30650 and 1.31000, respectively. Positions should be opened from these marks.
At 11:30 (GMT+3:00) a report on the labor market will be published in the UK.
Indicators do not send accurate signals: the price has crossed 50 MA and 200 MA.
The MACD histogram is located near the 0 mark. There are no signals at the moment.
Stochastic Oscillator is in the neutral zone, the %K line has crossed the %D line. There are no signals at the moment.
Trading recommendations
Support levels: 1.30650, 1.30350, 1.30000
Resistance levels: 1.31000, 1.31300, 1.31550
If the price fixes above the round level of 1.31000, the GBP/USD currency pair is expected to grow. The movement is tending to 1.31300-1.31500.
An alternative may be a drop in the GBP/USD quotes to 1.30400-1.30200.
This article reflects a personal opinion and should not be interpreted as an investment advice, and/or offer, and/or a persistent request for carrying out financial transactions, and/or a guarantee, and/or a forecast of future events.
Yesterday’s trading on the USD/CAD currency pair was very active. Aggressive purchases were observed in the trading instrument. The USD/CAD quotes have reached monthly highs. At the moment, Loonie is consolidating near the round level of 1.34000. The 1.33750 mark is the nearest support. We recommend paying attention to the dynamics of oil prices. Positions should be opened from the key levels.
Today, the news feed on the economy of Canada is rather calm.
Indicators indicate the power of buyers: the price has fixed above 200 MA.
The MACD histogram is in the positive zone and continues to rise, which indicates the bullish sentiment.
Stochastic Oscillator is in the neutral zone, the %K line has crossed the %D line. There are no signals at the moment.
Trading recommendations
Support levels: 1.33750, 1.33500, 1.33350
Resistance levels: 1.34000, 1.34500
If the price fixes above the round level of 1.34000, further growth of the USD/CAD quotes is expected. The movement is tending to 1.34400-1.34600.
An alternative may be the correction of the USD/CAD currency pair to 1.33600-1.33450.
The USD/JPY currency pair
Technical indicators of the currency pair:
Prev Open: 111.961
Open: 112.019
% chg. over the last day: +0.07
Day’s range: 111.853 – 112.045
52 wk range: 104.56 – 114.56
The USD/JPY currency pair has become stable near annual highs. At the moment, quotes are consolidating. Local support and resistance levels are 111.800 and 112.000, respectively. In the near future technical correction is not excluded. US President Donald Trump criticized the Fed’s policy again, which puts additional pressure on the US currency. We recommend opening positions from the key levels.
During the Asian trading session, weak data on economic activity in the services sector have been published in Japan.
Indicators do not send accurate signals: the price has fixed between 50 MA and 200 MA.
The MACD histogram is near the 0 mark.
Stochastic Oscillator is located near the oversold zone, the %K line is below the %D line, which gives a weak signal to sell USD/JPY.
Trading recommendations
Support levels: 111.800, 111.600, 111.450
Resistance levels: 112.000, 112.400, 112.600
If the price fixes above 112.100, further growth of the USD/JPY quotes is expected. The movement is tending to 112.500-112.700.
An alternative may be the correction of the USD/JPY currency pair to 111.600-111.450.
The US dollar shows multidirectional dynamics relative to the basket of major currencies. The pressure on the American currency is put by the statements of the US President regarding the Fed policy. So, Donald Trump believes that the US central bank slows down the economic growth of the country. He wrote in his Twitter: “If the Fed had done its job properly, which it has not, the Stock Market would have been up 5000 to 10,000 additional points, and GDP would have been well over 4% instead of 3%…with almost no inflation.” The dollar index (#DX) closed the trading session with a slight decrease (-0.04%).
The Australian dollar weakened after the publication of the minutes of the RBA’s monetary policy meeting. The regulator believes that lower interest rates would be “appropriate” if inflation remains low and the unemployment rate continues to rise. The British pound holds the mark of $1.31. British Prime Minister, Theresa May, announced that the country will prepare for a “tough” Brexit in October. However, the President of the European Council, Donald Tusk, urges not to hurry with hasty decisions, despite the fact that everyone is already exhausted because of the uncertainty around Brexit.
The “black gold” prices continue to fall. At the moment, the WTI crude oil futures are testing the mark of $63.20 per barrel. At 23:30 (GMT+3:00) a report on crude oil inventories according to the American Petroleum Institute will be published.
Market Indicators
Yesterday, multidirectional dynamics was observed on the US stock market: #SPY (-0.07%), #DIA (-0.10%), #QQQ (+ 0.02%).
The yield of 10-year US government bonds is at the level of 2.55-2.56%.
The news feed for 2019.04.16:
– Data on the labor market in the UK at 11:30 (GMT+3:00); – The ZEW economic sentiment index in Germany at 12:00 (GMT+3:00); – The industrial production volume in the United States at 16:15 (GMT+3:00).
On Monday the 15th of April, trading on the euro closed slightly down. The pair dropped to 1.1298, slipping further to 1.1293 in Tuesday’s Asian session. As I see it, this was a technical correction.
General negativity in the US session was caused by the Canadian dollar, which suffered a steep decline after the publication of the Bank of Canada’s business outlook survey for Q1. Following this report, the BoC is unlikely to raise interest rates in the coming meetings.
15:30 Canada: manufacturing shipments (Feb), Canadian portfolio investment in foreign securities (Feb), foreign portfolio investment in Canadian securities (Feb).
16:15 US: industrial production (Mar).
16:50 Eurozone: ECB’s Novotny speech.
17:00 US: NAHB housing market index (Apr).
21:00 US: Fed’s Kaplan speech.
23:30 US: API weekly crude oil stock.
Current situation:
The euro underwent a correction, but failed to reach 1.1285. This is a good sign for the bulls, as we could see the start of a new rally from the balance line. The hourly indicators have unloaded, so the bulls are preparing to revisit the 1.1324 high.
The pair is hovering around the 67th degree within the downwards channel. The channel is formed from three levels: 1.1324, 1.1293, and 1.1321. The support has shifted to 1.1292. The pair shouldn’t revisit 1.1290. If the Asian low is revisited, I’d advise holding off on opening any long positions. A sustained flat around the trend line and the 1.1282/90 range will lead to a subsequent drop to 1.1270.
The full Risk ON mode on the market continues. Safe haven assets, such as JPY and gold, are on the decline, and riskier assets (such as stocks and EM currencies) are heading north. In this environment, USD is pretty stable. Yes, the dollar is weaker on the EURUSD and AUDUSD pairs, but at the same time, USDJPY is making new mid-term highs. We can say that the DXY has not been very volatile recently and the price is yet to find a proper direction. Some of the instruments have already found one. In this piece, we will write about AUDUSD, where we can see a nice buy signal, which could be the start of a new long-term trend.
First, some fundamentals. AUD is climbing higher for a few reasons. First, we can mention recent hawkish comments from RBA officials. What is more, we had some nice trade balance data from China, which was not only promoting China itself but also their trading partners, including Australia, with AUD benefitting in particular. Another thing is the potential trade agreement between the US and China, which is looking very likely. As we can see from this, the fundamental support for the stronger AUD is pretty solid.
From a technical point of view, it looks even better. Last week, the price managed to break and defend the long-term downwards trend line, which has been connecting lower highs since the end of January 2018. At the same time, buyers broke the upper line of the mid-term symmetrical triangle and the horizontal resistance at 0.713. After the breakout, demand managed to defend those areas as supports, and from a technical point of view, that is a clear buy signal.
Positive sentiment will be denied if we drop below the orange support, which for now is not very likely to happen. Our first target is around 0.734, which gives us an opportunity for around 170 pips.