For the past two weeks, I’ve waiting for a proper sell signal on USDCHF. I’ve waited and waited, but we still don’t have one despite a really nice bearish setup. Yes, there is a difference between those two. There is a setup, but no signal. Let me explain that in a greater detail.
Both of these currencies are considered safe heavens. There’s a slight difference in that CHF is said to be a bit safer than USD. The market is currently in Risk ON mode, which means that traders are OK with riskier assets. That is why demand for CHF is really low and this currency is in defence mode, giving the green light for moderate gains on the USDCHF.
It looks much better for the bears from a technical point of view. First of all, the pair is trading beneath the neckline (black) of the big triple top formation. What’s more, we’re in a correction of the main mid-term trend that started at the beginning of March (after third top), and that trend is bearish. In addition to that, the correction is a flag (blue lines); a formation that promotes a breakout to the downside. Furthermore, most recently, the pair tested an important horizontal resistance (yellow) and two crucial Fibonacci levels (50% and 61.8%). This is quite a big accumulation of negative factors. There’s only one real reason that a sell signal hasn’t been triggered yet; we need to wait for a breakout of the lower line of the flag. Why? Cause that would trigger this formation but also would mean that all the resistances worked and that the price bounced from them.
At the moment, we can see something like a small irregular head and shoulders pattern (orange head bouncing from three resistances at once). This can be considered another negative factor in our basket. It does not change too much though. A legitimate sell signal will only be triggered when the pair reaches the green cross, which would mean the end of the flag formation.
The Pound is growing against the USD early in another April week. Overall, the British currency looks pretty stable despite a great deal of news relating to the Brexit.
Last week, the United Kingdom agreed with the European Union on six more months for hammering out all details in the documents without the hustle and bustle and finally exiting the alliance. At first, London asked for a delay until June 30th, but the European Union, being sick and tired of all Brexit-related complications and hype, gave more time than the UK initially wanted.
At the same time, both parties agreed that any delay would have a solid reason to be reviewed and processed.
Despite more or less clear Brexit date, this topic remains rather controversial for global capital markets. Investors are afraid that all these delays (mostly due to British lords’ “holier-than-thou” attitude) may push the Brexit procedure in the direction that is completely different from where the British people wanted it in the first place.
Nevertheless, there is no guarantee that with six additional months the British Parliament will use them to find a perfect solution instead of rejecting new versions of the agreement with the European Union.
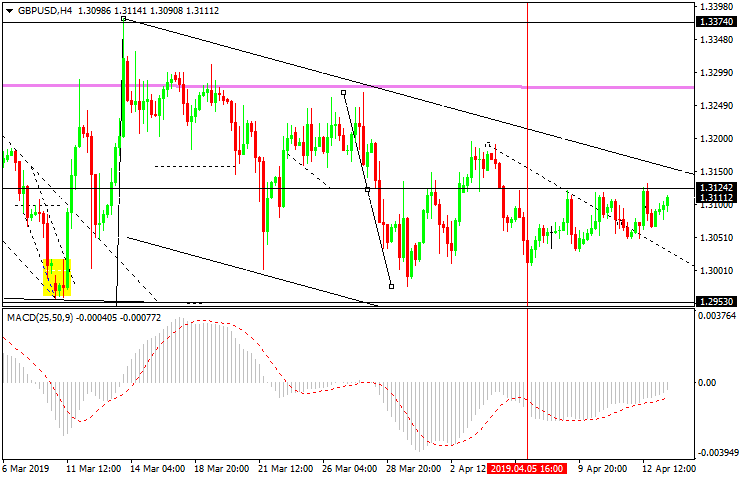
In the daily chart, the Pound is consolidating around 1.3125. Oscillator indicates that the downtrend may continue towards the downside border of the range at 1.2950. If later the price breaks this level, the pair may continue falling to reach 1.2750.
As we can see in the H4 chart, the price is moving sideways. There might be a divergence on MACD towards 1.2950.
Disclaimer
Any predictions contained herein are based on the authors’ particular opinion. This analysis shall not be treated as trading advice. RoboForex shall not be held liable for the results of the trades arising from relying upon trading recommendations and reviews contained herein.
After completing the correctional Flag pattern, EURUSD has formed another descending impulse along with the correction. Today, the pair may fall to break 1.1285 and then continue trading inside the downtrend with the short-term target at 1.1260.
GBPUSD, “Great Britain Pound vs US Dollar”
GBPUSD has completed the descending impulse along with the correction. Possibly, today the pair may form a new descending structure to break 1.3060 and then continue falling with the short-term target at 1.3014.
USDCHF, “US Dollar vs Swiss Franc”
USDCHF has finished the ascending impulse; right now, it is being corrected. After that, the instrument may form one more ascending structure with the first target at 1.0069.
USDJPY, “US Dollar vs Japanese Yen”
USDJPY has completed another ascending structure. Today, the pair may start a new decline to reach 111.58 and then resume growing towards 111.90, thus forming a new consolidation range. If later the price breaks range to the upside, the instrument may extend the structure towards 112.35; if to the downside – resume trading inside the downtrend with the first target at 110.80.
AUDUSD, “Australian Dollar vs US Dollar”
AUDUSD is trading upwards. Possibly, the pair may choose an alternative scenario and continue the correction towards 0.7199. Today, the pair may form a new descending structure to reach 0.7135 and then start another growth with the target at 0.7170.
USDRUB, “US Dollar vs Russian Ruble”
USDRUB is consolidating around 64.30. Today, the pair may fall to reach 63.98 and then form one more ascending structure to return to 64.30. Later, the market may resume trading inside the downtrend to break 63.90.
XAUUSD, “Gold vs US Dollar”
Gold is consolidating around 1291.88. Possibly, the pair may expand the range towards 1298.90 and then start a new decline to reach 1285.35. After that, the instrument may break the range to the downside and resume trading downwards with the short-term target at 1260.00.
BRENT
Brent is consolidating around 71.00. Possibly, the pair may break 71.70 to the upside and resume trading inside the uptrend to reach 72.80. However, if this range is broken downwards, the market may be corrected towards 70.40 and then form one more ascending structure towards 73.15.
Attention! Forecasts presented in this section only reflect the author’s private opinion and should not be considered as guidance for trading. RoboForex LP bears no responsibility for trading results based on trading recommendations described in these analytical reviews.
How to turn a simple chart into a near-term road map
By Elliott Wave International
On February 20, Variety Magazine’s “Film News Roundup” announced a new thriller coming to theaters near you: “The Silver Bear.”
Funny enough, that same day, another kind of thriller was playing out in the theater of finance; its name, the Silver Bull!
The chart below captures the action: Since the start of 2019, silver prices had been on a tear, soaring to $14, $14.50, $15, $15.50 and then $16 per ounce in late February in a white-hot winning streak that has outperformed even gold.
Thanks to a wide array of supportive fundamentals including a softening U.S. dollar, a dovish Federal Reserve, increased economic uncertainty and a subsequent rise in demand for traditional “safe havens” such as gold and silver — mainstream news outlets captured the Silver Bull sentiment on high:
“Is Silver About to Explode?” (Feb. 21 Seeking Alpha) “Silver Market Steadily Building Up Momentum” (Feb. 19 Commodity Trade Mantra) “Silver Experiences A Bullish Development that Points to Higher Prices” (Feb. 20 ETF Daily News)
Yet, off the mainstream screen, we had a very different take on silver’s rally. On February 21, our Metals Pro Service identified a classic Elliot wave “impulse” underway from the November 2018 low to the February 20 high above $16 per ounce. And, it was close to being finished.
For newbies, here is an idealized diagram of an impulse wave, defined as a five-wave move labeled 1 through 5 that adheres to three cardinal rules:
Wave 2 can never retrace more than 100% of wave 1.
Wave 3 is never the shortest among waves 1, 3 and 5.
And wave 4 can’t end in the price territory of wave 1.
The February 21 Metals Pro Service labeled the impulsive rise on silver’s price chart and warned of a pending reversal:
“Silver may have topped…at 16.19 and be correcting the entire rise from 13.98 now.”
So, what should you expect after a five-wave impulse is complete?
By their very nature, an impulse move is followed by a correction, often unfolding in three waves (A-B-C) and pushing back into the span of travel of the prior fourth wave. See diagram below:
Wrote our Metals Pro Service on February 21:
“The move should develop in three waves and reach the 15.35 area over the coming days.”
The white metal followed in-step, embarking on a powerful, two-week long selloff to below $15 per ounce.
Then, on March 7, our Metals Pro Service turned near-term bullish. Why?
Because now the three-wave, A-B-C correction was complete, too. On March 7, Metals Pro Service silver outlook set the stage for gains:
“On the upside, an impulsive rally above 15.17 will hint that a bottom is in place and that the larger-degree uptrend has re-ignited.”
From there, silver regained its shine right into our cited upside target area on March 21 — before turning back down.
So, where are silver prices likely headed from here?
Our Metals Pro Service analysis reveals that right now. Watch our Metals expert, Tom Denham, discuss his exciting analysis and exactly what he sees next for this precious metal in his March 28 Metals Pro Service subscriber update. Sign up now for instant access.
US Gasoline prices have shot up 15% to 30% or more over the past 4 weeks as the Summer Blend hits the markets and consumers continue to stay shocked at the increase. In California, prices shot up from near $3 per gallon to over $4 a gallon over a 7-day span. Every year, when the Summer Blend of Gasoline hits the markets, we expect a price increase that is associated with this change. But this year, the price increase has really shocked consumers to the point that they are altering their travel plans and cutting extra spending in an attempt to deal with the new gasoline prices.
This data graph from the US Energy Information Administration shows just how dramatic the price increase has been over the past 3+ weeks.
Anyone with any common sense about how consumers react to these types of price increases will understand that consumers will react to these price increases by cutting other expenses and travel from their future in order to compensate for the higher gas prices. We’ve seen it happen many times in the past. This means that retail shopping, entertainment, dining, and other non-essential purchases will be curtailed as consumers deal with the extra $100 to $250+ each month in gasoline costs. Small business and other service industries that rely on driving or on-site work will also see their bottom line profits drop as a result of these higher prices. The extra costs for these companies could be counted in the thousands each month.
We believe the reaction to these higher gasoline prices will result in decreasing demand by consumers as they cut back on certain expenses and attempt to limit travel as needed to balance their essentials and non-essential purchases. We believe this decrease in overall purchases will likely reflect in a decrease in travel and hospitality, retail, entertainment, and restaurant purchases. It is very likely that this decrease will be felt across the economy fairly quickly as gasoline prices attempt to stabilize near new levels.
Our researchers, at Technical Traders Ltd, believe Oil will come under pricing pressure over the next few weeks as consumers react to the higher gasoline prices. The recent price stall near $65 aligns with a key Fibonacci retracement level near $63.98 and we believe any further upside in Oil may be limited. Our researchers believe a downside price retracement will begin to unfold where Oil prices will fall to below $55 ppb initially and potentially target sub $50 levels eventually.
The recent rally in oil prices from last 2018 was in-line with expectations that the US and global markets would recover after the deep price correction in Q4 2018. As the US stock market continues to rally towards new highs, we suggest watching Crude Oil, Transports and overall consumer activity to determine is a mild consumer recession sets up over the next few weeks. Our research suggests that Q2 is typically fairly strong for Transports and Oil. Q3, or the Summer season, is typically relatively weak. This fall into the old trader saying “Sell in May and go away”. We believe the rotation lower in Oil and consumer activity related to the higher oil prices may hit the markets a bit earlier this year and set up some incredible trading opportunities.
If our research is correct and Oil prices top over the next few weeks, this means that OILD and USOD are likely to be very strong buying opportunities near historical lows. Let’s take a look at these setups and plan out the best case scenario.
USOD, the US 3x Short Oil Fund, is set up with current price levels very close to historical price lows. We can see how any price move below $4 would set up an incredible buying opportunity for skilled traders to setup swing trade long positions going into the summer months. The closer we get to mid-May, the more likely the historical price weakness will setup to drive these Oil ETFs higher by at least 15% to 25%. Our believe that consumers will react to the higher gasoline prices by cutting their demand for extra travel and other expenses help to support our belief that oil prices may decline 12% to 24% over the next 30 to 60 days.
OILD, the Proshares UltraPro Short 3x ETF, is setting up very near to historical price lows slightly below $16. We believe any price decline near these lower levels would create an excellent buying opportunity for skilled traders to setup long trades in OILD as we expect the Summer season oil price decline to push these ETFs at least 15~25% higher.
The key to understanding the potential for this trade is to watch for price weakness in the general markets and in select consumer sectors (travel, entertainment, retail, restaurants, and others). If we see that consumers are pulling back on certain expenses, then we can assume they are also pulling back on travel, gas purchases, and Summer vacations. This will likely cause demand issues in Oil to prompt a price decline. We don’t expect a dramatic price decline at this point, but we do expect a 12% to 24% price drop as any protection move by consumers will have far-reaching results on the economic numbers and future expectations.
Take a minute to find out why TheTechnicalTraders.com is quickly becoming one of the best research and trading services you can find anywhere on the planet and last week we took another 4.5% profit on another winning trade. We are about to launch a new technology product to assist our members and we continue to deliver incredible research posts, like this one, where we can highlight our proprietary price modeling systems and adaptive learning solutions. If you want to stay ahead of these markets moves and find greater success in 2019 and beyond, then please take a minute to see how we can help you. Once this move begins in Gold and Silver, there will be dozens of incredible opportunities for skilled investors – don’t miss out of them. Join TheTechnicalTraders.com today.
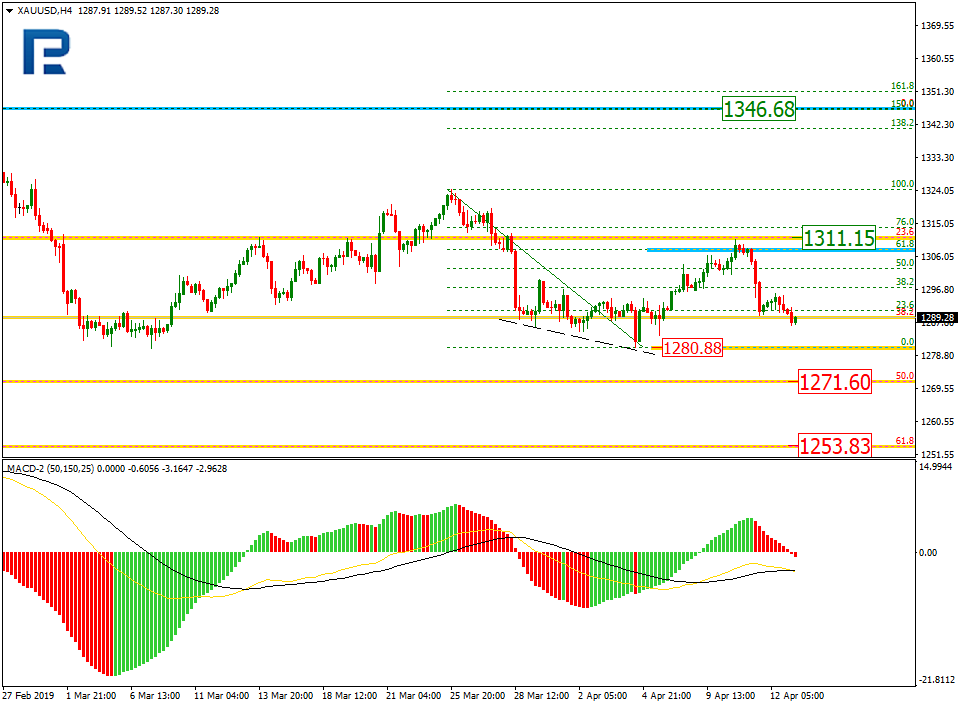
As we can see in the H4 chart, after being corrected by 23.6%, XAUUSD is forming a new descending impulse. If the price breaks the low at 1280.88, the instrument may continue falling towards the retracements of 50.0% and 61.8% at 1271.60 and 1253.83 respectively.
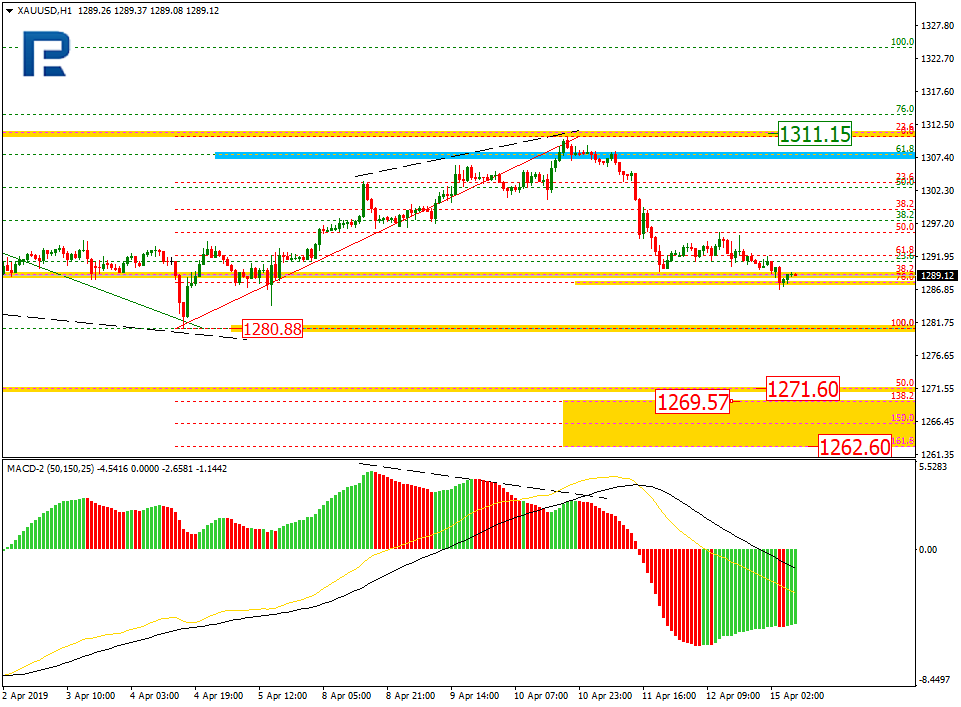
In the H1 chart, the current downtrend has already reached the retracement of 76.0%. The next downside target is the low at 1280.88. If later the price breaks the low, the instrument may continue falling to reach not only the retracement of 50.0% at 1271.60, but also the post-correctional extension area between the retracements of 138.2% and 161.8% at 1269.57 and 1262.60 respectively.
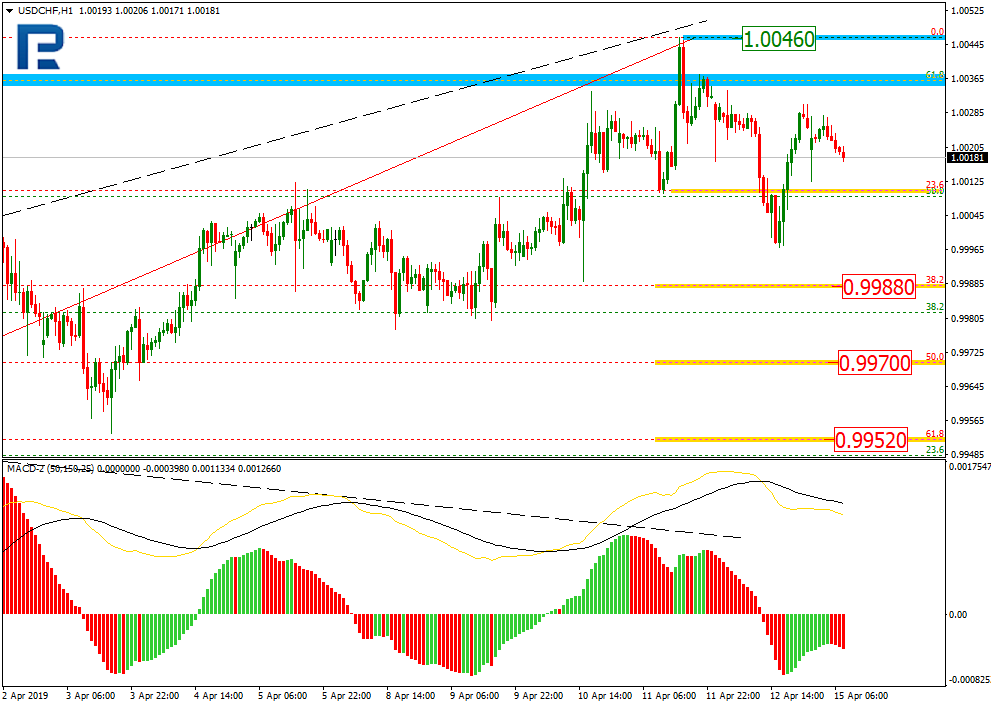
USDCHF, “US Dollar vs Swiss Franc”
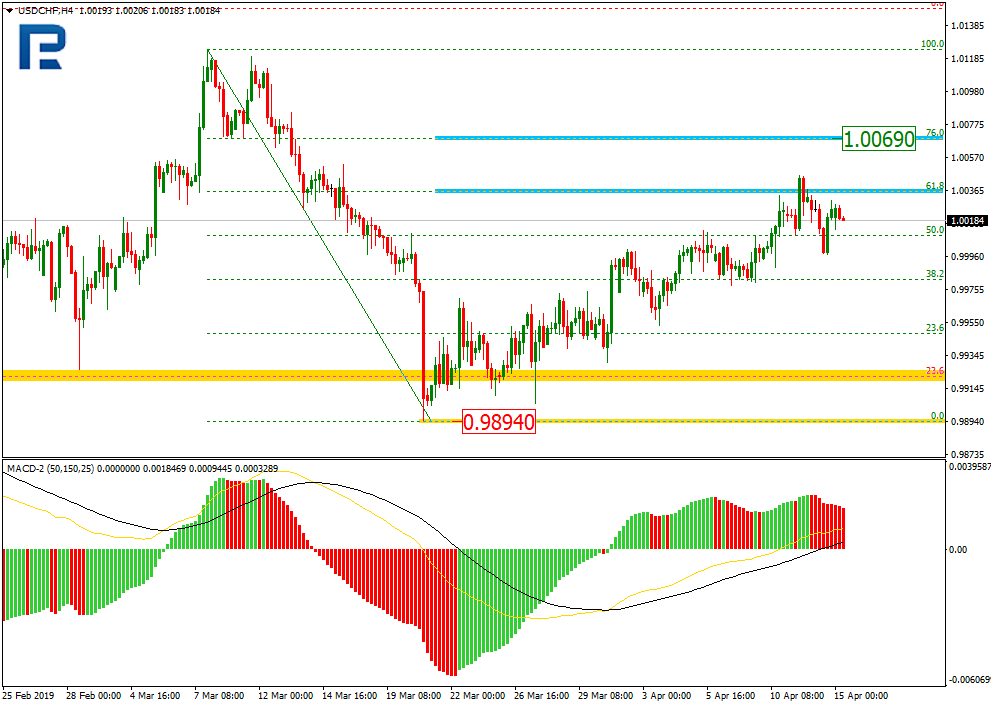
As we can see in the H4 chart, the correctional uptrend has already reached the retracement of 61.8%. The next upside target may be the retracement of 76.0% at 1.0069. The key support level is the low at 0.9894.
In the H1 chart, there was a divergence, which made the pair start a new decline, which has already reached the retracement of 23.6%. The next downside targets may be the retracement of 38.2%, 50.0%, and 61.8% at 0.9988, 0.9970, and 0.9952 respectively. The resistance level is the local high at 1.0046.
Attention! Forecasts presented in this section only reflect the author’s private opinion and should not be considered as guidance for trading. RoboForex LP bears no responsibility for trading results based on trading recommendations described in these analytical reviews.
EUR/USD keeps showing a positive trend. Right now the EUR is consolidating around 1.13000. The demand for the risky assets remains relatively high. The local support and resistance levels are 1.12900 and 1.13200. The EUR/USD quotes have a tendency to grow further. You should open positions from the key levels.
This week will have some important releases which may affect the dynamics of the currency majors. The financial market participants also await for more data regarding Brexit and the US/China negotiations. On Friday the world trade platforms will be closed due to Good Friday.
The Economic News Feed for 15.04.2019 is calm.
The price fixed above 50 MA and 200 MA which points to the power of the buyers.
The MACD histogram is in the positive zone and keeps rising, which points towards further growth of EUR/USD.
The Stochastic Oscillator is in the neutral zone, the %K line is crossing the %D line. There are no signals at the moment.
Trading recommendations
Support levels: 1.12900, 1.12750, 1.12500
Resistance levels: 1.13200, 1.13500, 1.14000
If the price fixes above 1.13200, expect the quotes to grow toward 1.13500-1.13800.
Alternatively, the quotes can fall toward 1.12700-1.12500.
The GBP/USD currency pair
Technical indicators of the currency pair:
Prev Open: 1.30526
Open: 1.30722
% chg. over the last day: +0.21
Day’s range: 1.30673 – 1.31026
52 wk range: 1.2438 – 1.4378
GBP/USD keeps trading in a long flat. There is no defined trend. The investors are waiting for new info regarding Brexit. The EU postponed it last week, but the market participants are worried that Theresa May still won’t be able to get an approval from the British lawmakers. Right now the local support and resistance are at 1.30650 and 1.31000 respectively. You should open positions from these levels.
The Economic News Feed for 15.04.2019 is calm.
The indicators do not provide precise signals, the price has crossed 50 MA and 200 MA.
The MACD histogram is close to 0. There are no signals at the moment.
The Stochastic Oscillator is in the neutral zone, the %K line is below the %D line, which gives a signal to sell GBP/USD.
Trading recommendations
Support levels: 1.30650, 1.30350, 1.30000
Resistance levels: 1.31000, 1.31300, 1.31550
If the price fixes above 1.31000, expect the quotes to grow toward 1.31300-1.31500.
Alternatively, the quotes can fall toward 1.30400-1.30200.
The USD/CAD currency pair
Technical indicators of the currency pair:
Prev Open: 1.33845
Open: 1.33304
% chg. over the last day: -0.48
Day’s range: 1.33197 – 1.33411
52 wk range: 1.2248 – 1.3664
USD/CAD shows an ambiguous technical picture. The CAD is consolidating at 1.33200-1.33400. The USD/CAD quotes have a tendency to descend. Keep an eye on the oil quotes dynamics and open positions from the key levels.
The Economic News Feed for 15.04.2019 is calm.
The indicators do not provide precise signals: 50 MA started to cross 200 MA.
The MACD histogram is in the negative zone but above the signal line which gives a weak signal to sell USD/CAD.
The Stochastic Oscillator is in the neutral zone, the %K line is above the %D line which points to the bullish mood.
Trading recommendations
Support levels: 1.33200, 1.33000, 1.32850
Resistance levels: 1.33400, 1.33650, 1.33850
If the price fixes below 1.33200, expect the quotes to fall toward 1.32900-1.32700.
Alternatively, the quotes can grow toward 1.33650-1.33850.
The USD/JPY currency pair
Technical indicators of the currency pair:
Prev Open: 111.640
Open: 111.961
% chg. over the last day: +0.32
Day’s range: 111.888 – 112.098
52 wk range: 104.56 – 114.56
USD/JPY stays in a bullish mood. The trading instrument reached the annual maximums. Right now the USD/JPY quotes are consolidating next to 112.000-112.100. 111.800 acts as a mirror suport. The demand for safe assets lowered, a technical correction is possible soon. Keep an eye on the US Treasury bonds’ yield and open positions from the key levels.
The Economic News Feed for 15.04.2019 is calm.
The price fixed above 50 MA and 200 MA which points to the power of the buyers.
The MACD histogram is in the positive zone but below the signal line which gives a weak signal to buy USD/JPY.
The Stochastic Oscillator is in the oversold zone, the %K line is crossing the %D line. There are no signals.
Trading recommendations
Support levels: 111.800, 111.600, 111.450
Resistance levels: 112.000, 112.400, 112.600
If the price fixes above 112.100, expect further growth toward 112.500-112.700.
Alternatively, the quotes can correct toward 111.600-111.450.
Without too much attention from traders, the SPY and QQQ are racing to attempt to establish new all-time highs in what may become the most exciting Spring/Summer breakout rally of the past 3 years. While many other symbols are still flirting with November/December 2018 highs, the SPY and QQQ are both showing upside price gaps last week indicating a moderately strong price advancement is taking place. Additionally, both the SPY and the QQQ are already well above early 2018 peak levels.
If you were not paying attention, it sure looks like these two symbols are racing to be the first to break into “new all-time high levels” and shock the doomsayers (again) as we may see this rally continue for at least another 30 to 60 days.
If you’ve been following our research, you’ll know that our short term research suggests new all-time high prices are imminent (very likely over the next 30 to 60+ days). We made this call back in September 2018 before the big selloff prompted by the US Fed. We also called the bottom on December 24, 2018, and warned that the subsequent rally would push hard in an attempt to target recent all-time highs. Now, as we near this event, we need to evaluate what may happen next.
This SPY chart shows the weekly price bars and just how close we are to new all-time highs. The SPY only needs to rally about $8 to breach into new record-setting territory. We believe the upside rally could continue well above the $300 level as this upside price bias should last until late May or into early June 2019. Therefore, we could see an upside potential of more than 5~8% before a new peak sets up.
This QQQ Weekly chart shows similar characteristics, yet shows one incredible variation to the SPY chart. The QQQ chart shows that price is breaching the lower YELLOW price channel and this may result in an impulse move higher in the QQQ that could push it to new highs before the SPY. The QQQ is even closer to all-time highs than the SPY – being only $2.15 away from reaching the all-time high level. If this breach of the lower YELLOW price channel prompts a bigger rally, we could see the QQQ rally upward towards $200 to $210 before setting up a new price peak. This represents a +7.5% to +13.5% upside potential for skilled traders.
If our research continues to be correct, we should expect at least another 30 to 60 days of upward price trend/bias before any real resistance sets up to potentially create a peak in price. Our research suggests late May or early June 2019 is the time traders should protect open positions and prepare for extended volatility.
Don’t wait for the ES, NQ, YM or TRAN to break the all-time highs. Watch the QQQ and SPY for this event and pay attention to the Russell 2000 and Blue Chips as they will likely be the early warning signs of a price peak or price weakness. We warned that price volatility will likely increase over the net 30+ days – so be prepared for some bigger price swings going forward as the bull and bears fight for control as we near these resistance areas.
With a total of 55 years experience in technical analysis and trading between Brad Matheny, and myself Chris Vermeulen, our research and trading signals makes analyzing the complex and ever-changing financial markets a natural process. We have a simple and highly effective way to provide our customers with the most convenient, accurate, and timely market forecasts available today. Our stock and ETF trading alerts are readily available through our exclusive membership service via email and SMS text. Our newsletter, Technical Trading Mastery book, and Trading Coursesare designed for both traders and investors. Also, some of our strategies have been fully automated for the ultimate trading experience.
On Friday, the US dollar weakened against a basket of major currencies after the publication of mixed economic statistics. Thus, the indexes of consumer expectations and sentiment counted to 85.8 and 96.9 in April, respectively, and were worse than the expected values of 88.5 and 98.1. Export and import price indexes rose by 0.7% and 0.6% in March, respectively, while investors expected growth by 0.2% and 0.4%. The dollar index (#DX) closed in the negative zone (-0.26%). At the moment, the indicator is consolidating near monthly lows.
Demand for risky assets is still at a fairly high level. Investors were pleased with the recovery in exports in China, which rose by 14.2% in March instead of the expected growth by 7.3%.
This week, investors expect news on the development of trade relations between the US and China, as well as the Brexit process. The US Treasury Secretary Steven Mnuchin announced that countries were close to embarking upon the final part of the negotiations on a trade agreement. Also, this week important economic data will be published that may have a significant impact on the dynamics of the currency majors in the short term.
The “black gold” prices are moderately decreasing after a continuous rally. At the moment, futures for the WTI crude oil are testing the mark of $63.60 per barrel.
Market Indicators
On Friday, the bullish sentiment was observed in the US stock market: #SPY (+0.68%), #DIA (+1.02%), #QQQ (+0.43%).
The 10-year US government bonds yield is recovering. Currently, the indicator is at the level of 2.55-2.56%.
The news feed for 2019.04.15:
Today, the publication of important economic news is not expected.
April has certainly been a very eventful and important month for the main pair on the market – EURUSD. We started the month really low with an ugly perspective for new long-term lows. Luckily for buyers, the pair managed to bounce from the support created by the lows from March and went higher.
The bounce itself was very technical. EURUSD managed to form an inverse head and shoulders pattern (orange), which on the 8th of April, resulted in a breakout of its neckline along with the 23.6% Fibonacci. That gave us a buy signal and allowed us to challenge the next resistance; the 38.2% Fibo. That one was broken on the 12th of April and allowed us to challenge the next resistance… yes, another Fibonacci! This time 50%. Interestingly, all those Fibo retracements are in line with recent price movements, so important supports and resistances from March.
50% is currently the closest resistance and today is being tested for the second time. Demand looks really strong, so a breakout is very likely. There is one additional thing that has to be mentioned. The recent correction, for most of the time, was shaped as a flag (red lines), which was one bearish factor here. On Friday, EURUSD managed to break the upper line of this pattern, which denies it and takes away this bearish argument from sellers’ hands. The buy signal will be denied if the pair breaks the 23.6% Fibonacci, but that scenario doesn’t seem very likely at the moment.