The US dollar strengthened yesterday against a basket of major currencies amid the publication of optimistic economic reports. Thus, core retail sales index rose by 1.2% in March, while experts expected growth by 0.7%. The volume of retail sales increased by 1.6% compared with market expectations at 0.9%. The number of initial jobless claims dropped to 192K instead of 205K. However, Philadelphia Fed manufacturing index counted to 8.5 in April instead of 10.4. The dollar index (#DX) closed the trading session in the green (+0.49%).
The euro weakened against the US dollar after the release of weak statistics from the Eurozone. German manufacturing PMI fell to 44.5 in April instead of 45.0. Markit composite PMI counted to 45.8 in April and was worse than the expected 47.9.
The British pound weakened against the US currency despite the publication of optimistic economic data. Retail sales rose by 1.1% in March, while experts expected a decline by 0.3%. The British pound is under pressure due to uncertainty on the Brexit issue. Positive economic reports were published in Canada. Thus, core retail sales index rose by 0.6% in February instead of the expected growth by 0.2%. Today, the financial markets of most countries are closed due to the Easter holidays. Volatility and trading activity in the markets can be low.
The “black gold” prices have become stable near annual highs.
Market Indicators
Yesterday, the bullish sentiment was observed in the US stock market: #SPY (+0.20%), #DIA (+0.39%), #QQQ (+0.13%).
The 10-year US government bonds yield is at 2.56-2.57%.
The news feed for 2019.04.19:
– Statistics on the real estate market in the US at 15:30 (GMT+3:00).
If yes, then just set yourself free on some amazing trips once every while.
If vacations and touring are your ways of getting rejuvenated then make provisions for them.
However, budgets are your primary concern for all that and perhaps, this is the reason you might have cancelled on so many trips.
But do you think all the beautiful places you desire to see would cost you a fortune only?
No….!!
India is a land of exceptional beauty. The exotic and serene beauty of the nature here does not need to be seen through expensive hotels or costly rides. All you need to do is to make a correct itinerary and tour to some real nature’s paradise that would not cost you much.
The entire vicinity of Himachal is surprisingly beautiful and so is Kasol. Perhaps, in the heart of Himachal, the entire terrain of Kasol is blessed with wondrous beauty of nature. Be it the valleys, the scenes, the rivers, the mountains or the hill top view. Everything in Kasol does possess splendor and visiting these places in Kasol would not cost you much if you have planned your trip smartly. All you need is use state transport which is relatively cheap and book yourself a room in some cheap yet nice hotels around. These guest houses or resorts are really cheap but a stay here would let you witness the incredible magnificence of Himachal.
If you want to experience what the state of transmigration does feel like, then plan a trip to India. A spiritual stay here would make you oblivious of the surroundings and take you to an all new level of meditation. This is the miraculous beauty of this place, the yoga capital of the country. Even after such great offers, a stay here remains cheap and inexpensive. The tourists can book hotels, guest houses which provide quite simple and cheap accommodation. Apart, from that the exclusive guest accommodation here are in the Ashrams and Yoga Camps, that ensconce you entirely and provide for everything from shelter to daily ablution services and all of that costs you a meagre.
Goa, though the title assigned to it is that party capital of the country still a stay here is not as expensive as you might expect.
The entire beach side will be dotted with Shacks, which are sort of food joints offering liquors and coastal cuisines with a blend of music. The food and drinks here are really cheap despite being offered in such location which includes chilling sea breeze and a calm ambience. This makes them a worth trying experience and even after that they would cost you nothing high.
If you want to experience the charm and splendor of North East, then make a trip to Manipur. This state stands to be an epitome of regal and exotic beauty of North India. It would let you experience everything from picturesque locations to exclusive cuisines, from typical North eastern culture to conventionally pleasant weather. This is the wonder of the place and a stay here is just a minor expense. You will easily get hill top guest houses and Villas too for a small amount. They provide each and every service within that small budget only.
If you have a desire to build a deeper connection with history, then Hampi is your destination. This amazing location will literally act as a liaison between you and history. The great ruins of the place seems as if talking their history and experience to you. The region is home to some greatest of the monuments like – Virupaksha, Lotus temple, Narasimha temple etc. These spots satiates your should for experience and learning to the best and even after that, the tourists here can easily find, many budget and mid prized hotels and cottages here.
Ever experienced a stay in the deafening silence of desert. If that is on your list, then make time for a trip to Jaisalmer. A camping stay here is one of its kind, where your soul will meet some wondrous experiences. Take a camel safari to your camp and spend the night witnessing the sparkling stars in the sky fall. The stay in these camps and camel rides are surprisingly cheap and hence the entire trip would not cost you much.
Author Bio:
Rohit, has been on trips of every kind, from lavish tours to trips in the nature, he has experienced everything and this is the reason his blogs at TransIndiatravel.com are perfect guides for every kind of traveler.
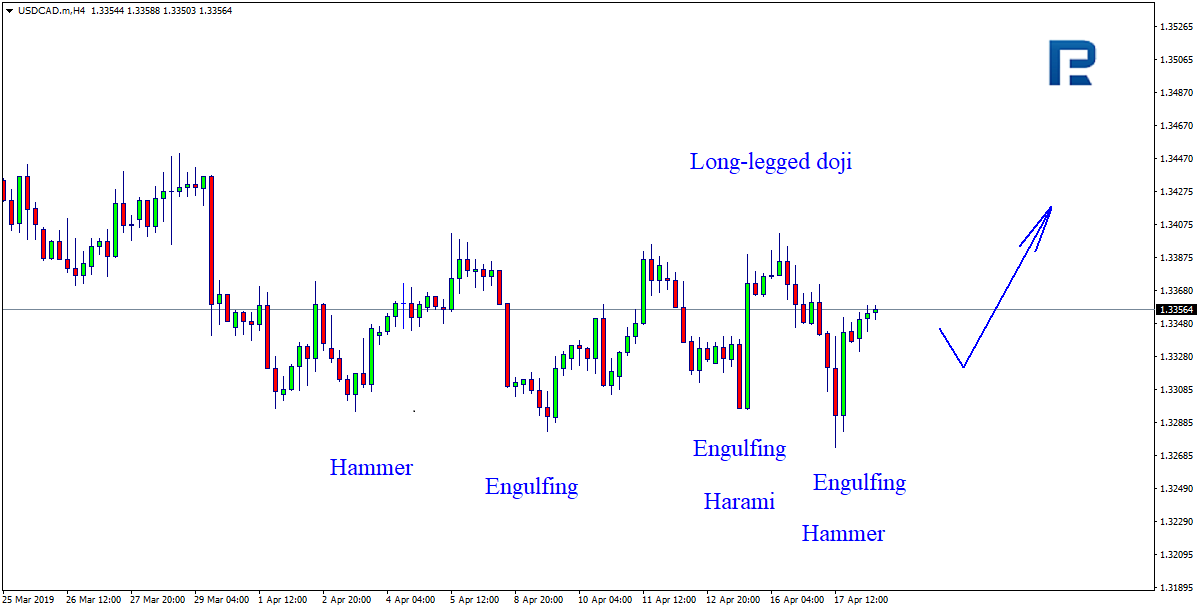
As we can see in the H4 chart, USDCAD is still testing the support level and forming Harami, Hammer, and Engulfing reversal patterns. Judging by the previous movements, it may be assumed that after finishing its sideways movement the instrument may resume trading upwards.
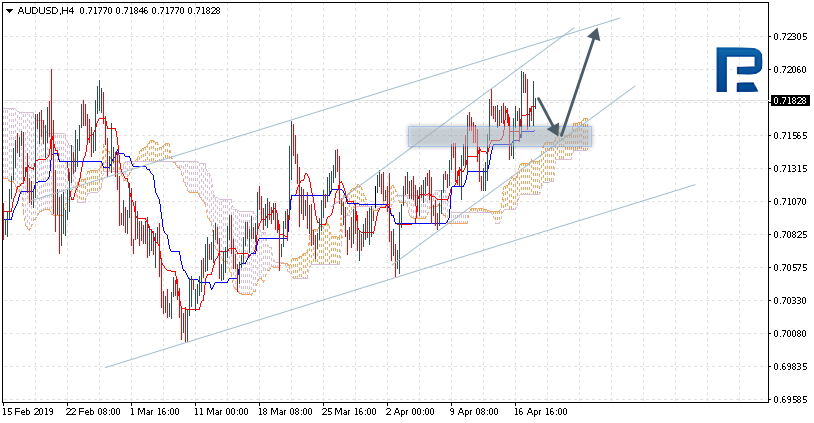
AUDUSD, “Australian Dollar vs US Dollar”
As we can see in the H4 chart, after completing Shooting Star and Harami reversal patterns, AUDUSD has finished another correction from the resistance level. Judging by the previous movements, right now it may be assumed that after finishing the pullback the instrument may break the level and continue its growth.
Attention! Forecasts presented in this section only reflect the author’s private opinion and should not be considered as guidance for trading. RoboForex LP bears no responsibility for trading results based on trading recommendations described in these analytical reviews.
AUDUSD is trading at 0.7182; the instrument is moving above Ichimoku Cloud, thus indicating an ascending tendency. The markets could indicate that the price may test the upside border of the cloud at 0.7160 and then resume moving upwards to reach 0.7235. Another signal to confirm further ascending movement is the price’s rebounding from the channel’s downside border. However, the scenario that implies further growth may be cancelled if the price breaks the downside border of the cloud and fixes below 0.7125. In this case, the pair may continue falling towards 0.7055.
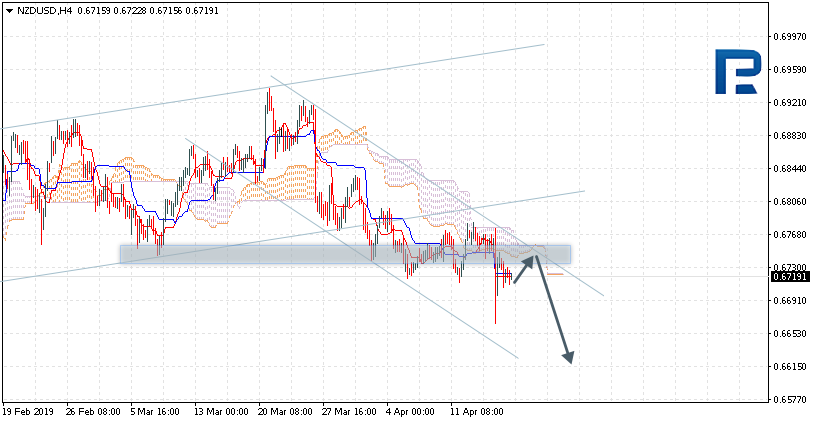
NZDUSD, “New Zealand Dollar vs US Dollar”
NZDUSD is trading at 0.6719; the instrument is moving below Ichimoku Cloud, thus indicating a descending tendency. The markets could indicate that the price may test the downside border of the cloud at 0.6735 and then resume moving downwards to reach 0.6615. Another signal to confirm further descending movement is the price’s rebounding from the channel’s upside border. However, the scenario that implies further decline may be cancelled if the price breaks the upside border of the cloud and fixes above 0.6785. In this case, the pair may continue growing towards 0.6900.
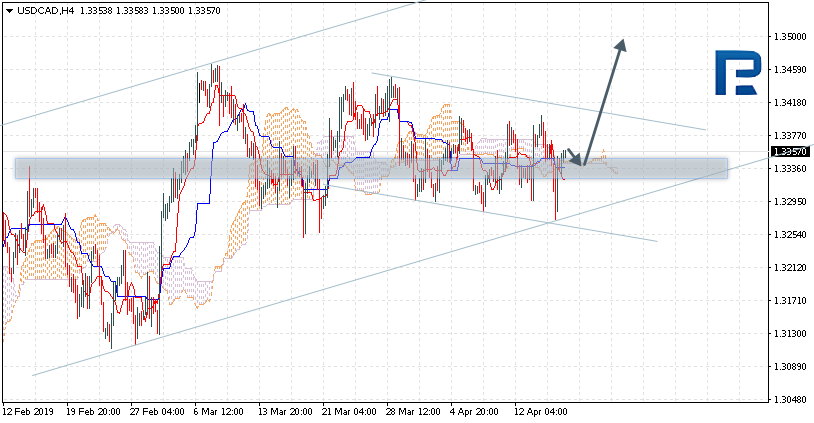
USDCAD, “US Dollar vs Canadian Dollar”
USDCAD is trading at 1.3357; the instrument is moving above Ichimoku Cloud, thus indicating an ascending tendency. The markets could indicate that the price may test the downside border of the cloud at 1.3335 and then resume moving upwards to reach 1.3500. Another signal to confirm further ascending movement is the price’s rebounding from the support level. However, the scenario that implies further growth may be cancelled if the price breaks the downside border of the cloud and fixes below 1.3315. In this case, the pair may continue falling towards 1.3215. After breaking the channel’s upside border and fixing above 1.3425, the price may continue moving upwards.
Attention! Forecasts presented in this section only reflect the author’s private opinion and should not be considered as guidance for trading. RoboForex LP bears no responsibility for trading results based on trading recommendations described in these analytical reviews.
Trading actiivity and volatility lowered on all major currency pairs due to upcoming holidays. EUR remains in a flat. The key support and resistance levels are 1.12800-1.13200. The investors are waiting for important economic releases which acan affect the majors’ short-term dynamic. You should open positions from these levels.
The Economic News Feed for 18.04.2019:
– Business Activity Index in the Industrial Sector (GER) – 10:30 (GMT+3:00);
– An Array of Business Activity Indices (EU) – 11:00 (GMT+3:00);
– Industrial Activity Index by FR of Philadelphia (US) – 15:30 (GMT+3:00);
The indicators do not provide precise signals, the price has crossed 50 MA.
The MACD histogram is close to 0.
The Stochastic Oscillator is close to the neutral zone, the %K line is above the %D line which points to the bullish mood.
Trading recommendations
Support levels: 1.12800, 1.12500, 1.12350
Resistance levels: 1.13200, 1.13500, 1.14000
If the price fixes above 1.13200, expect further growth toward 1.13500-1.13800.
Alternatively, EUR/USD can fall toward 1.12600-1.12400.
The GBP/USD currency pair
Technical indicators of the currency pair:
Prev Open: 1.30483
Open: 1.30360
% chg. over the last day: -0.08
Day’s range: 1.30196 – 1.30525
52 wk range: 1.2438 – 1.4378
GBP/USD remains ambiguous. The UK National Statistic Service reported that in March the Consumer Price Index reached 1.9% (annually) which is lower than the 2% target value set by the Bank of England. Right now the market participants are waiting for additional drivers with the key support levels being 1.30150 and 1.30500. Keep an eye on important statistic reports from the UK and the US and open positions from the key levels.
At 11:30 (GMT+3) the UK will publish reports on the retail sales for March.
The price fixed below 50 MA and 200 MA which points to the power of the sellers.
The MACD histogram is in the negative zone and keeps falling which gives a strong signal to sell GBP/USD.
The Stochastic Oscillator is in the neutral zone, the %K line is below the %D line which points towards a bearish mood.
Trading recommendations
Support levels: 1.30150, 1.29850
Resistance levels: 1.30500, 1.30700, 1.31000
If the price fixes below 1.30150, expect further descend towards 1.29850-1.29700.
Alternatively, the quotes can recover towards 1.30700-1.31000.
This article reflects a personal opinion and should not be interpreted as an investment advice, and/or offer, and/or a persistent request for carrying out financial transactions, and/or a guarantee, and/or a forecast of future events.
The last sessions on USD/CAD have been very active but didn’t have a defined trend. Right now the technical picture is ambiguous. The local support and resistance levels are 1.33400-1.33700. The investors are waiting for important economic reports. Keep an eye on the oil quotes dynamics and open positions from the key levels.
At 15:30 (GMT+3:00) Canada will publish a report on the retail sales.
The indicators do not provide precise signals: 50 MA started to cross 200 MA.
The MACD histogram is in the positive zone and keeps rising which points toward a bullish mood.
The Stochastic Oscillator is in the neutral zone, the %K line is crossing the %D line. There are no signals at the moment.
Trading recommendations
Support levels: 1.33400, 1.33150, 1.33000
Resistance levels: 1.33700, 1.34000
If the price fixes above 1.33700, expect the quotes to rise toward 1.34000.
Alternatively, the quotes can fall toward 1.33200-1.33000.
The USD/JPY currency pair
Technical indicators of the currency pair:
Prev Open: 111.995
Open: 112.053
% chg. over the last day: +0.03
Day’s range: 111.766 – 112.062
52 wk range: 104.56 – 114.56
The safe haven currency remains in a flat. There is no defined trend. The investors are waiting for additional drivers. The USD/JPY quotes are testing the key levels at 111.800-112.100. You should keep an eye on the dynamics of the US Treasury bonds` yield and open positions from the key levels.
The Economic News Feed for 18.04.2019:
The indicators do not provide precise signals, the price fixed between 50 MA and 200 MA.
The MACD histogram is in the negative zone which points towards a beginning of the correction move.
The Stochastic Oscillator started to leave the oversold zone, the %K line is above the %D line which points towards buying USD/JPY.
Trading recommendations
Support levels: 111.800, 111.600, 111.450
Resistance levels: 112.100, 112.500, 112.750
If the price fixes below 111.800, expect a correction towards 111.600-111.400.
Alternatively, the quotes can grow toward 112.300-112.500.
The US stock markets took a nosedive early in the regular trading session after the QQQ briefly advanced to new All-Time Highs this morning. With the QQQ and other symbols nearing fresh new highs, traders should expect volatility to increase as trading systems and traders to look for any signs of a top to set up. As we start to cross into “new high territory”, some fear starts to come back into the markets and volatility is sure to increase.
The Russell 2000 took a pretty big hit today as you can see from the chart below. This move lower is still well within our proprietary Fibonacci modeling system’s bullish parameters and we’ve highlighted a “Support Zone” for our followers to understand where real price support is located. Any downside move below $152 would cause us to reconsider our bullish trend position, but right now this is nothing more than price rotation. Wait it out and look for opportunities when it bottoms.
The YM (Dow Futures) Daily chart, below, highlights just how fractured the US stock market really is today. While the Russell 2000 is rotating lower quite hard, the DOW futures are relatively FLAT and still trading near the recent highs. This fracturing of the major indexes suggests money may be moving away from sectors/symbols that traders may interpret as risky at the moment – and into symbols that are more stable. For example, we might find that Financials and the Russell 2000 symbols may present a relatively high level of fear that a downside rotation in these sectors may be bigger and more dramatic than in the NQ, ES or YM.
Still, our advice is to watch this move and wait it out a bit. Our “Support Zone” for the YM is clearly highlighted with the Green Box on the chart.
Lastly, we want to highlight the Transportation Index for all of our followers to understand what is going on behind the scenes today. The Transportation Index is a fairly strong measure of future economic activity and output. It typically leads the US stock market by at least 20~30 days. The price advance, today, in the Transports would indicate that many traders believe the US economy is still improving and will still continue to perform well. If the Transports break to new highs, then we should see more continued upside price levels in many of the US stock market sectors.
Again, the markets are a bit fractured today with price action. And that leads us to believe we could see a spike in the VIX and volatility over the next few days/weeks while this rotation plays out. Eventually, we believe a continued upside price leg will resume and we want to urge traders to play it safe for right now. Follow our “Support Zones” as a key indicator for when the price has fallen into a potentially risky level – below support. If this happens, then we would begin to become concerned that price may be initiating a bigger move to the downside.
Get my daily analysis and swing trade alerts at my Wealth Trading Newsletter and become a technical trader today!
The US dollar is moving without a clear dynamic. Yesterday, the dollar index (#DX) closed the trading session at previous levels (+0.01%). Volatility on currency majors has dropped significantly on the eve of holidays. Financial market participants expect the publication of important statistics from the Eurozone, UK, US and Canada. These economic releases may have quite a strong influence on the dynamics of currency majors in the short term.
Market participants also assess signs of progress in the US-China trade negotiations. As it became known, Washington and Beijing set a preliminary date for a new round of negotiations expecting the possible signing of an agreement in late May or early June.
Yesterday, reports on inflation were published in the UK, Eurozone and Canada. Thus, the UK consumer price index counted to 1.9% (y/y) in March, while experts expected the figure at 2.0%. The consumer price index in the Eurozone counted to 1.4% (y/y) in March, as the experts forecasted. The core consumer price index in Canada slowed down from 0.7% (m/m) to 0.3% (m/m).
The demand for the Australian dollar rose after the publication of optimistic statistics. So, today, during the Asian trading session, data on employment change have been published in Australia, according to which the number of people employed increased by 25.7K in March, while experts forecasted growth by 12.0K.
The British pound is still under pressure due to the uncertainty concerning Brexit. Economists at Reuters believe that the chances of Brexit cancellation are more likely than the UK leaving the EU without a deal.
The “black gold” prices have been declining. At the moment, futures for the WTI crude oil are testing the mark of $63.50 per barrel. At 20:00 (GMT+3:00) a report on the US Baker Hughes oil rig count will be published.
Market Indicators
Yesterday, there was a variety of trends in the US stock market: #SPY (-0.24%), #DIA (+0.00%), #QQQ (+0.35%).
The 10-year US government bonds yield is decreasing. Currently, the indicator is at the level of 2.55-2.56%.
The news feed for 2019.04.18:
– German manufacturing PMI at 10:30 (GMT+3:00); – A number of indices of economic activity in the Eurozone at 11:00 (GMT+3:00); – Statistics on retail sales in the UK at 11:30 (GMT+3:00); – Philadelphia Fed manufacturing index at 15:30 (GMT+3:00); – Report on retail sales in the United States at 15:30 (GMT+3:00); – Core retail sales in Canada at 15:30 (GMT+3:00).
As we can see in the H4 chart, the downtrend continues; GBPUSD is forming a narrowing consolidation range and testing the retracement of 38.2%. The resistance level is the retracement of 23.6% at 1.3149. Despite the correction, the current descending tendency may yet continue. The next downside target is the retracement of 50.0% at 1.2890.
In the H1 chart, the divergence made the pair start a new decline, which has already reached the retracement of 61.8%. The next target is the retracement of 76.0% at 1.3022 and then the low at 1.2987. The resistance is the local high at 1.3133.
EURJPY, “Euro vs. Japanese Yen”
As we can see in the H4 chart, the uptrend has reached the retracement of 76.0%. The key upside target is the high 127.50. The support is the retracement of 50.0% at 125.58.
In the H1 chart, the pair is being corrected downwards and has already reached the retracement of 23.6%. The next target may be the retracement of 38.2% at 126.02. If the price breaks the high at 126.79, the instrument may start a new rising impulse.
Attention! Forecasts presented in this section only reflect the author’s private opinion and should not be considered as guidance for trading. RoboForex LP bears no responsibility for trading results based on trading recommendations described in these analytical reviews.
EURUSD has formed two impulses and reached its predicted downside target; right now, it is forming the fifth structure. Today, the pair may form a new descending structure to reach 1.1274 and then start another growth with the target at 1.1303.
GBPUSD, “Great Britain Pound vs US Dollar”
GBPUSD has broken 1.3071; right now, it is still trading downwards with the target at 1.30025. Possibly, today the pair may reach this level and then start a new correction to return to 1.3071. Later, the market may resume trading inside the downtrend towards 1.2950.
USDCHF, “US Dollar vs Swiss Franc”
USDCHF continues moving upwards. Today, the pair may fall to reach 1.0052 and then form one more ascending structure towards 1.0085. In general, the price is forming the ascending wave with the target at 1.0142.
USDJPY, “US Dollar vs Japanese Yen”
USDJPY is still consolidating around 111.98 and forming the Divergent Triangle pattern. According to the main scenario, the pair is expected to break the range to the downside and reach the first target 110.86.
AUDUSD, “Australian Dollar vs US Dollar”
AUDUSD has finished another ascending structure. Possibly, today the pair may be corrected towards 0.7153 and then grow to reach 0.7178. If later the price breaks the range to the downside, the instrument may resume trading inside the downtrend with the target at 0.7077.
USDRUB, “US Dollar vs Russian Ruble”
USDRUB is still consolidating around 64.34. Possibly, the pair may fall with the short-term target at 63.63.
XAUUSD, “Gold vs US Dollar”
Gold has broken 1282.00 and may continue falling to reach 1267.70. After that, the instrument may form one more ascending structure towards 1289.00 and then start a new decline with the short-term target at 1260.00.
BRENT
Brent is trading upwards. Possibly, the pair may reach 72.35 and then form a new descending structure towards 71.40. Later, the market may start a new growth with the target at 72.81 or even extend this wave up to 73.80.
Attention! Forecasts presented in this section only reflect the author’s private opinion and should not be considered as guidance for trading. RoboForex LP bears no responsibility for trading results based on trading recommendations described in these analytical reviews.
EUR/USD keeps consolidating. Yesterday the EUR was under pressure due to the comments by the ECB representatives. Some officials think that the current economic forecasts are too positive. Right now EUR has recovered the losses and found the new key trading range at 1.12800-1.13200. The financial market participants are waiting for important releases. You should open positions from the key levels.
The Economic News Feed for 17.04.2019:
– Consumer Price Index (EU) – 12:00 (GMT+3:00);
– Trading Balance (US) – 15:30 (GMT+3:00);
– Federal Reserve’s Beige Book (USD) – 21:00 (GMT+3:00);
The price fixed above 50 MA and 200 MA which points to the power of the buyers.
The MACD histogram is in the positive zone, which gives a signal to buy EUR/USD.
The Stochastic Oscillator is near the overbought zone, the %K line is crossing the %D line. There are no signals at the moment.
Trading recommendations
Support levels: 1.12800, 1.12500, 1.12350
Resistance levels: 1.13200, 1.13500, 1.14000
If the price fixes above 1.13200, expect the quotes to grow toward 1.13500-1.13800.
Alternatively, the EUR/USD can fall toward 1.12600-1.12400.
The GBP/USD currency pair
Technical indicators of the currency pair:
Prev Open: 1.30883
Open: 1.30883
% chg. over the last day: -0.42
Day’s range: 1.30324 – 1.30674
52 wk range: 1.2438 – 1.4378
GBP/USD ignored an optimistic Labour Market report and closed in the red. GBP is under pressure due to The Guardian’s report on Theresa May’s and Labour Party negotiations that had supposedly hit a dead end. Right now the quotes are at 1.30350-1.30700 range. The investors are waiting for the inflation report. You should open positions from the key levels.
At 11:30 (GMT+3:00) the UK will publish a consumer price index.
The indicators do not provide precise signals, 50 MA started to cross 200 MA.
The MACD histogram is in the negative zone but above the signal line which gives a weak signal to buy GBP/USD.
The Stochastic Oscillator started to leave the overbought zone, the %K line is below the %D line which points to the bearish mood.
Trading recommendations
Support levels: 1.30350, 1.30000
Resistance levels: 1.30700, 1.31000, 1.31300
If the price fixes below 1.30350, expect further descend towards 1.30000.
Alternatively, the quotes can recover toward 1.31000-1.31200.
This article reflects a personal opinion and should not be interpreted as an investment advice, and/or offer, and/or a persistent request for carrying out financial transactions, and/or a guarantee, and/or a forecast of future events.
USD/CAD started to descend again and updated the local minimums. The prices on oil keep showing a positive trend, which supports CAD. Right now quotes are at the 1.33150 support level with 1.33500 acting as a mirror resistance. The investors expect important economic reports today. You should open positions from the key levels.
The Economic News Feed for 17.04.2019:
– Basis Consumer Price Index (CAD) – 15:30 (GMT+3:00);
– Trading Balance (CAD) – 15:30 (GMT+3:00);
The price fixed below 50 MA and 200 MA which points to the power of the buyers.
The MACD histogram is in the negatie zone and keeps falling which points to a bearish mood.
The Stochastic Oscillator is in the oversold zone, the %K line is crossing the %D line. There are no signals at the moment.
Trading recommendations
Support levels: 1.33150, 1.33000, 1.32850
Resistance levels: 1.33500, 1.33700
If the price fixes below 1.33150, expect further descend toward 1.32850-1.32700.
Alternatively, the quotes can grow toward 1.33600-1.33800.
The USD/JPY currency pair
Technical indicators of the currency pair:
Prev Open: 112.019
Open: 111.995
% chg. over the last day: -0.03
Day’s range: 111.922 – 112.165
52 wk range: 104.56 – 114.56
USD/JPY keeps trading in a flat. There is no defined trend. The investors are waiting for important reports. Right now the key support and resistance levels are 111.800 and 112.150. You should keep an eye on the US Tresury bonds yield’s dynamic and open positions from the key levels.
During the Asian trading session, Japan published a positive trading balance report.
The indicators do not provide precise signals, the price has crossed 50 MA.
The MACD histogram is close to 0.
The Stochastic Oscillator is close to the oversold zone, the %K line is above the %D line which points towards buying USD/JPY.
Trading recommendations
Support levels: 111.800, 111.600, 111.450
Resistance levels: 112.150, 112.500, 112.750
If the price fixes above 112.150, expect further growth toward 112.500-112.700.
Alternatively, the quotes can correct toward 111.600-111.450.