Article By RoboForex.com
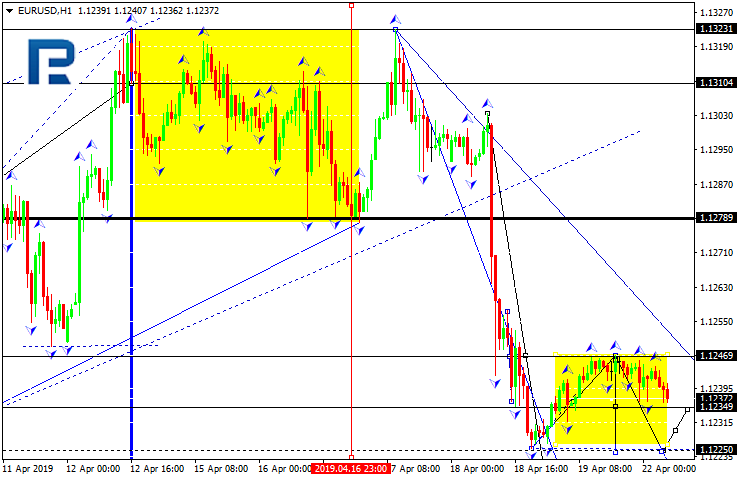
EURUSD, “Euro vs US Dollar”
EURUSD is consolidating around 1.1245. Today, the pair may fall to reach 1.1222 and then form one more ascending structure towards 1.1235. If later the price breaks range to the downside, the instrument may continue falling with the target at 1.1202; if to the upside – start a new correction to reach 1.1270. Later, the market may resume trading inside the downtrend with the target at 1.1111.

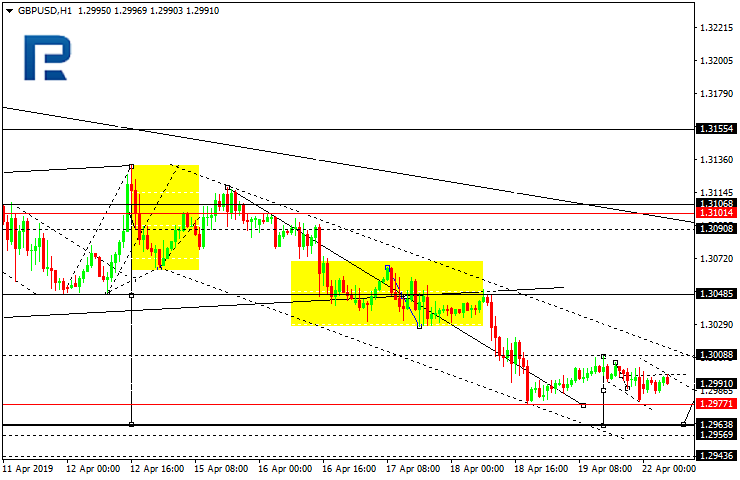
GBPUSD, “Great Britain Pound vs US Dollar”
GBPUSD is consolidating around 1.3000. Possibly, today the pair may fall to reach 1.2970 and then start a new growth towards 1.2985. If later the price breaks range to the downside, the instrument may continue falling with the target at 1.2950; if to the upside – start another correction to reach 1.3045 and then form a new descending structure with the target at 1.2930.
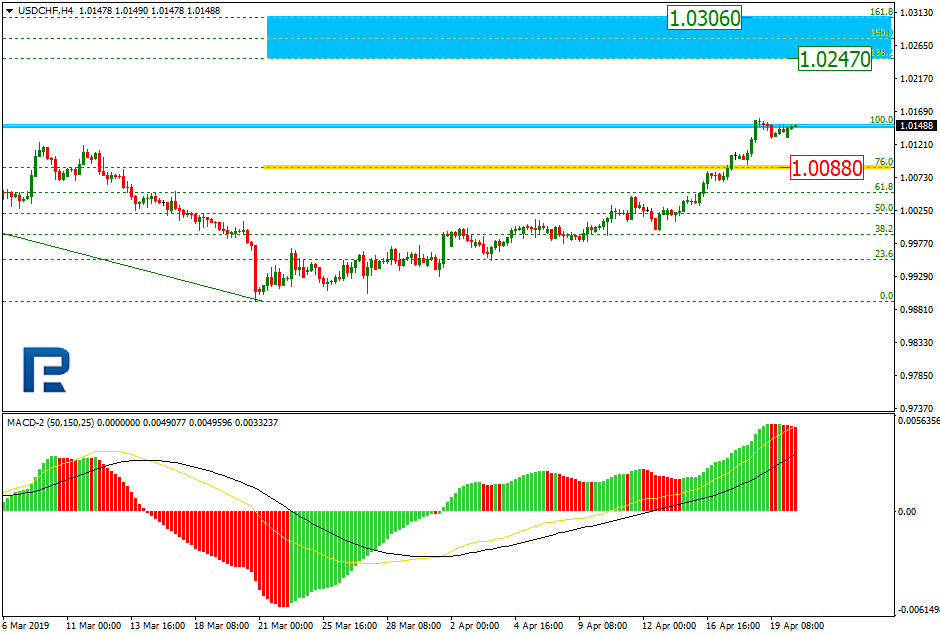
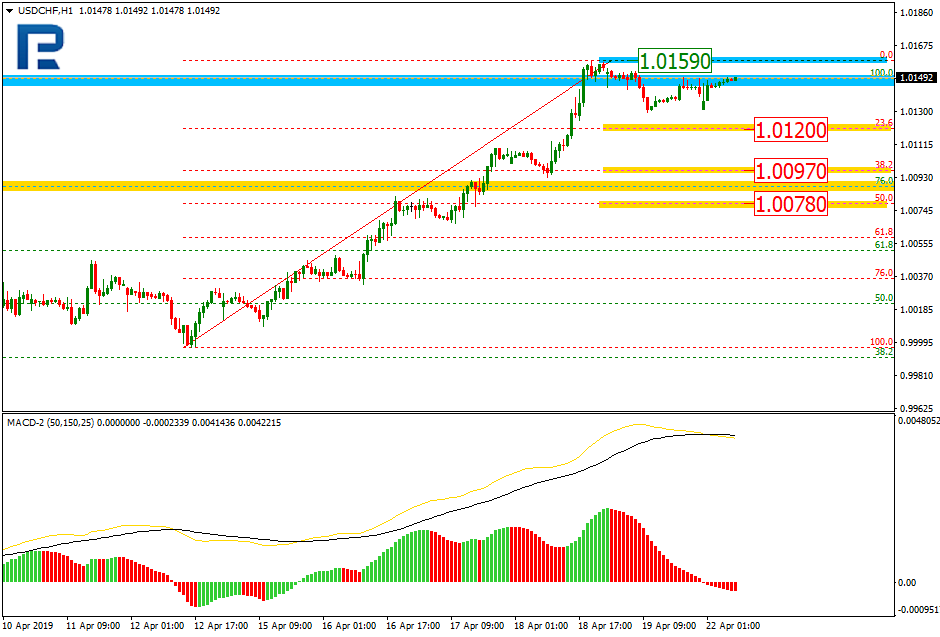
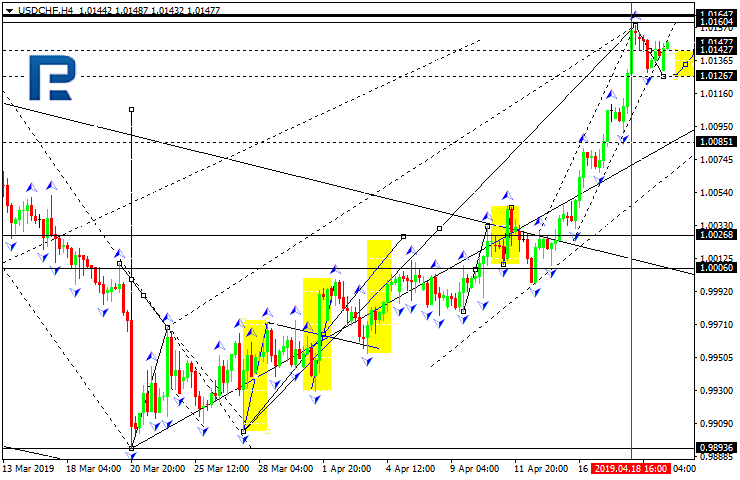
USDCHF, “US Dollar vs Swiss Franc”
USDCHF is consolidating around 1.0142. Today, the pair may fall to reach 1.0126 and then form one more ascending structure to return to 1.0142. If later the price breaks range to the upside, the instrument may grow to reach 1.0160; if to the downside – start a new correction towards with the target at 1.0085 and then continue trading inside the uptrend towards 1.0250.
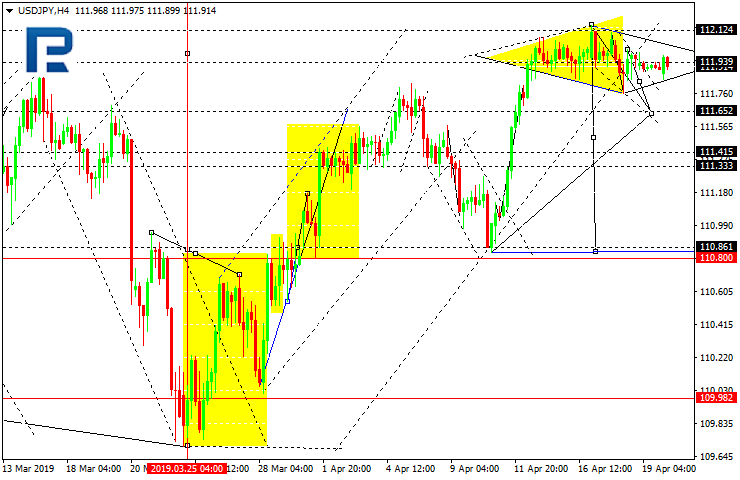
USDJPY, “US Dollar vs Japanese Yen”
USDJPY is consolidating around 111.94. Possibly, today the pair may fall to reach 111.65 and then grow to return to 111.94. If later the price breaks range to the downside, the instrument may continue falling with the target at 110.86; if to the upside – resume trading upwards to reach 112.30 and then form a new descending structure towards 110.80.
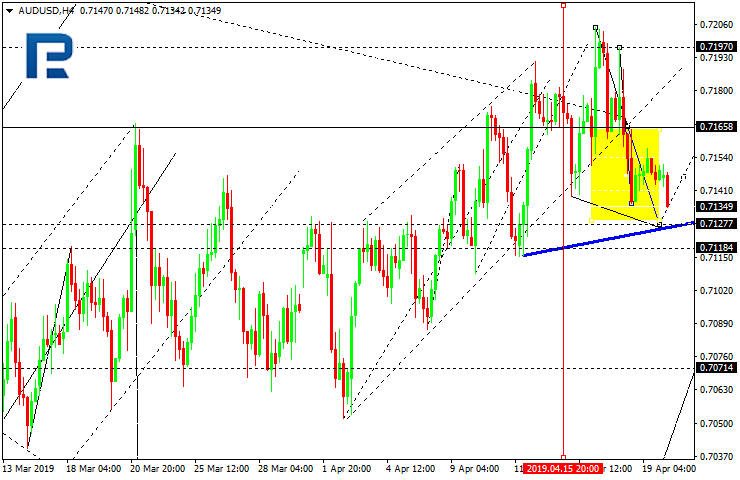
AUDUSD, “Australian Dollar vs US Dollar”
AUDUSD is trading towards 0.7127. Today, the pair may reach this level and then start a new growth with the target at 0.7165. If later the price breaks range to the downside, the instrument may resume trading inside the downtrend towards 0.7071; if to the upside – continue the correction with the target at 0.7195.
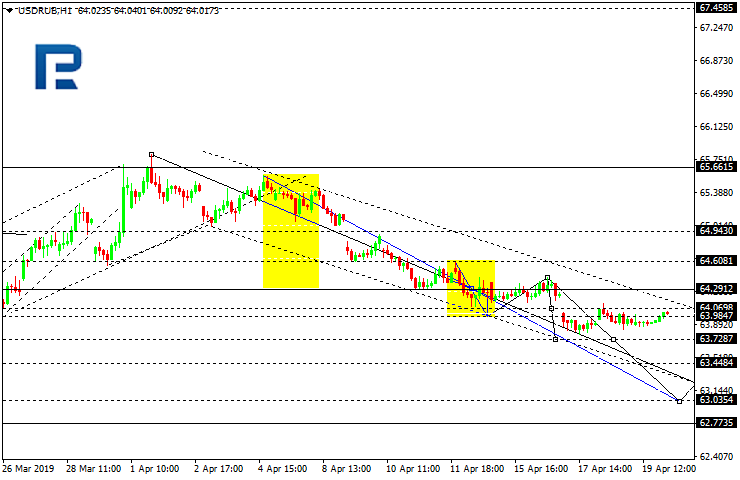
USDRUB, “US Dollar vs Russian Ruble”
USDRUB is still consolidating around 64.06. According to the main scenario, the price is expected to continue trading inside the downtrend with the short-term target at 63.03.
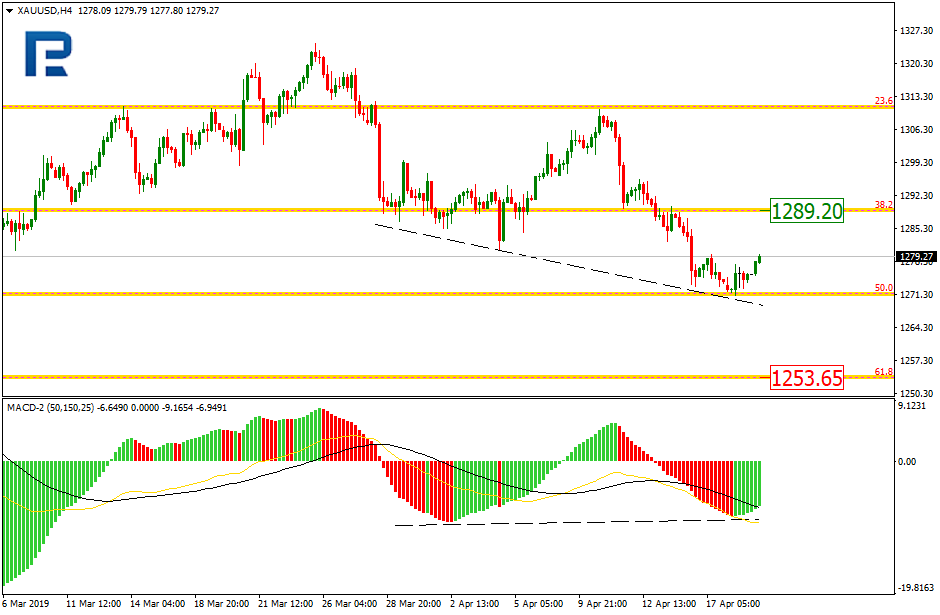
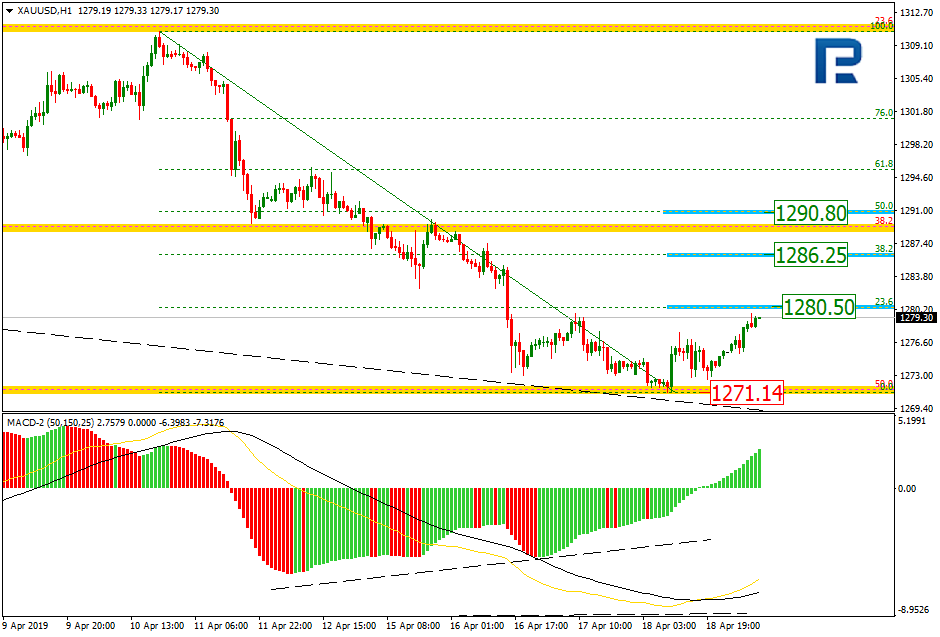
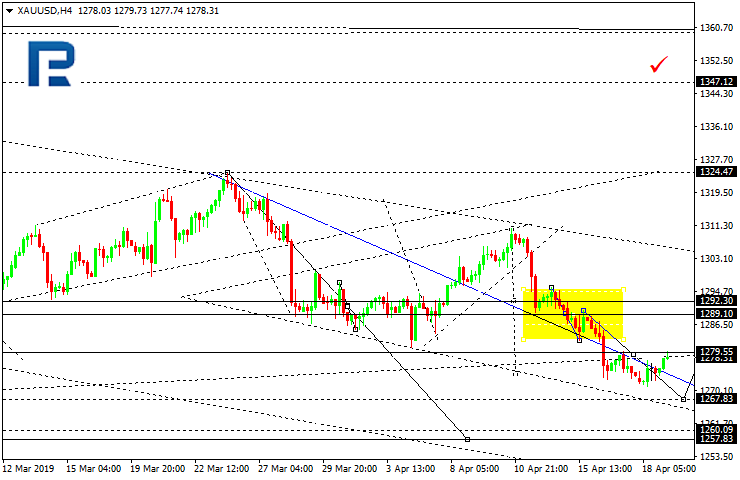
XAUUSD, “Gold vs US Dollar”
Gold is consolidating around 1275.50 near the lows. If later the price breaks range to the upside, the instrument may be corrected to test 1289.10 and then resume trading inside the downtrend with the short-term target 1260.00; if to the downside – start a new decline to reach the above-mentioned target and then resume trading upwards to return to 1289.10.
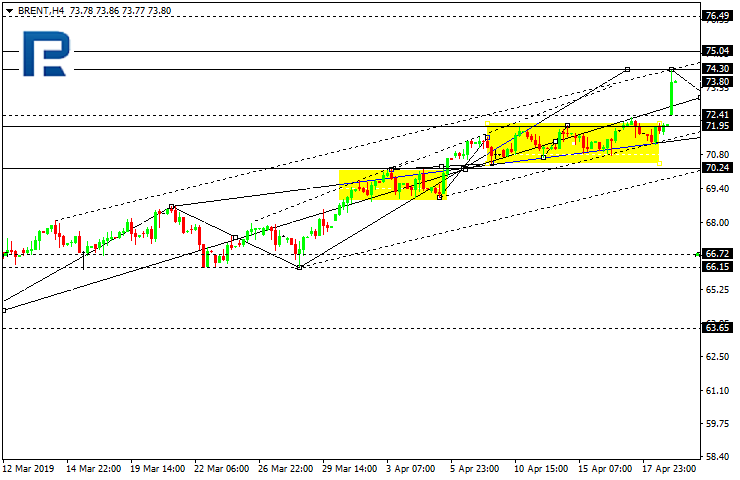
BRENT
After a gap up, Brent has extended the ascending structure and reached the target. According to the main scenario, the price is expected to form a new consolidation range near the highs. If later the price breaks range to the upside, the instrument may reach 75.05; if to the downside – start a new correction towards 71.95 and then form one more ascending structure with the target at 76.50.
Article By RoboForex.com
Attention!
Forecasts presented in this section only reflect the author’s private opinion and should not be considered as guidance for trading. RoboForex LP bears no responsibility for trading results based on trading recommendations described in these analytical reviews.