On Tuesday the 23rd of April, the euro dropped to 1.1192 against the US dollar. Trading on the pair closed at the 1.1227 mark, but pressure on the euro remains as a result of the collapse of the Aussie dollar this morning.
The greenback made ground against the majors following the publication of housing data. These figures suggest a pickup in economic growth, which in turn reduces the likelihood of interest rates being lowered by the Fed. Traders are now looking ahead to US GDP data for Q1 on Friday.
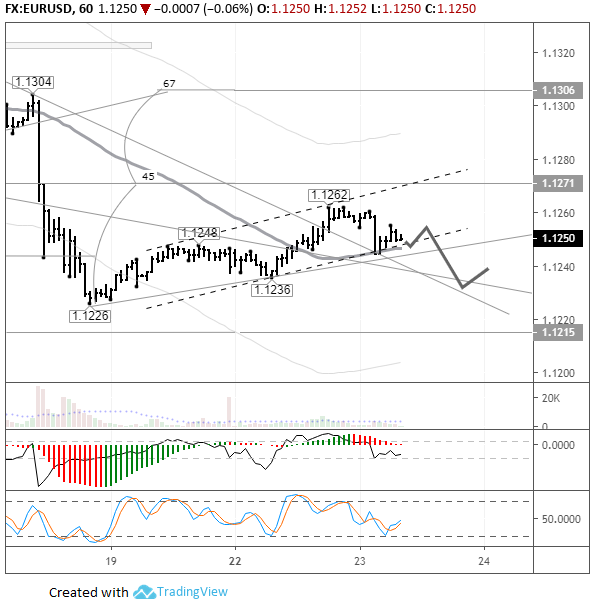
On Tuesday, US data helped the bears revisit the 1.1226 low. The pair then rebounded from the 112th degree and the support (drawn from the 1.1179 and 1.1184 lows).
In the Asian session, the drop recommenced on the back of the Aussie dollar’s collapse, which occurred as a result of weak CPI data for Q1. Following this, demand for short positions on USD shot up. Investors began hedging their bets against a further drop on AUD based on expectations that the RBA will lower interest rates at next month’s meeting.
A session low was recorded at 1.1201. There’s a risk of dropping even lower. The big players will want to activate all the stop levels below the support before opening their long positions and heading north. In my forecast, I expect a recovery to the trend line at 1.1242. The 45th degree is sitting at 1.1245. I can’t see the pair going any higher than this.
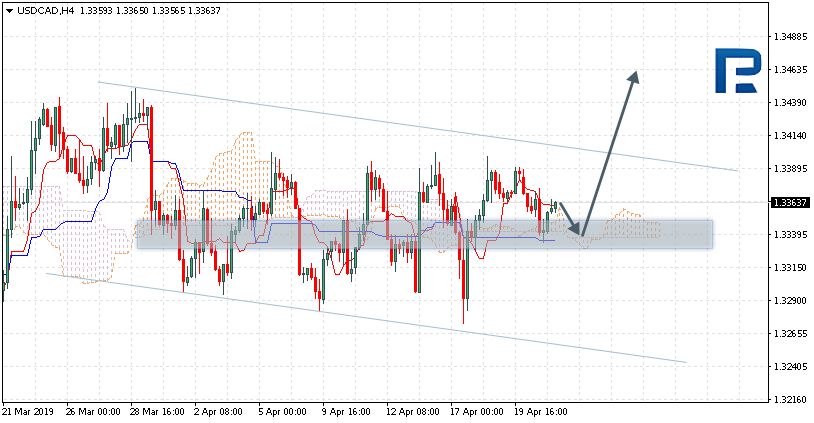
As we can see in the H4 chart, USDCAD is still trading close to the support level and forming Hammer and Engulfing reversal patterns. Judging by the previous movements, it may be assumed that after finishing its sideways movement the instrument may resume trading upwards.
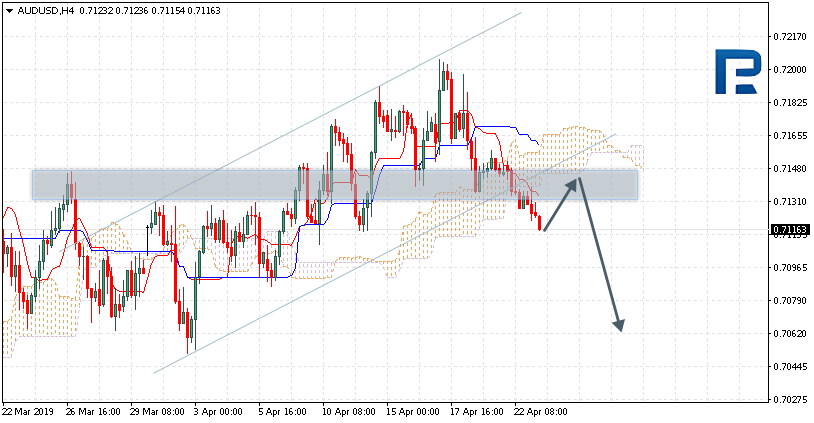
AUDUSD, “Australian Dollar vs US Dollar”
As we can see in the H4 chart, AUDUSD has finished another correction close to the support level and formed several Inverted Hammer and Harami reversal patterns. Judging by the previous movements, right now it may be assumed that after finishing another pullback the instrument may continue its growth.
Attention! Forecasts presented in this section only reflect the author’s private opinion and should not be considered as guidance for trading. RoboForex LP bears no responsibility for trading results based on trading recommendations described in these analytical reviews.
AUDUSD is trading at 0.7116; the instrument is moving below Ichimoku Cloud, thus indicating a descending tendency. The markets could indicate that the price may test the downside border of the cloud at 0.7140 and then resume moving downwards to reach 0.7065. Another signal to confirm further descending movement is the price’s rebounding from the resistance level. However, the scenario that implies further decline may be cancelled if the price breaks the upside border of the cloud and fixes above 0.7185. In this case, the pair may continue growing towards 0.7265.
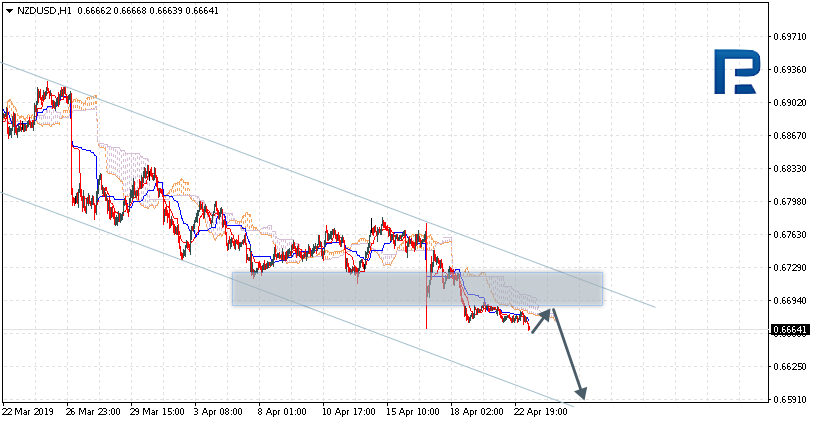
NZDUSD, “New Zealand Dollar vs US Dollar”
NZDUSD is trading at 0.6664; the instrument is moving below Ichimoku Cloud, thus indicating a descending tendency. The markets could indicate that the price may test the downside border of the cloud at 0.6680 and then resume moving downwards to reach 0.6590. Another signal to confirm further descending movement is the price’s rebounding from the resistance level. However, the scenario that implies further decline may be cancelled if the price breaks the upside border of the cloud and fixes above 0.6710. In this case, the pair may continue growing towards 0.6805.
USDCAD, “US Dollar vs Canadian Dollar”
USDCAD is trading at 1.3363; the instrument is moving above Ichimoku Cloud, thus indicating an ascending tendency. The markets could indicate that the price may test the upside border of the cloud at 1.3340 and then resume moving upwards to reach 1.3465. Another signal to confirm further ascending movement is the price’s rebounding from the support level. However, the scenario that implies further growth may be cancelled if the price breaks the downside border of the cloud and fixes below 1.3310. In this case, the pair may continue falling towards 1.3235. After breaking the channel’s upside border and fixing above 1.3420, the price may continue moving upwards.
Attention! Forecasts presented in this section only reflect the author’s private opinion and should not be considered as guidance for trading. RoboForex LP bears no responsibility for trading results based on trading recommendations described in these analytical reviews.
Bitcoin will imminently test the crucial $6,000 price support, building confidence on the wider cryptocurrency market, affirms the CEO of one of the world’s largest independent financial advisory organizations.
The observation from Nigel Green of deVere Group comes as over the past 24 hours, the price of Bitcoin price has recorded an increase of 4.3 per cent.
In the past month, it has jumped from $3,900 to $5,630 – almost 40 per cent.
Mr Green says: “Technical analysis, including long-term indicators such as the Moving Average Convergence Divergence and the Exponential Moving Average are showing signs that Bitcoin is ready to hit the critical $6,000 level.
“Further bullish impetus for Bitcoin may also be provided from a so-called ‘golden cross’ – which is when the 50-day moving average pushes beyond the 200-day moving average.
“Anecdotally too, it seems the broader sentiment is definitely turning decidedly more bullish amongst crypto traders. Many of even the most strident bears appear to be flipping.
“I believe we will see many retail and institutional investors who have been sitting on the sidelines now unleashing their investment in the crypto market.”
He continues: “A new breakout of $6,000 by Bitcoin – the largest, most dominant digital currency – can be expected to fuel an accumulation period and will further boost confidence in the wider sector.
“Once this confidence is in place, the sky is the limit for cryptocurrencies, which are increasingly accepted by both retail and institutional investors as the future of money.”
He goes on to say: “I recently forecast that we could reasonably see the Bitcoin price hitting $7,000 in the next few months. The expected $6,000 test is, of course, a major step in reaching this level.”
The deVere Group CEO concludes: “The fundamentals of Bitcoin, and cryptocurrencies more generally, are stronger than ever.
“It’s still too early to accurately say that Bitcoin is now in bull market territory – but the evidence for this trend is increasing day by day.
“Once the $6,000 level is reached it will set the positive direction of travel for the rest of 2019.”
About:
deVere Group is one of the world’s largest independent advisors of specialist global financial solutions to international, local mass affluent, and high-net-worth clients. It has a network of more than 70 offices across the world, over 80,000 clients and $12bn under advisement.
Yesterday the trading on the majors was relatively calm. The financial markets in Australia, Hongkong and other major countries were closed due to the holidays. The USD index #DX closed the trading session with a slight descend. The pressure on USD was caused by the weak real estate market report from the US. Right now the EUR/USD quotes are consolidating at 1.12350-1.12600. The EUR has a tendency to descend further. You should open positions from the key levels.
Today the investors will evaluate the new real estate sales in US for March at 17:00 (GMT+3:00).
The indicators do not provide precise signals, the price has crossed 50 MA.
The MACD histogram is close to 0.
The Stochastic Oscillator is in the neutral zone, the %K line is crossing the %D line. There are no signals at the moment.
Trading recommendations
Support levels: 1.12350, 1.12000
Resistance levels: 1.12600, 1.12800, 1.13000
If the price fixes below 1.12350, expect further descend toward 1.12000.
Alternatively, the quotes can recover toward 1.12800-1.12900.
The GBP/USD currency pair
Technical indicators of the currency pair:
Prev Open: 1.29848
Open: 1.29812
% chg. over the last day: -0.09
Day’s range: 1.29749 – 1.29903
52 wk range: 1.2438 – 1.4378
GBP keeps its positions agains the USD. The technical picture remains ambiguous. The financial market participants are waiting for additional drivers. GBP/USD is testing the local support and resistance leves at 1.29750-1.30000. You should open positions from these levels. Expect the real estate from the US today and track the info regarding Brexit.
The Economic News Feed for 23.04.2019 is calm.
The price fixed below 50 MA and 200 MA which points to the power of the buyers.
The MACD histogram is in the negative zone but above the signal line which gives a weak signal to sell GBP/USD.
The Stochastic Oscillator is in the neutral zone, the %K line is below the %D line which points to the bearish mood.
Trading recommendations
Support levels: 1.29750, 1.29400, 1.29000
Resistance levels: 1.30000, 1.30200, 1.30350
If the price fixes below 1.29750, expect the quotes to fall toward 1.29500-1.29300.
Alternatively, the quotes can recover toward 1.30300-1.30500.
This article reflects a personal opinion and should not be interpreted as an investment advice, and/or offer, and/or a persistent request for carrying out financial transactions, and/or a guarantee, and/or a forecast of future events.
The USD/CAD currency pair is moving sideways. There is no defined trend. The demand for CAD remains high due to a bullish oil market. The WTI futures are the highest they’ve been since October 2018. The key support and resistance levels are 1.33400 and 1.33700. The USD/CAD quotes have a tendency to descend. You should open positions from the key levels.
The indicators do not provide precise signals, the price has crossed 50 MA and 200 MA.
The MACD histogram is close to 0.
The Stochastic Oscillator is in the neutral zone, the %K line is crossing the %D line. There are no signals at the moment.
Trading recommendations
Support levels: 1.33400, 1.33150, 1.32850
Resistance levels: 1.33700, 1.34000
If the price fixes above 1.33400, expect the quotes to fall towards 1.33000.
Alternatively, the quotes can grow toward 1.34000-1.34200.
The USD/JPY currency pair
Technical indicators of the currency pair:
Prev Open: 111.863
Open: 111.919
% chg. over the last day: +0.02
Day’s range: 111.652 – 111.976
52 wk range: 104.56 – 114.56
USD/JPY remains ambiguous. The technical instrument is moving sideways, the key support and resistance levels are 111.650 and 112.000. The USD/JPY quotes have a tendency to descend. Keep an eye on the real estate market and the US Treasury bonds yield. Open the positions from the key levels.
The Economic News Feed for 23.04.2019 is calm.
The indicators do not provide precise signals, the price has crossed 50 MA and 200 MA.
The MACD histogram is in the negative zone but above the signal line which gives a weak signal to sell USD/JPY.
The Stochastic Oscillator is in the neutral zone, the %K line is above the %D line which points towards a bullish mood.
Trading recommendations
Support levels: 111.650, 111.450, 111.250
Resistance levels: 112.000, 112.150, 112.500
If the price fixes above 111.650, expect further descend towards 111.400-111.200.
Alternatively, the quotes can grow towards 112.300-112.500.
The ES and NQ are very close to breaking out to new all-time highs this week and possibly over the next few weeks. The NQ is very close to these new high levels already. Traders must not take this move for granted as increased volatility and a very real chance for a price correction become even greater once we break into “new high territory”.
This upside move has taken almost 5 months to climb back from the December 2018 lows. It has been a very dramatic rally to say the least. We’ve seen dozens of professional analysts suggest the markets would rotate lower all the way up this rally. It seems as though everyone wanted to be right that the market top in October 2018 was going to be the start of something big. We were one of the few analysts that called the market accurately. Our September 17, 2018 analysis called for almost every leg of this price swing over the past 7+ months. We stuck by our research while others were skeptical and doubting our research. We stuck to it because we believe in our work and modeling tools.
Now, our modeling tools are suggesting we could be setting up for a pretty big increase in volatility over the next 2~3 months with the potential for bigger price rotation into May/June 2019. As we are reading our modeling system results, the key elements are that price will achieve new all-time highs, the price will increase in volatility and Gold should begin an upside price move over the next 2~5+ weeks. The move in Gold suggests one of two things may happen, or both. The US Dollar may weaken or the US stock market may correct a bit based on some economic event or outside foreign economic event.
Either way, the move in Gold suggests that increased volatility is almost a sure thing over the next 60 to 90 days. The only reason Gold would rise is if there is some increased fear factor throughout the planet in regards to the protection of assets and fear of some unknown event. Therefore, if our analysis is correct and Gold does rise as we have indicated, then something is about to create a big increase in volatility.
The key to all of this is that the ES and NQ will move into NEW HIGH territory before this volatility increase begins to become apparent.
This ES Weekly chart shows just how close the ES (S&P500 Futures) are too new all-time highs. The ES needs to climb another 41 points (+1.41%) before it touches the previous all-time high levels. That is really only one of two good upside days. Once it breaks the 2947 level, then the 3000 psychological level becomes a very real target.
This NQ Weekly chart shows that the NQ is really just inches away from breaking to new all-time highs. The NQ only needs to rally 24.50 points (+0.31%) before the 7731 level is breached. We believe this move will happen very early this week and we could see the NQ push all the way above the 8000 level in short order. Our Fibonacci price modeling system is suggesting 9130 and 9625 levels may become the ultimate highs – but it is still very early to tell at this stage of our research.
Back in July and August 2018, we started warning that the end of 2018 and all of 2019 were going to be very good years for skilled traders. We’ve seen a nearly 3800+ point price swing in the NQ and a +1200 point price swing in the ES. Let’s face it, folks, these are very big moves and if you had been capable of trading these moves efficiently, this is the type of price rotation that makes millionaires out of average traders.
Get ready, because the rest of 2019 and almost all of 2020 are going to be just as exciting to trade so be sure to get our trade signals.
We’ll see you on the other side of “new all-time highs” for the US Stock market here soon.
The US dollar did not change a lot against the basket of major currencies amid low trading activity. Investors took a wait-and-see attitude before the publication of important economic releases from the US at the end of this week. The dollar index (#DX) closed in the negative zone (-0.20%). It also became known that the Fed officials began discussing possible conditions, upon the occurrence of which they would start lowering the base interest rate. Chicago Fed President, Charles Evans, believes that if inflation is stable below 2%, this will mean that the current rate of monetary policy is retaining, and then the rate will have to be lowered.
The Brexit delay could seriously affect the financial standing of the European Union. If the UK remains in its composition after the May elections to the EU Parliament, the bloc will be forced to pay salaries to the British deputies. This means additional expenses of 21 million euros.
Demand for safe assets due to tension regarding Iran has increased. It should be recalled that US President Donald Trump decided not to extend all Iran sanction waivers which would end by May 2. In turn, Iran has threatened to close the Strait of Hormuz, if Tehran cannot use it because of US restrictions.
The “black gold” prices continue to show positive dynamics. Oil quotes have updated annual highs again, which supports the demand for commodity currencies. At the moment, futures for the WTI crude oil are testing $66.00 per barrel. At 23:30 (GMT+3:00) API weekly crude oil stock will be published.
Market Indicators
Yesterday, there was a variety of trends in the US stock market: #SPY (+0.09%), #DIA (-0.18%), #QQQ (+0.28%).
The 10-year US government bonds yield is at the level of 2.58-2.59%.
On Monday the 22nd of April, trading on the euro closed slightly up. An upwards correction restored the pair to 1.1262. As the Easter holidays continued, currency markets got a boost from developments in the oil market. Brent oil rose by 3.5% to 74.50 USD per barrel. This surge was caused by reports that Washington is set to stop providing exemptions from Iranian oil sanctions. This news also pushed the Canadian dollar up, bringing a few other currencies with it.
Day’s news (GMT+3):
15:30 Canada: wholesale sales (Feb).
16:00 US: housing price index (Feb).
17:00 US: new home sales (Mar), Richmond Fed manufacturing index (Apr).
17:00 Eurozone: consumer confidence (Apr).
23:30 US: API weekly crude oil stock (19 Apr).
Current situation:
With a thin market, the bulls managed to push through to 1.1262. A correction occurred within a relatively narrow price range. At the time of writing, the pair is sitting around the balance line and the lower boundary of the channel. The current pricing model is bearish.
In Asia, all the majors are trading down against the greenback. The euro crosses are showing mixed dynamics. I’m forecasting a drop to 1.1230/35 as traders return to work following the long Easter weekend.
I reckon we’ll get a proper upwards correction on the euro after revisiting the 1.1226 low. Even if the pair stays in the 1.1240 – 1.1265 range today, I’ll still expect a decline. If the bears don’t make new lows on Wednesday, then I’ll switch to the bull camp.
Saudi Arabia, the world’s top oil exporter and OPEC’s largest producer, has influenced the oil market and oil flows since the middle of the 20th century.
Shortly after the 21st century began, one of Saudi Arabia’s key customers made its first steps toward becoming one of the Kingdom’s main competitors on the global oil market: the United States began fracking for oil in the mid-2000s. By the end of the 2010s, the U.S. is now the world’s biggest crude oil producer, having surpassed Russia and Saudi Arabia to claim the crown.
Sure, Saudi Arabia is one of the most important factors in global crude trade and oil market participants are lapping up every word and hint from the top oil officials in the Kingdom.
But as the U.S. has started to rely on fewer imported barrels, Saudi Arabia’s power to sway the market has diminished. Another large Saudi customer, China, now has more leverage over Saudi Arabia’s oil flows, Dafna Maor, a columnist for Israeli newspaper Haaretz, writes.
U.S. crude oil imports from all over the world have declined from their peak of 10.126 million bpd in 2005, while imports from Saudi Arabia have also been down in recent years, to average below 1 million bpd in 2017, for the first time since 2009, according to the latest EIA data. Meanwhile, U.S. production is breaking records, despite a slowdown in shale growth in recent months as a result of the 40-percent oil price slump in the fourth quarter of 2018.
In recent years, the Saudis have had stiff competition in what is now the world’s largest oil importing nation, China. In the past three years, Saudi Arabia has lost its status of China’s number-one supplier—to none other than its ally in the OPEC/non-OPEC production cut deal, Russia.
Saudi Arabia is the world’s largest oil exporter, but its dominance over the global oil market has started to crack in recent years. Now the Kingdom influences the market and oil prices as much as (or probably less than) the Permian basin in West Texas does, Haaretz’s Maor argues.
The Saudis don’t want to lose control over OPEC’s oil production policies, which the cartel publicly says are always aimed at a “balanced oil market”, while many OPEC members, including the de facto leader Saudi Arabia, actually need oil prices at least as high as their budget-balance needs. In Saudi Arabia’s case, this is around $80 a barrel Brent Crude or slightly higher.
At the same time, Saudi Arabia claims it wants to diversify its economy away from over-reliance on oil.
As per OPEC figures, the oil and gas sector generates around 50 percent of Saudi Arabia’s gross domestic product (GDP), and accounts for some 70 percent of its export earnings.
The so-called Vision 2030 by Crown Prince Mohammed bin Salman has grand plans about billions upon billions of U.S. dollars in investments into the Saudi economy and renewable energy. Ironically, the Kingdom relies on proceeds from oil, including from the much-hyped but still-on-hold listing of 5 percent in its oil giant Aramco, to fund the transformation.
Yet, until this transformation begins to take place, if at all, Saudi Arabia is aggressively pursuing long-term downstream deals in the world’s fastest-growing oil demand center, Asia, with the goal to lock in future demand for its crude oil.
Aramco has signed in recent months a number of agreements in China to take part in refinery projects. One of the latest deals, buying a 9-percent stake in Zhejiang Petrochemical’s 800,000-bpd integrated refinery and petrochemical complex in Zhoushan, says that “Saudi Aramco’s involvement in the project will come with a long-term crude supply agreement and the ability to utilize Zhejiang Petrochemical’s large crude oil storage facility to serve its customers in the Asian region.”
Despite plans to transform its economy from over-reliance on crude oil and despite gradually losing its dominant position as the single biggest oil price mover, Saudi Arabia is not willing to give up its geopolitical and market power that comes with its current status of the world’s largest oil exporter.
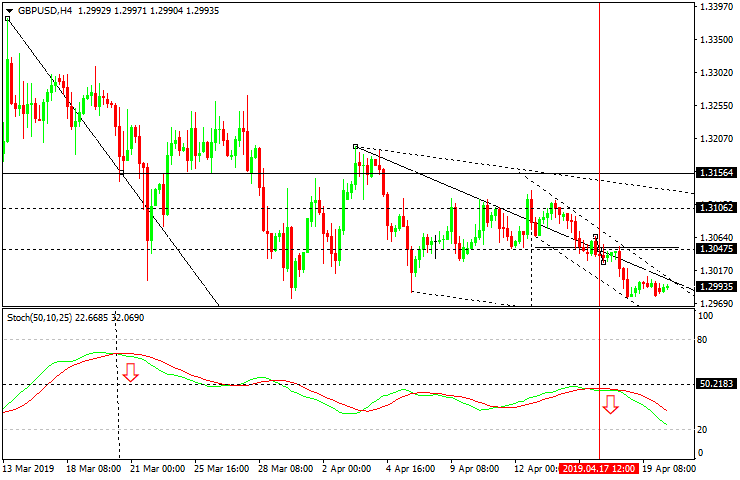
Last week, the Pound was trading downwards against the USD, but the beginning of this one has been marked by calm movements close to 1.30.
The Brexit news keeps coming, but it is not as tensed as earlier. Last week, it became known that the British Prime Minister Theresa May was still under significant pressure due to upcoming to the European parliament and possible complications with another alternative exiting scenario. The British policymakers believe that May should act faster, but it is barley possible.
A lot of numbers published by the United Kingdom last week were rather neutral. For example, the Unemployment Rate, which has been quite low for 44 years in a row – an excellent result. At the same time, the Average Earnings Index added 3.5% 3m/y, the same as expected, which is also a very good signal.
The CPI was 1.9% y/y in March against the expected reading of 2.0% y/y. Both investors and economists believed the indicator would improve much faster, thus supporting the Pound. However, the inflation situation is currently looking pretty calm and stable.
In the H4 chart, GBPUSD is trading downwards. The market has broken the support level at 1.3045 and right now is still moving inside the downtrend. The current descending wave has the potential to reach 1.2900 – this scenario is confirmed by Stochastic Oscillator, which is expected to reverse early in May.
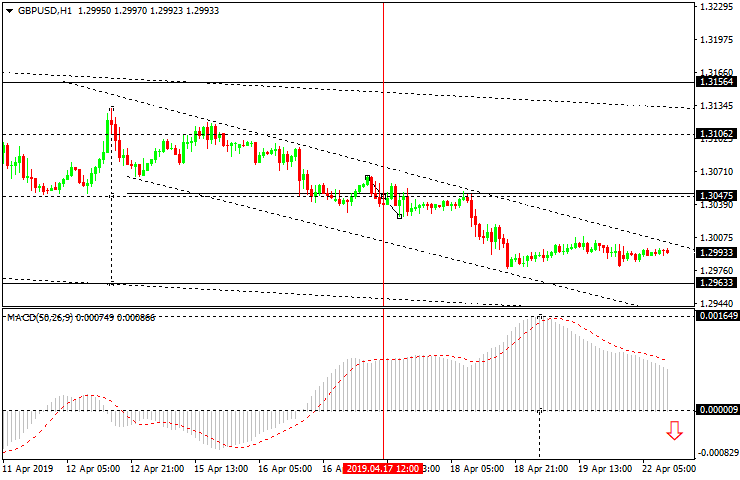
As we can see in the H1 chart, the descending wave continues towards the support level at 1.2963. After reaching it, the price may start a new correction towards 1.3045. MACD’s breaking the zero level may serve as an additional indicator of the decline and force the market to continue the trend down to 1.2900.
Disclaimer
Any predictions contained herein are based on the authors’ particular opinion. This analysis shall not be treated as trading advice. RoboForex shall not be held liable for the results of the trades arising from relying upon trading recommendations and reviews contained herein.