by JustForex
The EUR/USD currency pair
- Prev Open: 1.12017
- Open: 1.11724
- % chg. over the last day: -0.26
- Day’s range: 1.11706 – 1.11842
- 52 wk range: 1.1111 – 1.2009
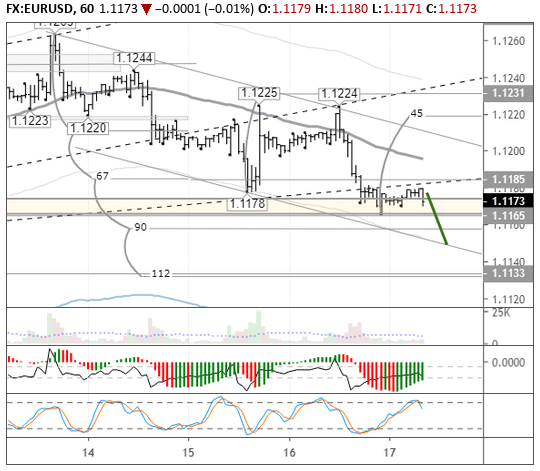
EUR/USD started to descend and updated the local minimums. The demand for USD grew after the release of positive reports and growth of the 10-year US Treasury bonds yield. The investors are waiting for more data regarding the trading agreement between the US and China. The local support and resistance levels are 1.11650 and 1.11850. EUR has prospects for further descend
The Economic News Feed for 17.05.2019:
- – Consumer Price Index (EU) – 12:00 (GMT+3:00);
- – Expectation Index by the University of Michigan (EU) – 17:00 (GMT+3:00);

The price fixed below 50 MA and 200 MA which points to the power of the sellers.
The MACD histogram is in the negative zone but above the signal line which points toward selling GBP/USD.
The Stochastic Oscillator is in the neutral zone, the %K line is below the %D line which points towards a bearish mood.
- Support levels: 1.11650, 1.11500, 1.11200
- Resistance levels: 1.11850, 1.12000, 1.12200
If the price fixes below 1.11650, expect further descend toward 1.11500-1.11200.
Alternatively, the quotes can recover toward 1.12000-1.12200.
The GBP/USD currency pair
- Prev Open: 1.28413
- Open: 1.27919
- % chg. over the last day: -0.42
- Day’s range: 1.27760 – 1.27978
- 52 wk range: 1.2438 – 1.3631
GBP/USD keeps showing a stable trend. Yesterday GBP updated the local minimums once more. Since the beginning of the month, it lost around 2% of its value. The investors are worried about Brexit, especially since Theresa May is rumoured to leave the office in the summer. Keep an eye on this issue and open positions from the key levels of 1.27700-1.28250. The quotes have prospects for further descend.
The Economic News Feed for 17.05.2019 is calm.

The price fixed below 50 MA and 200 MA which points towards the power of the buyers.
The MACD histogram is in the negative but above the signal line which gives a weak signal to sell GBP/USD.
The Stochastic Oscillator is in the neutral zone, the %K line is below the %D line which points towards the bearish mood.
- Support levels: 1.27700, 1.27300, 1.27000
- Resistance levels: 1.28250, 1.28800, 1.29250
If the price fixes below 1.27700, expect further descend toward 1.27300-1.27000.
Alternatively, the quotes can recover toward 1.28600-1.29000.
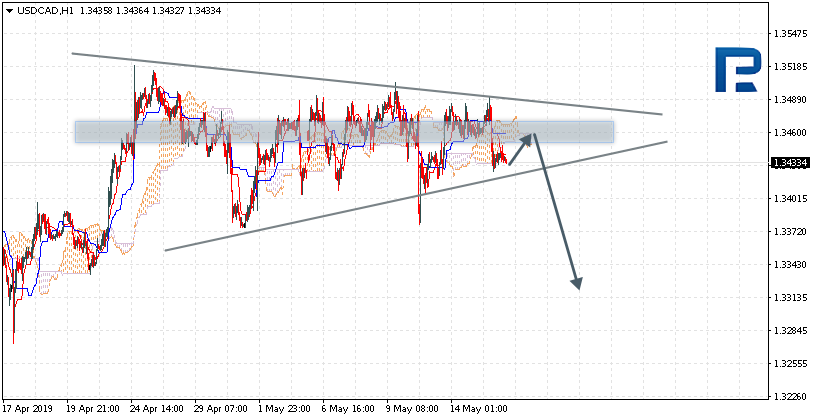
The USD/CAD currency pair
- Prev Open: 1.34369
- Open: 1.34598
- % chg. over the last day: +0.19
- Day’s range: 1.34568 – 1.34814
- 52 wk range: 1.2727 – 1.3664
The last couple of sessions on the currency pair have been very active. At the same time, there is no defined trend. Right now the local support and resistance levels are 1.34550 and 1.34800. The demand for USD is back. Keep an eye on the oil quotes and open positions from the key levels.
The Economic News Feed for 17.05.2019 is calm.

The indicators do not provide precise signals, 50 MA has crossed 200 MA.
The MACD histogram is in the positive zone and above the signal line which gives a strong signal to buy USD/CAD.
The Stochastic Oscillator is in the neutral zone, the %K line is below the %D line which gives a strong signal to buy USD/CAD.
- Support levels: 1.34550, 1.34300, 1.34100
- Resistance levels: 1.34800, 1.35000
If the price fixes above 1.34800, expect further growth toward 1.35000-1.35200.
Alternatively, the quotes can descend toward 1.34300-1.34100.
The USD/JPY currency pair
- Prev Open: 109.584
- Open: 109.834
- % chg. over the last day: +0.27
- Day’s range: 109.542 – 110.033
- 52 wk range: 104.97 – 114.56
USD/JPY remains ambiguous. The trading instrument is moving sideways. Right now the quotes are consolidating around 109.800-110.000 with 109.500 acting as a local support. The quotes can recover further. Keep an eye on the US Treasury bonds, you should open positions from the key levels.
During the Asian trading sessions, Japan published weak reports on the business activity.

The indicators do not provide signals, the price has crossed 50 MA and 200 MA.
The MACD histogram is close to 0.
The Stochastic Oscillator started to leave the oversold zone, the %K line is above the %D line which points to the bullish mood.
- Support levels: 109.500, 109.200, 109.000
- Resistance levels: 109.800, 110.000, 110.300
If the price fixes above 109.800, expect further correction toward 110.200-110.400.
Alternatively, the quotes can fall toward 109.200-109.000.
by JustForex