EURUSD has broken 1.1170; right now, it is still trading downwards. Possibly, today the pair may reach 1.1149 and then grow to test 1.1170 from below. If later the price breaks range to the downside, the instrument may resume trading inside the downtrend to reach 1.1108; if to the upside – start a new correction with the target at 1.1200.
GBPUSD, “Great Britain Pound vs US Dollar”
In case of GBPUSD, the downtrend continues. Possibly, today the pair may reach 1.2676 and then start another correction towards 1.2788. Later, the market may continue trading inside the downtrend with the target at 1.2573.
USDCHF, “US Dollar vs Swiss Franc”
USDCHF is still trading upwards. Today, the pair may form one more ascending structure to reach 1.0132 and then start a new correction towards 1.0108. After that, the instrument may continue growing with the target at 1.0195.
USDJPY, “US Dollar vs Japanese Yen”
USDJPY has reached the short-term target at 110.30. Possibly, today the pair may be corrected towards 109.70 and then start another growth with the target at 110.46.
AUDUSD, “Australian Dollar vs US Dollar”
AUDUSD is moving upwards. Possibly, the pair may be corrected to reach 0.6932 and then form a new descending structure with the target at 0.6822.
USDRUB, “US Dollar vs Russian Ruble”
USDRUB is still moving downwards. Today, the pair may start another correction towards 64.83 and then resume trading inside the downtrend with the short-term target at 64.17.
XAUUSD, “Gold vs US Dollar”
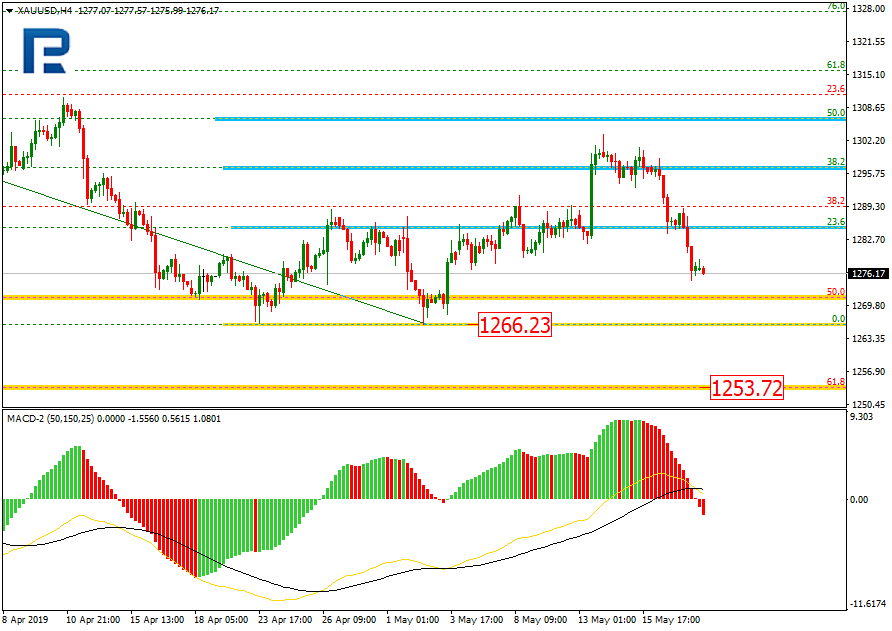
Gold has broken 1280.86. Possibly, today the pair may form one more ascending structure to test this level from below. After that, the instrument may resume trading inside the downtrend with the short-term target at 1266.00.
BRENT
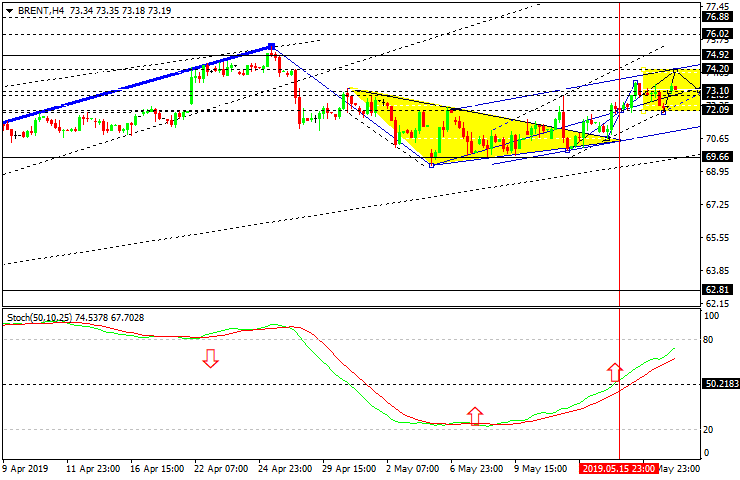
Brent is still moving upwards; it has broken 72.92 and may continue growing towards 74.25. Later, the market may be corrected to reach 72.20 and then resume trading inside the uptrend with the short-term target at 75.80.
Attention! Forecasts presented in this section only reflect the author’s private opinion and should not be considered as guidance for trading. RoboForex LP bears no responsibility for trading results based on trading recommendations described in these analytical reviews.
This morning, the commodity market got a new impulse for growing. Brent is moving upwards on Monday 20th; it added 1.1% and is currently trading at 72.96 USD, although in the morning the highest level was 73.40 USD.
The positive impulse was caused by the comments made by Saudi Arabia Minister of Energy, who said last weekend that countries participants of the OPEC+ were ready to continue limiting oil extraction. Right now, the countries members of the OPEC+ are obeying the agreement that limits daily oil extraction. So far, the agreement was considered to be valid in the first half of 2019, but now it is clear that it will be extended until the end of the year or maybe even longer.
Investors are not expecting any oil shortages, but it’s better to avoid oversupply, which already took place at some moments of this year, as well. For this purpose, the commodity market has the USA with their glut of shale oil production.
Right now, there are strong fundamental factors on the commodity market, which are supporting the positive impulse in Brent. First of all, we’re talking about the US sanctions against Iran and Venezuela – reduction of oil extraction in these counties leads to oil prices growth. Limitations set by the OPEC+ are also in favor of bulls. In opposition, the demand for oil is a little bit decreasing due to slowdown in global economy growth, mostly because of trade wars between the USA and China.
As we can see in the H4 chart, after breaking 72.25 upwards, Brent may continue growing to reach 74.50. Also, the pair has tested the broken level from above. Right now, is trading to rebound from it to the upside and consolidating above 72.25. Possibly, the price may update 73.73 and then form a new descending structure towards 72.50. After that, the instrument may start a new growth with the short-term target at 75.50. This scenario is confirmed by Stochastic Oscillator, as its signal line is steadily moving upwards. However, this scenario may be no longer valid if the pair breaks 72.00 downwards. In this case, the correction may continue to reach 68.00.
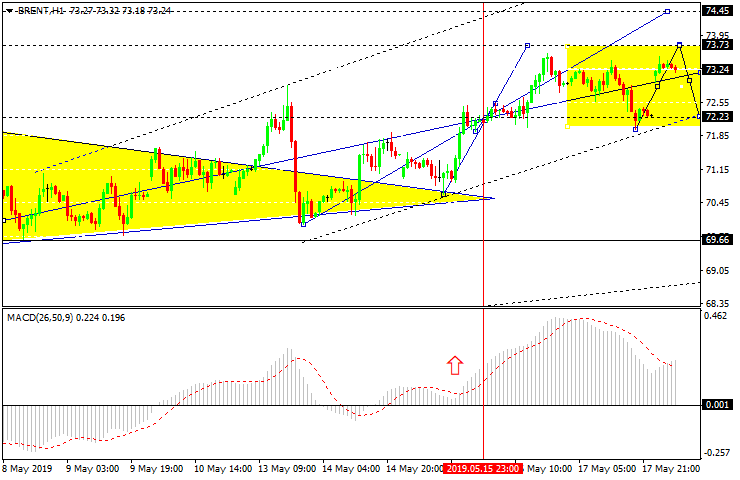
In the H1 chart, Brent is steadily growing towards 73.73. Possibly, the pair may reach it and then start a new correction with the intermediate target at 74.50. Later, the market may consolidate around this level and then resume growing to reach 76.50. This scenario is confirmed by Stochastic Oscillator, as its signal line is reversing and moving upwards to reach the “overbought area”. However, this scenario may be no longer valid if the pair breaks 72.00 to the downside. In this case, the instrument may continue the correction towards 68.00.
Disclaimer
Any predictions contained herein are based on the authors’ particular opinion. This analysis shall not be treated as trading advice. RoboForex shall not be held liable for the results of the trades arising from relying upon trading recommendations and reviews contained herein.
As we can see in the H4 chart, after completing the correction, XAUUSD is forming another wave to the downside, which has already reached the retracement of 38.2%. The next target may be the retracement of 50.0%. The current decline is heading towards the low at 1266.23. If the price breaks it, the instrument may continue falling towards the mid-term retracement of 61.8% at 1253.72.
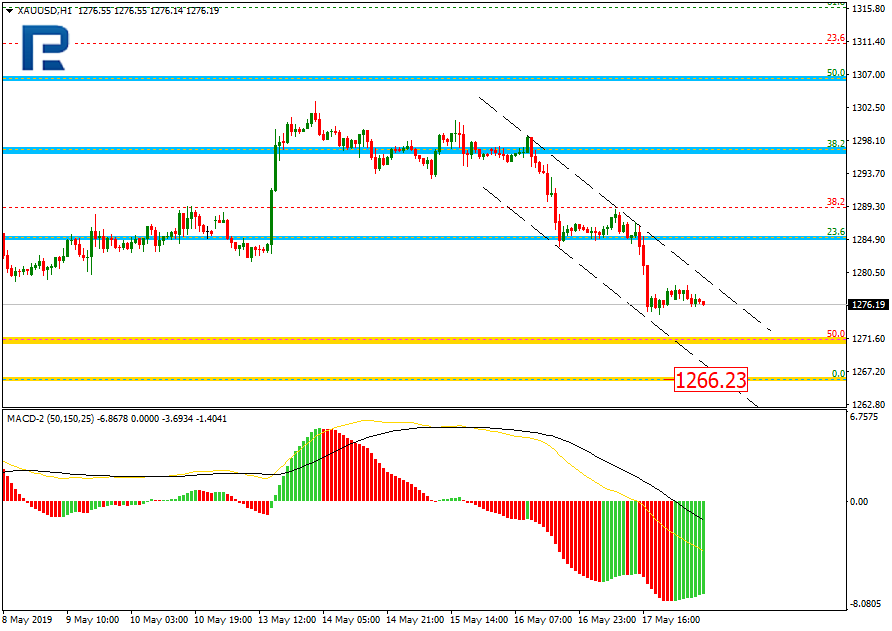
In the H1 chart, the pair is trading downwards steadily. The target is the low at 1266.23. After that, the instrument may start a new pullback.
USDCHF, “US Dollar vs Swiss Franc”
As we can see in the H4 chart, after reaching the retracement of 50.0%, USDCHF started a short-term pullback to the upside. The next downside targets may be the retracements of 61.8% and 76.0% at 1.0025 and 0.9976 respectively. However, the pullback may transform into a new rising impulse; the possible target is the high at 1.0236.
As we can see in the H1 chart, the current rising correction has already reached the retracement of 38.2%. The next upside targets may be the retracements of 50.0% and 61.8% at 1.0138 and 1.0159 respectively. At the same time, there is a divergence on MACD, which may indicate a trend reverse towards the low at 1.0050.
Attention! Forecasts presented in this section only reflect the author’s private opinion and should not be considered as guidance for trading. RoboForex LP bears no responsibility for trading results based on trading recommendations described in these analytical reviews.
EUR/USD keeps showing a negative trend. Right now the instrument is consolidating around the monthly minimums. The key support and resistance are at 1.11500 and 1.11700. The demand for the USD remains high. The financial market participants are waiting for additional drivers. The EU parliament elections will happen this week. You should open positions from the key levels.
Today the investors will evaluate the statements by the FOMC representatives.
The price fixed below 50 MA and 200 MA which points to the power of the sellers.
The MACD histogram is in the negative zone but above the signal line which gives a weak signal to sell EUR/USD.
The Stochastic Oscillator is in the neutral zone, the %K line is above the %D line which points to the bullish mood.
Trading recommendations
Support levels: 1.11500, 1.11200, 1.11000
Resistance levels: 1.11700, 1.11850, 1.12000
If the price fixed below 1.11500, expect further descend toward 1.11200-1.11000.
Alternatively, the quotes can recover toward 1.11850-1.12000.
The GBP/USD currency pair
Technical indicators of the currency pair:
Prev Open: 1.27919
Open: 1.27303
% chg. over the last day: -0.60
Day’s range: 1.27242 – 1.27573
52 wk range: 1.2438 – 1.3631
GBP/USD remains in a bearish mood. GBP reached the 5-month minimums relative to the USD. Right now the quotes are consolidating around 1.27150-1.27700. The financial market participants are waiting for new info regarding Brexit. A technical correction is possible soon. You should open positions from the key leves.
The Economic News Feed for 20.05.2019 is calm.
The price fixed below 50 MA and 200 MA which points to the power of the buyers.
The MACD histogram is in the negative zone but above the signal line which gives a weak signal to sell GBP/USD.
The Stochastic Oscillator is in the neutral zone, the %K line is above the %D line which points towards a bullish mood.
Trading recommendations
Support levels: 1.27150, 1.26500
Resistance levels: 1.27700, 1.28250, 1.28800
If the price fixes below 1.27150, expect further descend toward 1.26800-1.26600.
Alternatively, the quotes can recover toward 1.28250-1.28500.
USD/CAD started to descend. The trading instrument updated the local minimums. The CAD is supported by the positive oil quotes. Right now the local key levels are at 1.34200 and 1.34450. The trading instrument has a tendency to descend further. The financial market participants are waiting for important reports from Canada later this week. You should open positions from the key levels.
The Economic News Feed for 20.05.2019 is calm.
The price fixes below 200 MA, which points towards the power of the sellers.
The MACD histogram is in the negative zone and below the signal line which points toward a strong signal to sell USD/CAD.
The Stochastic Oscillator is in the neutral zone, the %K line is crossing the %D line. There are no signals.
Trading recommendations
Support levels: 1.34200, 1.34000, 1.33800
Resistance levels: 1.34450, 1.34650, 1.34850
If the price fixes below 1.34200, expect further descend toward 1.34000-1.33800.
Alternatively, the quotes can grow toward 1.34700-1.34850.
The USD/JPY currency pair
Technical indicators of the currency pair:
Prev Open: 109.834
Open: 110.103
% chg. over the last day: +0.20
Day’s range: 110.015 – 110.319
52 wk range: 104.97 – 114.56
USD/JPY started to recover after a long fall. The trading instrument have set the new local maximums. The quotes are consolidating around 110.000-110.300. Today, during the asian trading session, Japan has published an optimistic GDP report. However, USD/JPY has prospects for further correction. Keep an eye on the US Treasury Bonds’ yield. You should open positions from the key levels.
Keep an eye on the statements by the FOMC representatives.
The price fixed above 50 MA and 200 MA which points towards the power of the buyers.
The MACD histogram is in the positive zone but below the signal line which gives a weak signal to buy USD/JPY.
The Stochastic Oscillator is in the neutral zone, the %K line is crossing the %D line which provides no signals.
Trading recommendations
Support levels: 110.000, 109.750, 109.500
Resistance levels: 110.300, 110.700
If the price fixes above the resistance level of 130.300 which points towards a further correction toward 110.600-110.800
Alternatively, the quotes can fall toward 109.750-109.500.
Our research team, at www.TheTechnicalTraders.com, have been pouring over the charts and data to identify what is likely to happen over the next 60+ days in terms of global stock market volatility vs. the US stock market expectations. Recently, we posted a research article highlighting our Adaptive Dynamic Learning (ADL) predictive modeling system on the Transportation Index (https://www.thetechnicaltraders.com/markets-rally-hard-is-the-volatility-move-over/). This research suggests we are still going to experience increased price volatility over the next 30 to 60+ days and that price rotation may become somewhat of a normal expectation throughout the rest of 2019.
We believe the key to understanding price volatility over the next 30+ days lies in understanding the potential causes of uncertainty and capital shifts that are taking place around the globe.
Next week, On May 23~26, 2019, the European Elections take place (https://www.telegraph.co.uk/politics/0/european-elections-2019-uk-vote-date-results/). This voting encompasses all 26 EU nations where all 753 European Parliament seats may come into question. The biggest issues are BREXIT and continue EU leadership and economic opportunities for members. The contentious pre and post-election rancor could drive wild price swings in the global markets over the next 10+ days.
A tough stance between both nations, the United States and China, have left trade talks completely unresolved (https://www.reuters.com/article/us-usa-trade-china/chinas-tough-trade-rhetoric-leaves-talks-with-u-s-in-limbo-idUSKCN1SN207). At this point, the currency market is attempting to absorb much of the future expectations while the US/China stock markets react to immediate news events and perceived future economic outcomes. Overall, until this issue is resolved for both nations, the news cycles will likely drive increased price volatility across the global markets.
The US 2020 Presidential Elections are ramping up with over 24 Democratic potentials attempting to unseat President Trump. The current new from DC regarding the continued DOJ investigations and political posturing regarding Barr, Nadler and a host of other DC actors is setting up for a “cliff hanger” outcome over the next 12+ months. This will likely become one of the most hotly contested US Presidential election events in decades. The news of investigations, political corruption, and a potential US political “coup” attempt is certain to keep everyone guessing over the next 2+ years.
The markets are reacting to this volatility by attempting to adjust valuations expectations and future economic outcomes in multiple forms; currency price valuations (attempting to adjust to a shifting future economic landscape as well as to attempt to mitigate risk/capital/credit issues), Stock Market price valuations (attempting to further mitigate risk/capital and credit issues, and debt rates (attempting to effectively price risk and output expectations for the future).
Here is a map of the Currency Market over the past 12 months. We can see the dramatic shift that has taken place since the price peak in February 2018.
Overall, the US Dollar has continued to strengthen over the past 12+ months and is regaining the “King Dollar” status as the global uncertainty continue to plague foreign and EU markets. We don’t expect this to change in the near future.
Our continued research into the current price rotation in the US and global markets suggest that we are going to continue to experience moderately high price volatility across all markets over the next 30 to 60+ days – possibly well into the end of 2019. As we suggested, above, the uncertainty relating to the multiple election events and global trade/geopolitical events do not present a foundation of calm and collected future guidance. The only thing we can suggest regarding these future expectations is that the US and more mature global markets should be able to navigate these uncertain times much more effectively than emerging or “at risk” foreign markets.
Below, you will see a global Heat-Map spanning one week. Traders should take special notice that certain EU countries are surviving the recent global price rotation quite well (France, Netherlands, Switzerland, Ireland, Germany, and others). We believe this is the result of the fact that these economies are rather mature and consistent in their output and expectations. Pay attention to the South American, Asian and Caribbean nations. It would appear that a fairly strong price contraction is taking place throughout much of these nations as the focus shifts towards the more mature markets.
The following One Month global Heat-Map highlights a slightly different economic picture for some nations, yet confirms the shorter-term (weekly) trends for many others. Bermuda, Cayman, Germany, and Switzerland appear to be the Bullish Leaders over the past 30 days while the rest of the globe appears to be slipping into Bearish price trends. Canada and the UK appear moderately mixed with some green showing on the heat-map – which would be expected as both of these nations are considered mature global economies with strong economic ties to the US.
We believe the next 10~30+ days are going to be filled with moderate price volatility and we expect a setup in the global markets, near the end of June 2019, where a massive price volatility explosion may take place. This could be correlated with some trade issue, some fallout of the EU elections or some breakdown in credit/debt risks taking place between now and September 2019. We’ll go into more detail in Part II of this research post.
This is proving to be an incredible trading year for traders who follow our trade alerts newsletter.
For active swing traders, you are going to love our daily trading analysis. On May 1st we talked about the old saying goes, “Sell in May and Go Away!” and that is exactly what is happening now right on queue. In fact, we closed out our SDS position on Thursday for a quick 3.9% profit and our other new trade started Thursday is up 18% already.
Second, my birthday is only three days away and I think its time I open the doors for a once a year opportunity for everyone to get a gift that could have some considerable value in the future.
Right now I am going to give away and shipping out silver rounds to anyone who buys a 1-year, or 2-year subscription to my Wealth Trading Newsletter. I only have a few more left as they are going fast so be sure to upgrade your membership to a longer-term subscription or if you are new, join one of these two plans, and you will receive:
1-Year Subscription Gets One 1oz Silver Round FREE (Could be worth hundreds of dollars)
2-Year Subscription Gets TWO 1oz Silver Rounds FREE (Could be worth a lot in the future)
I only have a few more silver rounds I’m giving away so upgrade or join now before its too late!
Last week, the greenback strengthened against a basket of world currencies. The dollar index (#DX) reached two-year highs and closed in the positive zone. Positive economic releases, as well as the growth of the US government bonds yield supported the US currency. The British pound is still under pressure. Financial market participants are concerned that Prime Minister Theresa May will not be able to approve her Brexit deal and may soon face a leadership problem. Investors expect up-to-date information regarding trade negotiations between Washington and Beijing.
Today, during the Asian trading session, positive data on Japan’s GDP have been published. In the first quarter, the economy grew by 0.5%. Experts expected a decline by 0.1%. EU citizens will elect their candidates to the European Parliament from May 23. Investors will assess the last Fed meeting minutes, as well as important economic releases from the US, UK, Canada and the Eurozone.
Oil quotes show positive dynamics. At the moment, futures for the WTI crude oil are testing $63.75 per barrel.
Market Indicators
On Friday, the bearish sentiment prevailed in the US stock market: #SPY (-0.65%), #DIA (-0.66%), #QQQ (-1.02%).
The 10-year US government bonds yield is recovering. Currently, the indicator is at the level of 2.40-2.41%.
The news feed on 2019.05.20:
Today we recommend paying attention to the speeches by the FOMC representatives.
By Tomasz Wiśniewski, Chief analyst at Alpari Research & Analysis
‘Sell in May and go away’. This is a saying that still applies to stocks, even despite last week’s rise. It definitely applies to the Euro, which recently headed south and is now very close to the monthly lows. In the case of the Euro, the problem lies in the potential trade wars between the EU and the US. The European Union is next in the queue (after China) to be targeted by the revisionist trade approach taken by Trump’s administration. What is more, we also have the case of Iran, where the EU is not as hostile towards the Persians as the Americans. This creates additional pressure from Washington, with more threats and doubts.
These are the fundamentals from the geopolitical point of view, so what about the macro economy? In this context, the Euro Zone can be described as a snail. The economy is not contracting but neither is it doing particularly well. Rather it is vegetating, which is not very promising if we think about the forthcoming crisis that will happen at some point as part of the normal cycle. This analysis is looking at the EURJPY, so what about the second currency in the pair, the JPY? Firstly, the Yen has recently been gaining traction thanks to the risk-off mode (as it is seen as a safe haven currency). In addition, Japan released its GDP figures today, which surprisingly denied any contraction and showed quite an impressive rise (by Japanese standards). To summarize, the fundamentals are, in theory, negative for the EURJPY.
This is confirmed by the technical analysis. However there is a bit of light in the tunnel and it is not from the train. The EURJPY is still in a downwards trend (black) and below the crucial horizontal resistance (yellow), but the price has made an inverse head and shoulders pattern (pink), which may indicate the start of a reversal. Buyers have already managed to break the green neckline of this formation, which is very optimistic. I would be rather cautious here and before buying, make sure that the price has broken through the black down trendline. Only if the EURJPY is above these dynamic resistances would it be an interesting bullish opportunity.
Currency Point: Intra – week movers EUR / USD – Medium term view $1.09
I remain solid in my view that EUR / USD is trending lower over the coming period. This is in the main, due to its carry trade funding position it finds itself in. However, there is an interesting intra – week long trade building as trades cash in on the bloating in short positioning – could see a short rebound.
This chart shows that short positions are heavy with the cash position sitting at E13.26 billion, which is the highest level and its been since December 2016. This data is slightly old; however, the trends shows that shorts have continued to build in the past 7 days suggesting a new 3-year record.
We are thus mindful of a short squeeze in the pair, considering the backdown from the President over the mid-May tariff threat on Euro-automakers the unwind could go all week and see EUR/USD back above $1.12. intra-week long call on the pair targeting $1.12.
AUD / USD –That escalated quickly
I backed off my AUD / USD short call to early, my reasoning was that the RBA looked like it would hold off cutting rates until the middle part of the year on the back of making employment core to its reasoning.
That has now been blown away, the employment data of last week will all but force the RBA to cut rates sooner than expected. I still hold a contrarian view that it will hold off cutting until August, but the market is now pricing in a 63% chance of a rate cut in June its fully priced in by the August meeting.
This led the pair to plumb a new 4-month low of 68.8c last week as the central bank differential hit its largest in years and a theme that is likely to dominate for most of 2019.
However, there are two factors that are likely to see the AUD/USD recover some of this ground in the interim. First is China, most of the headlines of late has been around the trade issues with the US. However what might have been missed is the PBOC’s move on the yuan, its weakness has slowed the AUD’s fall as China is stimulating again. There is a caveat here the PBOC knows that if USD/CNH hits 7.00 outflows ramp up something China will look to avoid but any stimulus from China is an AUD positive.
The second is the news from Vale that it is facing further issues with its dams and its iron ore output in 2019 is under real threat. BHP, RIO and FMG spiked on this news last week and iron ore prices have begun to bounce. If copper follows suit in the coming days risk currency will follow them higher.
Thus, calling a very short-term long call on the AUD/USD, shorts will unwind and commodity markets are likely to lift, looking for a return to high 69c trading a stop at 67.95.
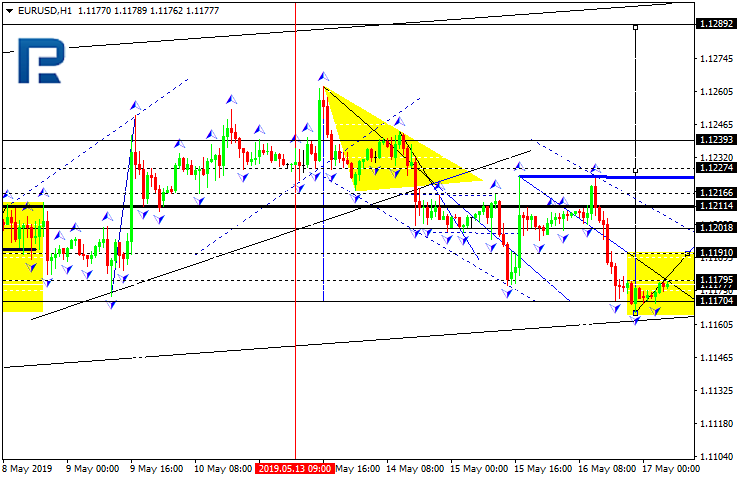
EURUSD has completed the descending structure at 1.1170; right now, it is consolidating near the lows. Possibly, the pair may break it upwards and start a new growth to test 1.1212 from below. After that, the instrument may resume trading inside the downtrend with the target at 1.1190.
GBPUSD, “Great Britain Pound vs US Dollar”
In case of GBPUSD, the downtrend continues towards 1.2720. Possibly, the pair may reach 1.2750 and then start another correction towards 1.2852. Later, the market may continue trading inside the downtrend with the short-term target at 1.2720.
USDCHF, “US Dollar vs Swiss Franc”
USDCHF has reached its short-term target at 1.0105. Today, the pair may fall towards 1.0082 and then form one more ascending structure to reach 1.0114. After that, the instrument may start a new decline with the target at 1.0033.
USDJPY, “US Dollar vs Japanese Yen”
USDJPY has broken 109.69. Possibly, the pair may be corrected towards 110.19 and then start another decline to return to 109.69. Later, the market may form one more ascending structure with the target at 110.32.
AUDUSD, “Australian Dollar vs US Dollar”
AUDUSD is still moving downwards with the target at 0.6844. Possibly, today the pair may reach 0.6868 and then start a new correction towards 0.6898. Later, the market may continue trading inside the downtrend to reach the above-mentioned target.
USDRUB, “US Dollar vs Russian Ruble”
USDRUB is still moving downwards with the short-term target at.64.17. After that, the instrument may be corrected towards 64.83 and then resume trading inside the downtrend to reach 64.00.
XAUUSD, “Gold vs US Dollar”
Gold has reached its short-term target at 1283.93. Possibly, today the pair may start another correction towards 1292.30. After that, the instrument may form a new descending structure to reach 1281.61 and then continue growing with the target at 1292.25.
BRENT
Brent is still moving upwards; it has broken 72.72 and right now is consolidating around it. Possibly, the pair may continue growing with the short-term target at 75.20. Later, the market may return to 72.72 and then resume trading inside the uptrend to reach 76.55.
Attention! Forecasts presented in this section only reflect the author’s private opinion and should not be considered as guidance for trading. RoboForex LP bears no responsibility for trading results based on trading recommendations described in these analytical reviews.
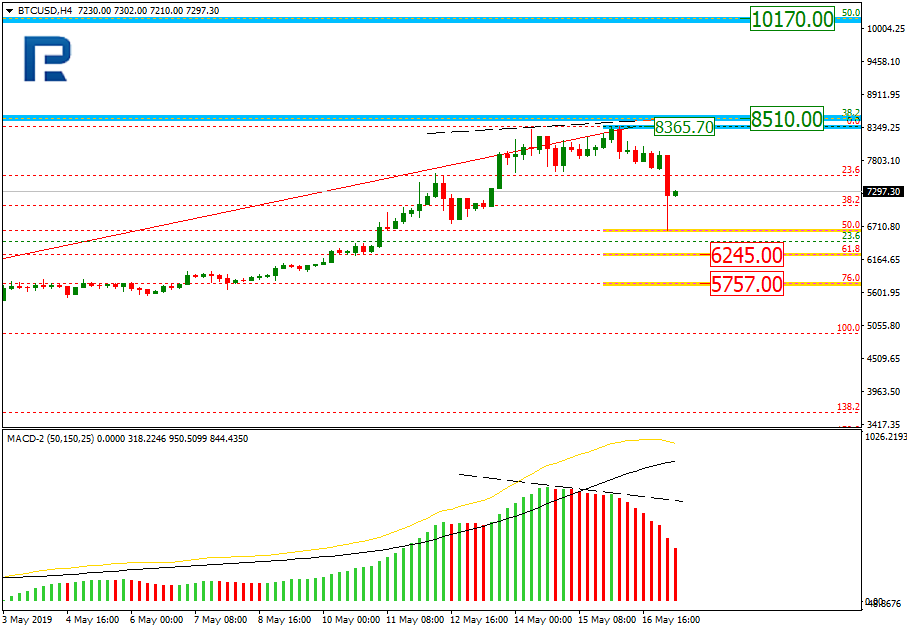
In the H4 chart, BTCUSD is quickly getting closer towards the long-term retracement of 38.2% at 8510.00. At the moment, we ca see a short-term downtrend after the divergence, which has already reached the retracements of 50.0%. After finishing the correction, the pair may continue moving upwards. After breaking the current high at 8365.70, the instrument may reach the retracements of 38.2% and 50.0% at 8510.00 and 1017000 respectively.
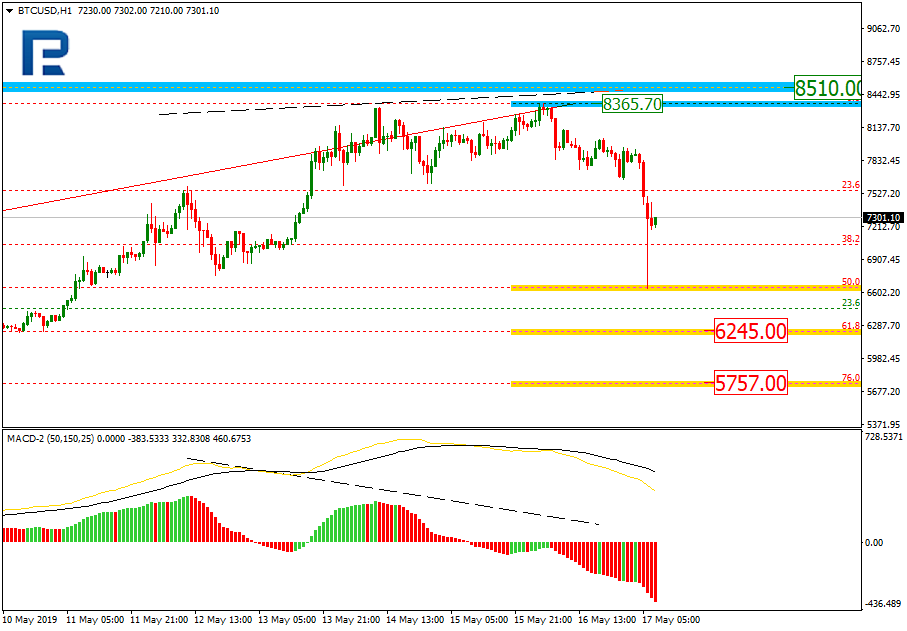
The H1 chart shows more detailed structure of the correction. After reaching the retracement of 50.0%, the pair slowed down it decline. However, it may yet continue towards the retracements of 61.8% and 76.0% at 6245.00 and 5757.00 respectively.
ETHUSD, “Ethereum vs. US Dollar”
As we can see in the H4 chart, ETHUSD is forming another correction after reaching the long-term retracement of 23.6%. The correction has already reached the retracement of 38.2%. After finishing the correction, the instrument may start a new rising wave to break the high at 279.90.
In the H1 chart, ETHUSD is being corrected downwards. The next downside targets may be the retracements of 50.0% and 61.8% at 213.13 and 197.52 respectively.
Attention! Forecasts presented in this section only reflect the author’s private opinion and should not be considered as guidance for trading. RoboForex LP bears no responsibility for trading results based on trading recommendations described in these analytical reviews.