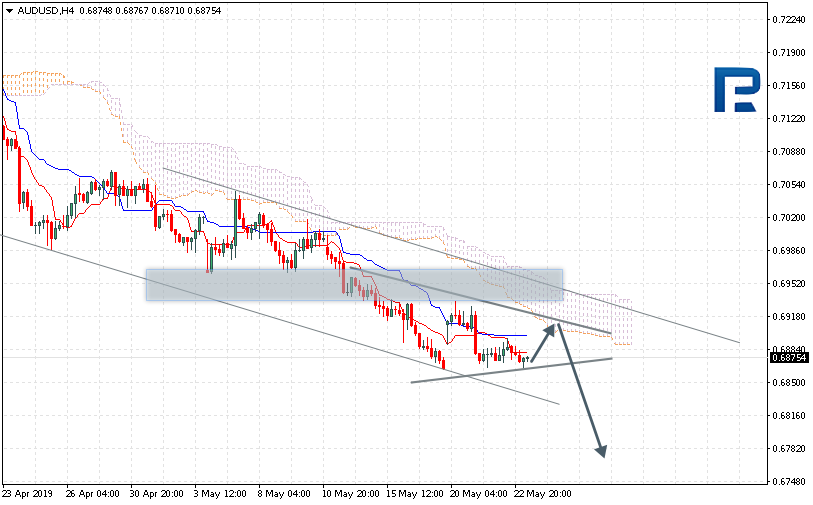
AUDUSD is trading at 0.6875; the instrument is moving below Ichimoku Cloud, thus indicating a descending tendency. The markets could indicate that the price may test the upside border of the cloud at 0.6895 and then resume moving downwards to reach 0.6780. Another signal to confirm further descending movement is the price’s rebounding from the Triangle’s upside border. However, the scenario that implies further decline may be cancelled if the price breaks the upside border of the cloud and fixes above 0.6955. In this case, the pair may continue growing towards 0.7000. After breaking the Triangle’s downside border and fixing below 0.6860, the price may continue moving downwards.
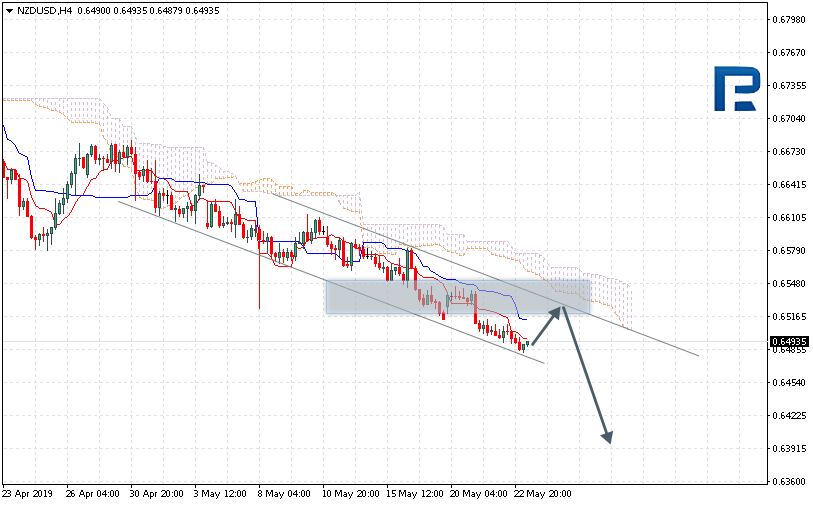
NZDUSD, “New Zealand Dollar vs US Dollar”
NZDUSD is trading at 0.6493; the instrument is moving below Ichimoku Cloud, thus indicating a descending tendency. The markets could indicate that the price may test Tenkan-Sen and Kijun-Sen at 0.6515 and then resume moving downwards to reach 0.6390. Another signal to confirm further descending movement is the price’s rebounding from the channel’s upside border. However, the scenario that implies further decline may be cancelled if the price breaks the upside border of the cloud and fixes above 0.6585. In this case, the pair may continue growing towards 0.6675.
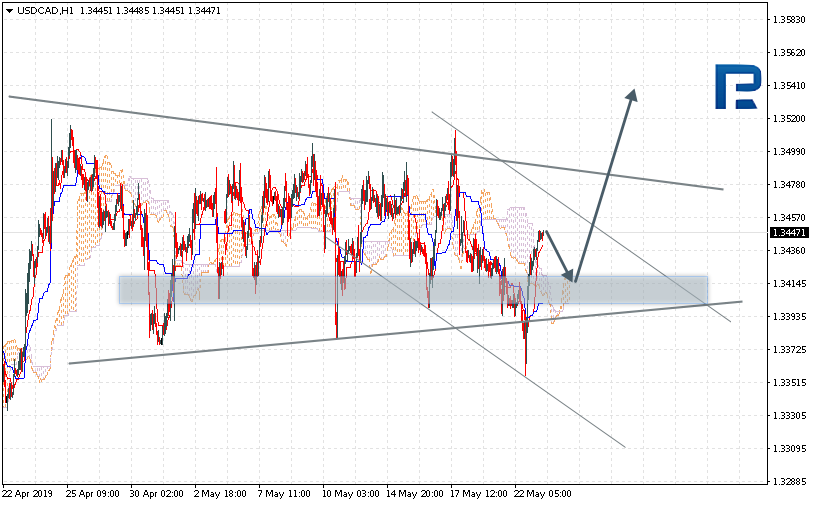
USDCAD, “US Dollar vs Canadian Dollar”
USDCAD is trading inside the Triangle pattern at 1.3447; the instrument is moving above Ichimoku Cloud, thus indicating an ascending tendency. The markets could indicate that the price may test the upside border of the cloud at 1.3415 and then resume moving upwards to reach 1.3540. Another signal to confirm further ascending movement is the price’s rebounding from the support level. However, the scenario that implies further growth may be cancelled if the price breaks the downside border of the cloud and fixes below 1.3365. In this case, the pair may continue falling towards 1.3285. After breaking the Triangle’s upside border and fixing above 1.3505, the price may continue moving upwards.
Attention! Forecasts presented in this section only reflect the author’s private opinion and should not be considered as guidance for trading. RoboForex LP bears no responsibility for trading results based on trading recommendations described in these analytical reviews.
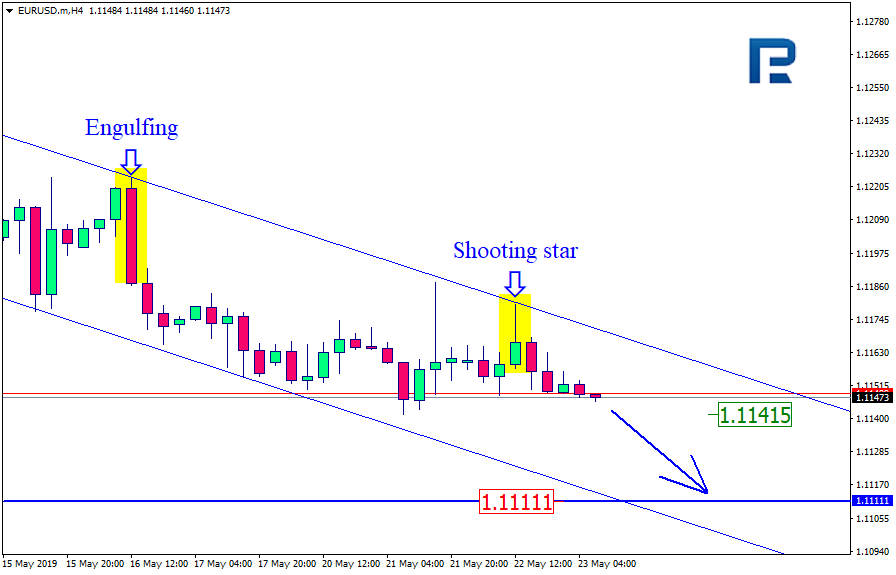
As we can see in the H4 chart, EURUSD is trading downwards. After testing the channel’s upside border, the pair formed Shooting Star pattern; right now, it is falling towards 1.1141. Possibly, later the price may break this level and continue its decline to reach 1.1111.
USDJPY, “US Dollar vs. Japanese Yen”
As we can see in the H4 chart, USDJPY is trading upwards. The pair has tested the channel’s downside border and formed Hammer pattern; right now, it is forming another reversal pattern, Harami, which may indicate a stronger signal to rebound from the support level. The current growth may reach 110.95, which is the resistance level. In the future, the price may start a new correction from this level.
Attention! Forecasts presented in this section only reflect the author’s private opinion and should not be considered as guidance for trading. RoboForex LP bears no responsibility for trading results based on trading recommendations described in these analytical reviews.
EUR/USD started to descend again. The trading instrument updated the local minimums. The pressure on the EUR is caused by the weak economic releases on business activity is Germany and the EU. Right now the attention of the investors is concentrated on the EU Parliament election, which is set to begin today. Keep an eye on this issue. The quotes have prospects for further descend. You should open positions from the key levels.
The Economic News Feed for 23.05.2019:
– Publication of the ECB Monetary Policy Meeting Protocols (EU) – 14:30 (GMT+3:00);
– Number of Primary Jobless Claims (US) – 15:30 (GMT+3:00);
– New Real Estate Sales (US) – 17:00 (GMT+3:00);
The price fixed below 50 MA and 200 MA which points towards the power of the sellers.
The MACD histogram is in the negative zone and keeps falling which points towards a bearish mood.
The Stochastic Oscillator is in the neutral zone, the %K line has crossed the %D line. There are no signals at the moment.
Trading recommendations
Support levels: 1.11300, 1.11000
Resistance levels: 1.11500, 1.11700, 1.11850
If the price fixes below 1.11300, expect further descend towards 1.11000.
Alternatively, the quotes can correct towards 1.11700-1.11900.
The GBP/USD currency pair
Technical indicators of the currency pair:
Prev Open: 1.27047
Open: 1.26516
% chg. over the last day: -0.34
Day’s range: 1.26052 – 1.26658
52 wk range: 1.2438 – 1.3631
GBP/USD keeps showing a negative trend. The trading instrument is close to the round 1.26000. 1.26550 acts as a local resistance. GBP is under pressure due to the Brexit situation. Theresa May can announce her resignation soon. GBP/USD has prospects for a further descend. You should open positions from the key levels.
At 11:30 (GMT+3:00) the UK will publish an retail sales report.
The price fixed below 50 MA and 200 MA which points towards the power of the sellers.
The MACD histogram is in the negative zone and below the signal line which points towards selling GBP/USD.
The Stochastic Oscillator is in the oversold zone, the %K line has crossed the %D line. There are no signals at the moment.
Trading recommendations
Support levels: 1.26000, 1.25500
Resistance levels: 1.26550, 1.27000, 1.27550
If the price fixes below 1.26000, expect further descend towards 1.25600-1.25400.
Alternatively, the quotes can recover towards 1.27000-1.27200.
The USD/CAD currency pair
Technical indicators of the currency pair:
Prev Open: 1.34018
Open: 1.34356
% chg. over the last day: +0.24
Day’s range: 1.34315 – 1.34635
52 wk range: 1.2727 – 1.3664
USD/CAD is in a bullish mood. The trading instrument updated the local maximums. USD/CAD are consolidating around 1.34400-1.34650. CAD is under pressure due to the negative trends on the oil quotes. The trading instrument has further prospects for growth. Keep an eye on the US economic trends and open positions from the key levels.
The Economic News Feed for 23.05.2019 is relatively calm.
The price fixed above 50 MA and 200 MA which points towards the power of the buyers.
The MACD histogram is in the positive zone and above the signal line which recommends buying USD/CAD.
The Stochastic Oscillator is in the neutral zone, the %K line is crossing the %D line. There are no signals at the moment.
Trading recommendations
Support levels: 1.34400, 1.34200, 1.34000
Resistance levels: 1.34650, 1.34850, 1.35100
If the price fixes above 1.34650.
Alternatively, the quotes can descend towards 1.34200-1.34000.
The USD/JPY currency pair
Technical indicators of the currency pair:
Prev Open: 110.484
Open: 110.333
% chg. over the last day: -0.26
Day’s range: 110.102 – 110.365
52 wk range: 104.97 – 114.56
USD/JPY stabilized. There is no defined trend. The quotes are testing the local support and resistance levles at 110.100 and 110.350. The demand on the safe assets remains high due to the ambiguousness in the US/China trading negotiations. The trading instrument has a tendency to descend. Keep an eye on the US Treasury bonds’ yield and open positions from the key levels.
The Economic News Feed for 23.05.2019 is calm.
The indicators do not provide precise signals, the price fixed between 50 MA and 200 MA.
The MACD histogram is in the negative zone and keeps falling which gives a strong signal to sell USD/JPY.
The Stochastic Oscillator is in the neutral zone, the %K line is below the %D line which points towards a bearish mood.
Trading recommendations
Support levels: 110.100, 109.750, 109.500
Resistance levels: 110.350, 110.650
If the price fixes below 110.100, expect the descend of the USD/JPY quotes towards 109.750-109.600.
Alternatively, the quotes can grow towards 110.600-110.800.
The US dollar continues to show positive dynamics against currency majors. The dollar index (#DX) has updated annual highs again. The potential for further growth is still high. According to the FOMC meeting minutes, the Fed plans to adhere to the current monetary policy. The British pound is still under pressure amid uncertainty concerning Brexit. There was information that the Prime Minister of Great Britain Theresa May could announce resignation this Friday. Investors also expect up-to-date information regarding trade negotiations between the US and China.
At the moment, financial market participants are focused on the elections to the European Parliament, which will begin today. In the near future, trading activity and volatility of the euro may increase significantly. German GDP growth in the first quarter of 2019 met market expectations and counted to 0.4%. We also expect important economic releases from the Eurozone, the UK and the US.
Oil quotes are declining amid the growth of oil reserves in the US. At the moment, futures for the WTI crude oil have approached the level of $61.00 per barrel.
Market Indicators
Yesterday, major US stock indices closed in the red zone: #SPY (-0.31%), #DIA (-0.45%), #QQQ (-0.45%).
The 10-year US government bonds yield has been declining. Currently, the indicator is at the level of 2.37-2.38%.
The news feed on 2019.05.23:
– Indices on economic activity in Germany and the Eurozone at 11:00 (GMT+3:00); – Statistics on retail sales in the UK at 11:30 (GMT+3:00); – Publication of the ECB monetary policy meeting account at 14:30 (GMT+3:00); – New home sales in the US at 17:00 (GMT+3:00).
The incredible strength of the US Dollar over the past 12+ months has put downward pricing pressure on Gold and Silver. I believe this downward pricing pressure could be muting any upside price advanced in Gold and Silver by as much as 20% to 30% or more.
The US Dollar has turned into the global “safe-haven” for international investors and foreign governments. Over the past 6 to 12 months, or more, the US Dollar has been the only fiat currency to see any strength and upward trend. All the other major global currency levels have fallen – some dramatically lower.
The EUR, GBP, AUD, CAD, and CHF have all fallen sharply over the past 6 to 12 months as the strength of the US Dollar and US Economy continued to surprise many. We’ve been calling this a “capital shift” that started back in 2015~2016 – when the 2016 US Election cycle began and China began to implement capital controls. At the same time, foreign nations such as Brazil and Venezuela began to shift into an economic abyss while the UK dealt with BREXIT negotiations. All of these external factors created an environment where the US Dollar became a global safe-haven for global investors – all of which were seeking US equities and US Dollars to hedge weakening foreign currencies and weak foreign stock market performance.
I think that the US Dollar strength, in combination with the continued foreign Gold acquisitions has amounted to a resolved “reversion” in Gold prices that could reflect a 10% to 20% price anomaly. In other words, the strength of the US Dollar has muted the advancing price of Gold by our estimates of 2x to 2.5x the strength of the US Dollar. Over the past 12 months, the US Dollar rallied from 89.42 (April 2018) to 97.92 (May 2019: current price). This reflects a 9.60% increase in the value of the US Dollar.
If my research is correct, the price of Gold should have rallied by about 18% to 26% from the April 2018 levels IF the US Dollar had not appreciated in value as it has. Therefore, the true price of Gold should be somewhere near $1600 (18% above April 2018 levels) to $1700 (26% above April 2018 levels) if we attempted to eliminate the “reversion effect” of the US Dollar strength.
We come to this conclusion by statistically analyzing the US Dollar strength after April 2018 and how Gold reacted to this strength – by falling over 12.5% from near $1350 to a level near $1170. That range of time reflected an 8% price advance in the US Dollar. Thus, a ratio of 1.5 to 1 has clearly been established within that move. More recently, from August 2018 till now, the US Dollar has rallied 1.47% while the price of Gold has rallied 8.87%. The current price of Gold is -5.60% below the April 2018 price level.
If we were to assume that the rally in the US Dollar deflated the price appreciation of Gold by nearly equal ratios, then we take the April 2018 price of Gold ($1350) and add the related price variances of Gold over this span (essentially reverting the price of Gold to April 2018 US Dollar levels : $1350 * 1.27) and we end up with $1714.50. This reflects a greater than 30% price anomaly from the current price of Gold.
We need to ask ourselves one simple question, what would it take for Precious Metals and the global stock markets to revert back to these expected price levels? Would it be a move away from the US Dollar? Would it be some shift in foreign currency valuations? Would it be a combination of factors that drive greater fear into the markets and reflect a US Dollar valuation decline? In the second part of this article, I will explore some possibilities and explain why I believe we are just days or weeks away from finding out exactly what will cause this price anomaly to revert along with my proprietary gold price cycle forecast.
I just highlighted the strength of the US Dollar in comparison to other foreign currencies and suggested this US Dollar strength may have created a “price anomaly” setup in Precious Metals – specifically Gold. I believe a very unique setup is happening in the global markets right now and that the price of Gold is substantially undervalued compared to risks that are present throughout the global economies. I believe the strength of the US Dollar has muted the upside potential of Gold by at least 20% to 30% over the past 12+ months and I believe a shift is taking place where Gold is starting to break these pricing constraints.
If the analysis is correct, I believe traders only have about 3~6+ weeks before we’ll find out why and what will cause this price anomaly to revert back to what I believe is “price normalcy”. The strength of the US Dollar, as well as the continued global “capital shift” where foreign investors are piling into the US stock market and US Dollar related investments, have continued to put incredible pricing pressures on Precious Metals. We believe this “shift” may be about to revert back to some levels of normalcy in term of Precious Metals pricing.
I believe a major Pennant/Flag formation is setting up in Gold where this price anomaly event will be resolved. This type of price anomaly reset, or reversion will prompt a massive upside price advance in Gold and Silver that will attempt to restore proper pricing levels to the Precious Metals commodities. I believe we are just weeks away from the completion of this Pennant/Flag apex/breakout event and believe the upside price targets identified align with a series of key events that are likely to unfold over the Summer months of 2019. Take a few minutes to read the recent three-part research post regarding these events and how they relate to the global stock/commodity markets here.
Our predictive modeling systems have been warning that a price advance in Gold and Silver will take place between April/May of 2019 and Aug/Sept or 2019. We are calling this the “initial upside price leg” because we believe this upside price move will be just the beginning of a much larger move higher for Precious Metals. We’ve highlighted some of the biggest concerns we currently have related to the global stock market price appreciation levels and the concerns related to the US Presidential Election cycle in precious articles – Please read them here :
We believe it is imperative to alert all investors/traders of this event and to attempt to allow all investors/traders to plan for what may become one of the biggest global stock market swings in recent history as well as one of the biggest moves in Precious Metals in history.
My proprietary cycle analysis and trade signals are suggesting a mild price recovery in Gold will prompt moderate upside pricing pressure over the next 10~20+ days. This aligns perfectly with our Pennant/Flag formation, see the previous chart. It would be expected that Gold prices would form a moderate price support level near $1270 before moving back up to the upper Pennant price channel, near $1295. Then, price should set up the “Apex Breakout” move – which will likely be a “washout-low” price rotation (somewhere near or below $1270) with a very quick reversal to the upside – breaking $1330 and rallying much higher. This type of rotation is very common and often prompts traders to jump into short positions on the “washout-low” formation before getting clobbered on the reversal/rally. Be prepared.
Lastly, we want to alert everyone to a chart we’ve been following that could become a determining factor for the future of the global stock market levels, the US Dollar and Precious Metals. The one thing we don’t want to see is a massive decline in yield in the 2 Year Treasuries. This would indicate failed growth expectations throughout the globe and, in particular, reflect concerns that the US markets could contract/decline in-line with further global market devaluations.
We’ve already been trying to warn investors that the US Presidential Election cycle will likely create a stalling price pattern in the US stock market. We’ve been warning, for the past 18 months, that Gold is setting up a massive bottom/breakout formation. We’ve recently highlighted the global concerns (Europe, China, US, and others) that may combine to create something like a “perfect storm” for currencies and the global equities markets. If that translates into “yield weakness” in the US Treasuries, think about how that would translate into the Precious Metals “reversion” that we are suggesting is only a few weeks away?
Chart courtesy of www.crescat.net
We strongly urge investors to pay very close attention to our research and prepare for this event. Yes, the Capital Shift event is still taking place and as long as nothing disrupts this shift, capital will continue to flow into the US Dollar and US Equities. Our concern is that the charts are telling us we are very near to the end of this event cycle and we are alerting all of our followers so they can prepare for this move. It may start out mildly – it may not. We do know that our predictive modeling systems are suggesting that July/August 2019 are on our radar for a major price rotation/event.
UNIQUE OPPORTUNITY
First, we typically see stocks sell-off and as the old saying goes, “Sell in May and Go Away!” which is what has been happening.
So what does this mean? It means we should start to see money flow into the safe-haven assets like the Utility sector, bonds, and most importantly precious metals. I anticipated this and our XLU utilities ETF taken with members has already hit our first profit target, and our VIX ETF trade also hit out 15% profit target and we the balance of it is still up 25% as of yesterday.
Second, my birthday was this month, and I think its time I open the doors for a once a year opportunity for everyone to get a gift that could have some considerable value in the future.
For May I am going to give away and ship out silver rounds to anyone who buys a 1-year, or 2-year subscription to my Wealth Trading Newsletter. You can upgrade to this longer-term subscription or if you are new, join one of these two plans listed below, and you will receive:
1-Year Subscription Gets One 1oz Silver Round FREE (Could be worth hundreds of dollars)
2-Year Subscription Gets TWO 1oz Silver Rounds FREE (Could be worth a lot in the future)
I only have 25 silver rounds I’m giving away so upgrade or join now before its too late!
Recent US media reports claim China may depreciate its renminbi to cope with shrinking exports. Yet, economic realities are precisely the reverse. Worse, trade wars are about to hit American consumers.
Recently, the White House lifted tariffs to 25% from 10% on $200 billion of Chinese goods, while targeting another $300 billion worth of Chinese imports for potential punitive tariffs.
As was to be expected, the renminbi depreciated from 6.7 to more than 6.9 against the US dollar, mainly on renewed trade tensions.
China retaliated by imposing duties on $60 billion of US goods, starting June 1. China could have retaliated hard, but opted for a mild response that highlights the importance of talks.
“I love the position we’re in,” President Trump said recently. Yet, the movement of the renminbi may not be to the liking of the White House since it is likely to offset the tariff impact.
Trump tariffs’ impact on Chinese and Asian currencies
Until Trump’s tariff escalation, Chinese renminbi was around 6.80 against the US dollar. That, however, was predicated on the expectation that cooler heads would prevail in the White House and a broad-scale trade war was avoidable. When President Trump opted for tariff escalation, markets reacted quite expectedly. For now, the Chinese currency has only reversed its appreciation year-to-date.
As Trump prepares to raise and broaden US tariffs even more, Chinese renminbi could depreciate more. But that is the White House’s choice, not Beijing’s preference. Indeed, Trump’s tariffs have paced the renminbi fluctuations ever since the start of his trade wars (see Figure).
FigureHow Trump tariffs reverberate in renminbi movementsIn light of these facts, the claim that China is depreciating the renminbi is simply flawed. Depreciation is precisely what China seeks to avoid. When exports shrink, a light depreciation of the currency is of no help. And if the renminbi would depreciate significantly in a short period of time, it would foster worries about capital flight.
That’s why Chinese government has done precisely the reverse: To avoid steeper depreciation and capital outflows, the People’s Bank of China (PBOC) recently set a stronger-than-expected daily fixing of the exchange rate. The central bank is likely to try to keep the renminbi below 7 per dollar.
The depreciation of the renminbi is in line with that of other emerging-Asia currencies that have taken hits, including Indonesian rupiah, Singapore dollar, Malaysian ringgit, the Indian rupee and the exhausted South Korean won. By the same token, Trump’s tariff escalation is likely to cause a negative spillover effect among the same currencies.
Ironically, those countries that may suffer most of the pain – Taiwan, South Korea and Vietnam – are closest US allies in Asia, but also targets for next tariff wars. In the future, Trump seems intent to target Europe, Japan, South Korea and emerging Southeast Asia.
Tariff wars’ collateral damage in the US
A year ago, Larry Kudlow, Trump’s director of National Economic Council, was still gung-ho about US supremacy in the tariff war. Recently, he admitted that American consumers will pay for the Trump trade wars. In the US, his reversal is seen as betrayal of American public, and rightly so. As Washington Post put it, “Trump’s own top economic adviser gives lie to his trade war rhetoric.”
Here are the inconvenient truths: A broad-scale trade war could penalize 0.5% to 0.8% off real US GDP growth, while earnings growth could be shaved off by 3% or more effectively halving the figure. Auto sales are a barometer of what’s to come. In 2019, Chinese auto sales could decline by 3%, but in the US by almost 4%. In 2020, US sales could remain in the red, but Chinese sales could increase – according to US data.
Unsurprisingly, several US lawmakers are finally slamming Trump’s tariff increase on China. In just a year or two, the Trump administration has committed some of the worst trade-policy mistakes in the postwar US history. The resulting economic pain will spread in America as products shipped from China arrive in about three weeks.
The fantasy about a renminbi Plaza Hotel Accord
For a decade or two, Washington has periodically used Chinese renminbi as a scapegoat to distract public spotlight away from rising economic challenges in the US. Yet, the renminbi has been largely in line with fundamentals since the mid-2010s, as the International Monetary Fund (IMF) has affirmed.
However, Trump has a more intimate interest in currency manipulation. Before his firm bought the Plaza Hotel in New York City, he monitored closely the talks that led to the 1985 Plaza Accord. The controversial pact led the US, France, West Germany, the UK and Japan to depreciate US dollar relative to the Japanese yen and Deutsche mark by intervening in the currency markets.
It was that exchange-rate manipulation that played a key role in Japan’s subsequent containment, asset bubbles, deflation, and secular stagnation. And it is the same dream that seems to fuel the Trump trade hawks’ fantasies about China’s containment and stagnation.
Yet, China is not Japan, dreams are just dreams, and the White House is in for an awakening.
About the Author:
Dr. Dan Steinbock is an internationally recognized strategist of the multipolar world and the founder of Difference Group. He has served at India, China and America Institute (US), Shanghai Institutes for International Studies (China) and the EU Center (Singapore). For more, see https://www.differencegroup.net/
The original version was released by China Daily on May 21, 2019.
EURUSD has expanded its consolidation range both upwards and downwards; right now, it is falling to reach 1.1142. Possibly, today the pair may reach it and then grow towards 1.1166, thus forming another consolidation range around 1.1166. If later the price breaks this range to the upside, the instrument may form one more ascending structure to break 1.1188 and then continue the correction towards 1.1212; if to the downside – resume trading inside the downtrend with the short-term target at 1.1070.
GBPUSD, “Great Britain Pound vs US Dollar”
GBPUSD has returned to 1.2800; right now, it is trading to rebound from it to the downside. Considering that the pair broke 1.2720 downwards again, it may fall to reach 1.2686. Later, the market may break this level as well and continue falling with the short-term target at 1.2639. However, if the price breaks 1.2800 to the upside, the instrument may continue the correction to reach 1.2944.
USDCHF, “US Dollar vs Swiss Franc”
USDCHF is still consolidating around 1.0104. Today, the pair may start a new growth towards 1.0118 and then form a new descending structure with the target at 1.0080.
USDJPY, “US Dollar vs Japanese Yen”
USDJPY is moving downwards; it has formed the consolidation range below 110.60. Possibly, the pair may reach 109.88 and then form one more ascending structure with the target at 110.77.
AUDUSD, “Australian Dollar vs US Dollar”
AUDUSD is forming another descending wave towards 0.6860. Possibly, the pair may reach it and then start a new growth towards 0.6896. After that, the instrument may resume trading inside the downtrend with the short-term target at 0.6814.
USDRUB, “US Dollar vs Russian Ruble”
USDRUB is moving downwards. Today, the pair may break 64.39 and then continue falling with the target at 64.14. After that, the instrument may be corrected towards 64.80 and then continue trading inside the downtrend with the short-term target at 63.90.
XAUUSD, “Gold vs US Dollar”
Gold is consolidating around 1273.95. If later the price breaks this range to the upside, the instrument may form one more ascending structure towards 1278.50; if to the downside – resume trading inside the downtrend with the short-term target at 1260.00.
BRENT
Brent is still consolidating around 72.10 without any particular direction. If the price breaks this range to the upside, the instrument may resume trading inside the uptrend with the target at 73.93; if to the downside – continue the correction towards 70.60.
Attention! Forecasts presented in this section only reflect the author’s private opinion and should not be considered as guidance for trading. RoboForex LP bears no responsibility for trading results based on trading recommendations described in these analytical reviews.
As we can see in the H4 chart, another descending wave has broken the retracement of 61.8% and may continue trading downwards. The next target is the retracement of 76.0% at 1.2633. in the nearest future, the instrument may start a new pullback after the convergence.
In the H1 chart, the convergence made the pair start the first rising impulse, which has already reached the retracement of 23.6%. The next impulse will be heading towards the retracements of 38.2% and 50.0% at 1.2873 and 1.2930 respectively. After breaking the local low at 1.2685, the instrument will complete the correction.
EURJPY, “Euro vs. Japanese Yen”
As we can see in the H4 chart, EURJPY is still trading downwards; it reached the retracement of 50.0% and the next target may be the retracement of 61.8% at 121.61. At the same time, there was a convergence on MACD, which indicated a correctional uptrend. By now, it has already reached the retracement of 23.6% and may continue towards 38.2% and 50.0% at 123.89 and 124.45 respectively. The support level is at 122.08.
The H1 chart shows more detailed structure of the current rising correctional tendency.
Attention! Forecasts presented in this section only reflect the author’s private opinion and should not be considered as guidance for trading. RoboForex LP bears no responsibility for trading results based on trading recommendations described in these analytical reviews.
EUR/USD stabilized after a long fall. The trading instrument is consolidating. The market participants are waiting for the FOMC minutes. Keep an eye on the rhetorics of the Central Bank officials, especially since Jerome Powerll mentionted that they aren’t going to force the key interest rates’ change. Right now the key levels are at 1.11450 and 1.11650. You should open positions from the key levels.
At 21:00 (GMT+3:00) the US will publish the FOMC Minutes.
The indicators do not provide precise signals, the price has crossed 50 MA.
The MACD histogram started to descend which points towards further fall of the EUR/USD quotes.
The Stochastic Oscillator is in the neutral zone, the %K line is crossing the %D line. There are no signals at the moment.
Trading recommendations
Support levels: 1.11450, 1.11200, 1.11000
Resistance levels: 1.11650, 1.11850, 1.12000
If the price fixes below 1.11450, expect further descend towards the round 1.11000.
Alternatively, the quotes can correct towards 1.11850-1.12000.
The GBP/USD currency pair
Technical indicators of the currency pair:
Prev Open: 1.27210
Open: 1.27047
% chg. over the last day: -0.15
Day’s range: 1.26617 – 1.27193
52 wk range: 1.2438 – 1.3631
GBP/USD remains in the bearish mood. The trading instrument updated the local minimums. Theresa May is not sure she can convince the lawmakers to accept the updated Brexit agreement. The quotes are testing the support at 1.26600 with the mirror resistance being at 1.27100. They can descend further.
At 11:30 (GMT+3:00) the UK will publish an inflation report.
The price fixed below 50 MA and 200 MA which points towards the power of the sellers.
The MACD histogram is in the negative zone and below the signal line which gives a strong singal to sell GBP/USD.
The Stochastic Oscillator is in the neutral zone, the %K line is below the %D line which points toward a bearish mood.
Trading recommendations
Support levels: 1.26600, 1.26200, 1.26000
Resistance levels: 1.27100, 1.27550, 1.28000
If the price fixes below 1.26600, expect further descend towards 1.26300-1.26000.
Alternatively, the quotes can recover towards 1.27500-1.27800.
USD/CAD remains ambiguous. The trading instrument keeps consolidating. The local support and resistance levels are 1.34000 and 1.34250. The investors are waiting for reports from the US and Canada, as well as the oil quotes dynamics. You should open positions from the key levels.
At 15:30 (GMT+3:00) Canada will publish the retail sales report.
– Economic Event (CAD) – 00:00 (GMT+3:00);
– Economic Event (CAD) – 00:00 (GMT+3:00);
– Economic Event (CAD) – 00:00 (GMT+3:00);
The price fixed below 50 MA and 200 MA which points toward the power of the sellers.
The MACD histogram is in the negative zone but above the signal line which gives a weak signal to sell USD/CAD.
The Stochastic Oscillator is in the neutral zone, the %K line is crossing the %D line. There are no signals at the moment.
Trading recommendations
Support levels: 1.34000, 1.33800
Resistance levels: 1.34250, 1.34450, 1.34650
If the price fixes below the round 1.34000, expect further descend towards 1.33800-1.33600.
Alternatively, the quotes can grow towards 1.34400-1.34600.
The USD/JPY currency pair
Technical indicators of the currency pair:
Prev Open: 110.068
Open: 110.484
% chg. over the last day: +0.46
Day’s range: 110.362 – 110.626
52 wk range: 104.97 – 114.56
USD/JPY started to grow again and updated the local maximums. The key support and resistance levels are 110.300 and 110.650. The quotes can grow further. The market participants are waiting for the FOMC Minutes. Keep an eye on the US Treasury bonds and open positions from the key levels.
During the Asian trading session Japan published weak trading balance reports.
The price fixed above 50 MA and 200 MA which points towards the power of the buyers.
The MACD histogram is in the positive zone but below the signal line which gives a weak signal to buy USD/JPY.
The Stochastic Oscillator is in the neutral zone, the %K line is below the %D line which points towards a bearish mood.
Trading recommendations
Support levels: 110.300, 110.000, 109.750
Resistance levels: 110.650, 111.000
If the price fixes above 110.650, expect further growth towards 111.000.
Alternatively, the quotes can fall towards 110.000-109.750.
The US dollar is rising against a basket of world currencies. The dollar index (#DX) set new annual highs. The US Department of Commerce lifted some of the sanctions on Chinese telecom giant Huawei. This step became a relief for the markets and lowered investors’ concerns about the further escalation of trade tensions between Washington and Beijing. The recovery of the US government bond yield supports the greenback.
At the moment, financial market participants have taken a wait-and-see attitude before the publication of the FOMC minutes. We recommend paying attention to the comments by the Fed representatives. Earlier, the head of the Central Bank Jerome Powell said that the regulator would not rush to change interest rates. The official also mentioned that the Federal Reserve was considering a transition towards a target inflation range instead of the fixed goal that is currently at 2%.
The “black gold” prices have been decreasing amid the growth of oil reserves in the United States, according to API. At the moment, futures for the WTI crude oil are testing the mark of $62.45 per barrel.
Market Indicators
Yesterday, major US stock indices closed in the positive zone: #SPY (+0.90%), #DIA (+0.82%), #QQQ (+1.04%).
The 10-year US government bonds yield has become stable. Currently, the indicator is at the level of 2.41-2.42%.
The news feed on 2019.05.22:
– Consumer price index in the UK at 11:30 (GMT+3:00); – Statistics on retail sales in Canada at 15:30 (GMT+3:00); – Publication of the FOMC meeting minutes at 21:00 (GMT+3:00).