Author Archive for InvestMacro – Page 231

Bitcoin Stalls Near $8100

By TheTechnicalTraders.com

After an incredible 7+week rally in Bitcoin, from $3700 to above $8000, the current price action is setting up for what may become an extended Pennant/Flag formation with quite a bit of sideways trading ahead.

Our researchers believe the past 7+ weeks rally in Bitcoin was prompted by a shift away from risk in Asia/China and into more suitable protection assets.  Cryptos appear to be the easy choice for many as this rally coincided with the April 3rd through 6th US/China trade talks in Washington, DC (https://www.scmp.com/economy/china-economy/article/3004961/us-says-theres-still-significant-work-be-done-trade-talks).  It appears that many investors were preparing for a difficult deadline after the March 1st deadline for a deal was pushed back.  These early April trade talks may have been interpreted as a “do or die” effort from both sides.  Again, shortly after the May 1st US/China trade talks in Beijing, Bitcoin began another rally from the $5200 level all the way up to the $8000 level.

Our contacts, although we admit they are fairly limited in total quantity, have stated the sentiment from locals in China are very pessimistic on the US and President Trump.  A few of our contacts have recently stated they have been laid off or terminated from their jobs and, as we understand, locals have already started to react in a protectionist mode.  This happens when economies contract quickly.  Consumers attempt to protect their wealth and assets by moving any capital they have into something more efficient than their local markets – thus Cryptos.

This Weekly Bitcoin chart highlights areas that we believe our current support and resistance levels.  The $8000~8100 level goes all the way back to the February 2018 low.  This is a critical level for trading as it became a massive price support level back in 2018 – and eventually became critical resistance in July 2018.  Additional resistance is found near $9900.


This Daily Bitcoin chart highlights what we believe are the current Key Highs and Key Lows that will tell us if the next phase will be a continued rally or a breakdown in price.  The Key Low near $7480 must hold for any further upside price advance.  If $7480 is broken, we would expect the next Key Low price to be targeted (near $6200).  Otherwise, if another rally breaks out and price rallies above the Key High, then we could see an upside target range between $9200 to $9700 very quickly.


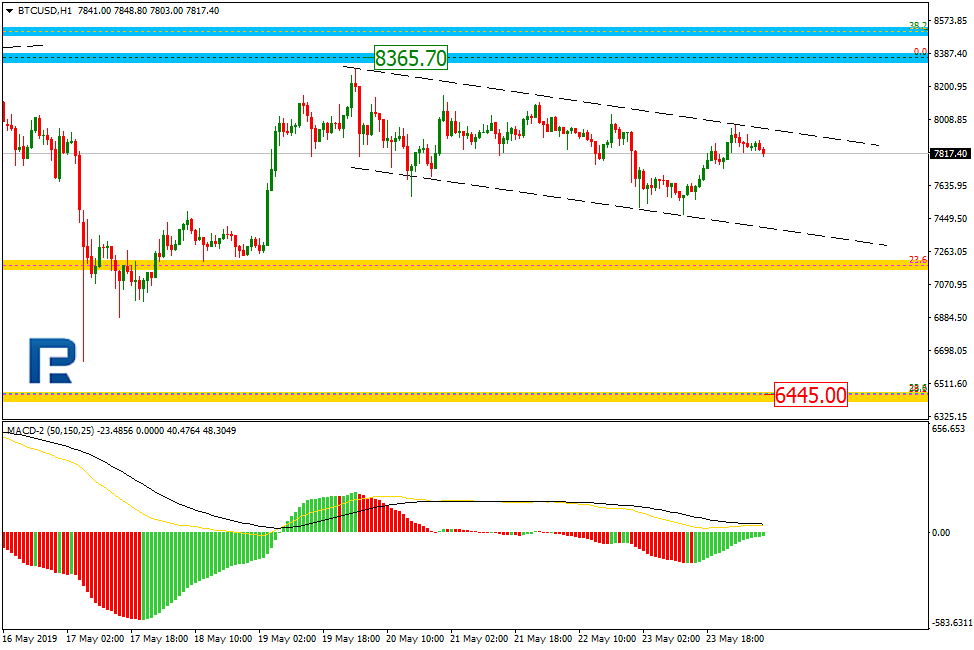
You can see from our BLUE CHANNEL levels on the lower indicator that we believe a Pennant/Flag formation may be setting up in Bitcoin right now.  This type of price rotation is not uncommon after a big move like we’ve seen already and it could be a fairly wide price rotation as this sideways Pennant/Flag pattern continues.  The current range between Key Highs and Key Lows is about $2000 – lots of room for trading/traders.

The key to understanding this move is the protectionist thinking of the people of China.  They are very likely attempting to move their capital into something that is not Chinese Yuan based and away from traditional holdings (Gold, Real Estate, Jewelry or other assets).  Eventually, we will likely see Gold/Silver follow the rally in Cryptos if fear continues to hit the markets.  Cryptos, although, appear to have executed the first leg of the “fear trade” originating from the breakdown in the US/China trade negotiations.

An additional word of warning should be that any resolution to the US/China trade talks over the next 60+ days could remove any long term support for this upside move in Cryptos.  Pay attention to the news cycles and what is happening in China, the EU and the rest of the world.  As fast as it went up, it could easily break down as news hits.

Lots of great price action unfold to take advantage of. Subscribers just closed out a 24% winner and another 3.46% as the markets prepare for a new move. If you want my trade signals and alerts be sure to check out my Wealth Trading Newsletter.

Chris Vermeulen – TheTechnicalTraders.com


The Week Ahead: Friday 24th May 2019 – Currency Point – Just do it already, AUD

By Evan Lucas, FPMarkets.com

Currency Point – Just do it already, AUD

Currency Point – Just do it already, AUD

The RBA is killing me, I have long believed that it would eventually be forced to cut rates in 2019. However, the consistent message had been ‘wait and see’ and ‘employment will save the day’. Thus, I saw the first move in August as it would give the RBA a chance to ‘evaluate’ Q2 CPI and 2 months of employment data post the Federal election and realise it need to finally cut rates.

However, in his speech to the Economic Society of Australia titled: “The Economic Outlook and Monetary Policy”, his final paragraph blew that all up.

“[in] a scenario in which there was no further improvement in the labour market and the unemployment rate remained around the 5 per cent mark… we judged that inflation was likely to remain low relative to the target and that a decrease in the cash rate would likely be appropriate. A lower cash rate would support employment growth and bring forward the time when inflation is consistent with the target. Given this assessment, at our meeting in two weeks’ time, we will consider the case for lower interest rates.”

This begs the question: Why wait? Do it now not in 2 weeks as the RBA governor has just told the market he and Co. will cut rates on June 4 and the market has now priced in a second 25 basis point (bps) rate cut in August too. (So, I might still be right, just that is will be the second round not the first.) It’s a forgone conclusion and the AUD has priced this scenario as fact.

What’s interesting now from a currency point of view is the AUD could be on track to become a carry trade FUNDING source rather than carry trade destination. The Aussie 10year US 10-year differential could be -125bps as early as August 7 that is attractive and a further AUD negative.

AUD/USD has already bolted in my opinion. The initial bounce back above 69c last week on the surprise re-election of the Morrison centre-right government gave the AUD a sugar hit nut was short lived, and the pair is now not at an entry point of interest.

What are looking like interesting trades is AUD crosses of CAD and JPY. Like AUD/CAD better

Idea: Short AUD/CAD

Looking for 0.90c, entry 0.935c or better, stop loss, 0.95c

Reasoning:

– Dovish RBA with expected 50bps of cuts coming in the next 3 months.
– Australian employment and construction markets to remain subdued
– Canadian Employment and Wage growth have been ahead of expectations
– BoC has moved back to a Hawkish stand point despite some weakness in oil

By FPMarkets.com


RoboForex Joins ARFIN

May 24th, 2019 – Belize City, Belize – RoboForex affiliated company in Belarus, which provides brokerage services on global financial markets under RoboForex brand, joins the Financial Market Development Association (ARFIN). Joining ARFIN, the Company is obliged to comply with the Rules of Market and Professional Conduct, which regulate corporate conduct for the Association members, as well as follow principles of transparency and fair practice.

It should be mentioned that in April 2019, the Company that is affiliated with RoboForex, an international broker, received the license of the National Bank of the Republic of Belarus (the certificate No.15 dated April 8th 2019). Residents of the Republic of Belarus, as well as of several other countries, will have an opportunity to register Cent, Standard, ECN, and Affiliate accounts. Clients will have access to 97 Forex trading instruments, Metals, Commodities, Indices, and CFDs on stocks. Trading operations will be available through the most popular trading terminal in the world, MetaTrader 4.

This is how Andrei Dziarnovich, CEO RoboForex BY, is commenting on the event: “A month ago, we received the license of the National Bank of the Republic of Belarus. Now, we’re joining ARFIN, the association, which protects interests of clients and expands civilized trading on the Forex market in the first place. All these steps are driven by our intentions to provide quality and competitive services on global financial markets.

About RoboForex

RoboForex Ltd is an international broker, which offers to trade 8 asset types and more than 9,400 instruments. RoboForex Ltd has been providing its services since 2009 and with the brokerage license IFSC/60/271/TS.

About the Association

The Financial Market Development Association is a non-commercial union of organizations that conduct their activities on the financial market of the Republic of Belarus. The Association was founded in 2013 and currently unites companies that operate on the OTC Forex market.


Forex Technical Analysis & Forecast 24.05.2019 (EURUSD, GBPUSD, USDCHF, USDJPY, AUDUSD, USDRUB, GOLD, BRENT)

Article By RoboForex.com

EURUSD, “Euro vs US Dollar”

EURUSD has tested 1.1182 from below; right now, it is consolidating around this level. Possibly, the pair may expand the range towards 1.1190 and then form a new descending structure to break 1.1150. After that, the instrument may continue trading inside the downtrend with the target at 1.1100.

EURUSD
Risk Warning: the result of previous trading operations do not guarantee the same results in the future

GBPUSD, “Great Britain Pound vs US Dollar”

GBPUSD has completed the correction and returned to 1.2680. Possibly, today the pair may resume trading inside the downtrend with the short-term target at 1.2550.

GBPUSD
Risk Warning: the result of previous trading operations do not guarantee the same results in the future

USDCHF, “US Dollar vs Swiss Franc”

USDCHF has finished another correctional structure at 1.0025; right now, it is trading upwards with the target at 1.0050. Later, the market may start another decline towards 1.0035 and then form one more ascending structure with the first target at 1.0076.

USDCHF
Risk Warning: the result of previous trading operations do not guarantee the same results in the future

USDJPY, “US Dollar vs Japanese Yen”

USDJPY has reached the short-term target at 109.55; right now, it is consolidating around this level. Today, the pair may start a new growth to reach 109.95 and then continue falling towards 109.26. After that, the instrument may be corrected with the target at 109.95.

USDJPY
Risk Warning: the result of previous trading operations do not guarantee the same results in the future

AUDUSD, “Australian Dollar vs US Dollar”

AUDUSD has completed the correction at 0.6896; right now, it is moving downwards. Possibly, the pair may beach 0.6863. After that, the instrument may break it and then continue trading inside the downtrend with the target at 0.6800.

AUDUSD
Risk Warning: the result of previous trading operations do not guarantee the same results in the future

USDRUB, “US Dollar vs Russian Ruble”

USDRUB has completed the correctional structure at 64.80 and formed a new consolidation range around it. Today, the pair may form a new descending structure to break 64.56 and then continue trading inside the downtrend with the first target at 63.94.

USDRUB
Risk Warning: the result of previous trading operations do not guarantee the same results in the future

XAUUSD, “Gold vs US Dollar”

Gold has finished another correctional structure and returned to 1285.70. Possibly, today the pair may consolidate near the current highs. If later the price breaks this range to the downside, the instrument may resume trading inside the downtrend with the target at 1267.60.

GOLD
Risk Warning: the result of previous trading operations do not guarantee the same results in the future

BRENT

After breaking 70.70, Brent completed another correctional structure at 67.10; it has already formed another consolidation range and broken it to the upside. Possibly, the pair may start another growth to reach the first target at 69.13. Later, the market may form a new descending structure towards 68.06 and then resume trading upwards with the target at 71.30.

BRENT

Article By RoboForex.com

Attention!
Forecasts presented in this section only reflect the author’s private opinion and should not be considered as guidance for trading. RoboForex LP bears no responsibility for trading results based on trading recommendations described in these analytical reviews.

Fibonacci Retracements Analysis 24.05.2019 (BITCOIN, ETHEREUM)

Article By RoboForex.com

BTCUSD, “Bitcoin vs US Dollar”

In the H4 chart, after reaching the long-term retracement of 38.2% at 8520.00, BTCUSD started a new pullback to the downside, which has already reached the retracement of 23.6%. The next downside targets may be the retracements of 38.2% and 50.0% at 6445.00 and 5849.00 respectively. After finishing this pullback, the price may resume trading upwards. If the instrument breaks the high at 8365.70, the pair may continue growing to reach the retracements of 38.2% and 50.0% at 8520.00 and 10170.00 respectively.

Bitcoin
Risk Warning: the result of previous trading operations do not guarantee the same results in the future

In the H1 chart. BTCUSD is trading downwards to re-test the retracement of 23.6%. if the price breaks it, the instrument may continue falling towards the retracement of 38.2%.

BTCUSD
Risk Warning: the result of previous trading operations do not guarantee the same results in the future

ETHUSD, “Ethereum vs. US Dollar”

As we can see in the H4 chart, ETHUSD is forming another correction to the downside, which has already reached the retracement of 38.2%. The next targets may be the retracements of 50.0% and 61.8% at 213.13 and 197.52 respectively. After finishing the correction, the instrument may start a new rising wave to break the high at 279.90.

ETHUSD
Risk Warning: the result of previous trading operations do not guarantee the same results in the future

The H1 chart shows more detailed structure of the correction.

Ethereum

Article By RoboForex.com

Attention!
Forecasts presented in this section only reflect the author’s private opinion and should not be considered as guidance for trading. RoboForex LP bears no responsibility for trading results based on trading recommendations described in these analytical reviews.

The Analytical Overview of the Main Currency Pairs on 2019.05.24

by JustForex

The EUR/USD currency pair

Technical indicators of the currency pair:
  • Prev Open: 1.11501
  • Open: 1.11812
  • % chg. over the last day: -0.28
  • Day’s range: 1.11726 – 1.12056
  • 52 wk range: 1.1111 – 1.2009

EUR/USD started to recover and updated the local maximums. The investors began to fix positions after a long rally. The escalation of the trade war between Washington and Beijing increased the expectation for the FRS to lower the interest rates this year. An additional pressure is cause by the negative trends in the US Treasury bonds’ yield. The market participants are watching the EU Parliament elections. The quotes are consolidating around 1.11800-1.12000. You should open positions from these levels. EUR has prospects for further recovery.

The Economic News Feed for 24.05.2019:

  • – Report on the Orders of Durable Goods (US) – 15:30 (GMT+3:00);
EUR/USD

The price fixed above 200 MA which points towards the power of the buyers.

The MACD histogram is in the positive zone and keeps rising which points towards a further correction of the EUR/USD quotes.

The Stochastic Oscillator is in the neutral zone, the %K line is crossing the %D line. There are no signals at the moment.

Trading recommendations
  • Support levels: 1.11800, 1.11500, 1.11300
  • Resistance levels: 1.12000, 1.12200, 1.12450

If the price fixes above 1.12000, expect further descend towards 1.12300-1.12500.

Alternatively, the quotes can descend towards 1.11500-1.11300.

The GBP/USD currency pair

Technical indicators of the currency pair:
  • Prev Open: 1.26516
  • Open: 1.26525
  • % chg. over the last day: +0.01
  • Day’s range: 1.26477 – 1.26879
  • 52 wk range: 1.2438 – 1.3631

GBP/USD stabilized after a long descend. The GBP is consolidating. The local support and resistance levels are 1.26500 and 1.27000. The market participants are waiting for the relevant info regarding Brexit. A technical correction remains possible. You should open positions from the key levels.

At 11:30 (GMT+3:00) the UK will publish a retail sales report.

GBP/USD

The indicators do not provide precise signals, the price has crossed 50 MA.

The MACD histogram has moved into a positive zone which points towards a correction of GBP/USD.

The Stochastic Oscillator is in the neutral zone, the %K line started to cross the %D line. There are no signals at the moment.

Trading recommendations
  • Support levels: 1.26500, 1.26000
  • Resistance levels: 1.27000, 1.27550, 1.28000

If the price fixes above 1.27000, expect further correction towards 1.27500-1.27800.

Alternatively, the quotes can fall towards 1.26200-1.26000.

The USD/CAD currency pair

Technical indicators of the currency pair:
  • Prev Open: 1.34356
  • Open: 1.34721
  • % chg. over the last day: +0.33
  • Day’s range: 1.34459 – 1.34824
  • 52 wk range: 1.2727 – 1.3664

USD/CAD started to descend after a sharp growth. The trading instrument updated the local minimums. The key support and resistance levels are 1.34450 and 1.34700. The demand for USD weakens. Keep an eye on the oil quotes dynamics and open positions from the key levels.

The Economic News Feed for 24.05.2019 is calm.

USD/CAD

The indicators do not provide precise signals: 50 MA has crossed 200 MA.

The MACD histogram is close to 0.

The Stochastic Oscillator is in the oversold zone, the %K line started to cross the %D line. There are no signals at the moment.

Trading recommendations
  • Support levels: 1.34450, 1.34200, 1.34000
  • Resistance levels: 1.34700, 1.34900, 1.35100

If the price fixes below 1.34450, epxect a correction towards 1.34000.

Alternatively, the quotes can grow towards 1.34800-1.35000.

The USD/JPY currency pair

Technical indicators of the currency pair:
  • Prev Open: 110.333
  • Open: 109.594
  • % chg. over the last day: -0.73
  • Day’s range: 109.456 – 109.745
  • 52 wk range: 104.97 – 114.56

USD/JPY is showing an agressive bearish trend. The quotes have descended by 70 points. The demand for the safe assets has grown since the trade negotiations between the US and China seem to have reached a dead end. Right now the quotes are consolidating around 109.500-109.750. Keep an eye on the US economic reports. The currency pair has a tendency to descend.

The national basis consumer price index in Japan for April confirmed the market expectations and reached 0.9%.

USD/JPY

The price fixed below 200 MA which points towards the power of the sellers.

The MACD histogram is in the negative zone but above the signal line which gives a weak signal to sell USD/JPY.

The Stochastic Oscillator is in the neutral zone, the %K line is crossing the %D line. There are no signals at the moment.

Trading recommendations
  • Support levels: 109.500, 109.150, 109.000
  • Resistance levels: 109.750, 110.100, 110.350

If the price fixes below 109.500, expect further descend towards 109.150-109.000.

Alternatively, the quotes can grow towards 110.000-110.200.

by JustForex

The Dollar Index Has Moved Away from Two-Year Highs

by JustForex

During yesterday’s trading, the greenback weakened against a basket of world currencies. The dollar index (#DX) moved away from two-year highs and closed the trading session in the negative zone (-0.16%). Investors began to partially fix positions after a continuous rally of the US currency. The threat of economic consequences from the trade war with China raised expectations for the Fed to cut interest rates this year. The US currency is under pressure due to a fall in the 10-year US government bonds yield.

Elections to the European Parliament, as well as the situation concerning Brexit, are still in the focus of attention. The resignation of the leader of the House of Commons, Andrea Leadsom, raises the pressure on the British Prime Minister. At the moment, most experts agree that Theresa May may announce her resignation in the near future. Today, financial market participants will assess important economic releases from the UK and the US.

The “black gold” prices have been recovering after a sharp collapse the day before (more than 5%). At the moment, futures for the WTI crude oil are testing $58.50 per barrel.

Market Indicators

Yesterday, the major US stock indices closed in the negative zone again: #SPY (-1.22%), #DIA (-1.10%), #QQQ (-1.53%).

The 10-year US government bonds yield continues to show negative dynamics. Currently, the indicator is at the level of 2.31-2.32%.

The news feed on 2019.05.24:

– Report on retail sales in the UK at 11:30 (GMT+3:00);
– Core durable goods orders in the US at 15:30 (GMT+3:00).

by JustForex

Stocks Topping, Dollar Up, Gold Getting Closer (Audio)

By TheTechnicalTraders.com

Chris Vermeulen joined us today. He believes that the stock market is topping out if it hasn’t already. This will lead to increased volatility and a move back to safe haven assets, i.e. gold. He believes that oil will break down briefly into the ’50s and then come roaring back shortly thereafter. The bigger and faster the decline, the fast the bounce back. Interest rates are headed lower.

 Click Here to Listen to the Audio 


By TheTechnicalTraders.com

China Hang Seng Index Collapses and Commodities

By TheTechnicalTraders.com

The Chinese Hang Seng Index collapsed early this week to new recent lows.  This breakdown in the Chinese major stock index highlights the anticipated fallout from the continued US/China trade war.  Recent data from the Chinese property market and corporate bond markets suggest a broad slowdown in economic activity which may surprise many foreign investors in the weeks/months to come.

Partner this continued economic weakness with the EU Elections and the continued US/China trade issues and we almost have a perfect storm for commodities such as Oil, Copper and other industrial/transportation related shares.  If the trade continues to collapse between the US/China while elections cause the general populations to “pause” in traditional spending habits, it would suggest that we could see a continued breakdown in the general commodity levels over the next 6~12+ months.

First, the Hang Seng Index collapsed much lower this week – prompting the US and UK markets to breakdown as well.  The continued rhetoric between the US and China regarding the Trade War is not helping the global economy much.  Yet, it must continue to some conclusion before the planet can begin to move forward.  At this point, it is almost like watching an old school game of” Chicken” – who flinches first.


Overnight, the German DAX also collapsed.  It is obvious that enormous tensions persist within the EU with the elections hitting now and over the next few days.  The broader concern for skilled traders is “do you believe the EU will be able to pick up the slack of the US Trade War with China??”  If you honestly believe the EU and other foreign nations will be willing to pick up $400B+ USD of trade immediately, we suggest you grab a cup of coffee and watch what happens over the next few weeks with the EU elections, global markets, and economic data.  We don’t believe the EU is capable of taking on another half-trillion USD in trade debt annually right now, or ever, for that matter.


The US Dow Jones Index, even though it has shown some weakness recently, has still held up quite well.  We believe the Capital Shift, where foreign capital has been rushing into the US economy over the past 4+ years, is continuing to provide pricing support for the US stock market and economy.  As long as this continues, we’ll see continued strength in the US stock market and US assets (such as the US Dollar, Real Estate and Debt).


Commodities, on the other hand, appear to be under severe pricing pressure.  We recently authored a series of research posts regarding Oil, Gold and other commodities.  We believe the global commodity index could continue to fall further, as these elections and global trade issues continue to exert pricing pressures of global commodities and trade.  We believe Oil could fall back to levels below $50 ppb and that Gold an Silver are already 20~30% undervalued.  One does not need to be hit on the head to understand the US elections, the trade wars and all the other issues currently executing across the planet may create a perfect storm for certain commodities and global stock market sectors driving prices much lower before they get any better.


If the Commodity Index breaks the current support level, we could see a much broader breakdown in the global stock market, Oil, Copper, Trade, and many other global trade-related issues (retail, housing, corporate debt, and others).  Pay attention because this is going to get very interesting over the next 4~6+ months.

Lots of great price action unfold to take advantage of. Subscribers just closed out a 24% winner and another 3.46% as the markets prepare for a new move. If you want my trade signals and alerts be sure to check out my Wealth Trading Newsletter.

Chris Vermeulen – TheTechnicalTraders.com


Conservative leadership poses risks and opportunities for investors

By George Prior

The race to be the next UK Prime Minister demands investors take action to mitigate risks to their wealth, affirms the CEO of one of the world’s largest independent financial advisory organisations.

The comments from Nigel Green, founder and chief executive of deVere Group, which has $12bn under advisement, come as it is reported by The Times that Theresa May will quit her post as early as Friday.

Mr Green notes: “Nigel Farage’s Brexit Party is expected to do well in the European elections. This can be expected to send a clear message to the Conservatives, and it will likely mean that their next leader – and Britain’s next PM – will be a Brexiter such as Johnson or Raab.

“Should a leadership contest outcome produce a hard-line Brexiter who could promote a sudden exit from the EU, markets will react accordingly with UK assets and the pound being impacted.”

He continues: “With the ongoing uncertainty, UK and international investors in UK assets should mitigate risks to their wealth by ensuring their portfolios are properly diversified geographically and by asset class and sector.

“Exposure to equities and bonds, from as many different issuers as possible will help safeguard their savings from this uncertainty and take advantage of the opportunities that will inevitably be presented.”

Earlier this week, the deVere CEO noted: “European elections? It’s what comes next that matters.

“Whether the Pound will prolong its longest run of losses against the Euro since the single currency’s introduction will depend on who imminently takes over from Prime Minister Theresa May.

Nigel Green concludes: “The battle for the Conservative leadership and the keys to Number 10 should serve as a wake-up call for investors to review their portfolios to ensure they will remain on track to reach their long-term financial goals – regardless of who enters Downing Street.”

About:

deVere Group is one of the world’s largest independent advisors of specialist global financial solutions to international, local mass affluent, and high-net-worth clients.  It has a network of more than 70 offices across the world, over 80,000 clients and $12bn under advisement.