Article By RoboForex.com
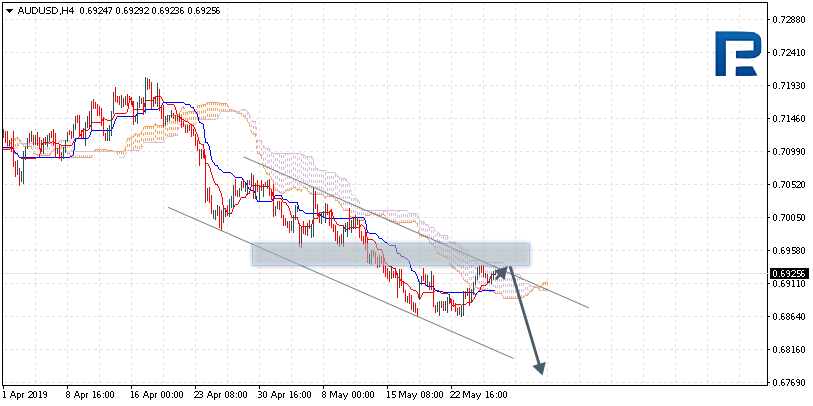
AUDUSD, “Australian Dollar vs US Dollar”
AUDUSD is trading at 0.6925; the instrument is moving inside Ichimoku Cloud, thus indicating a sideways tendency. The markets could indicate that the price may test the upside border of the cloud at 0.6940 and then resume moving downwards to reach 0.6785. Another signal to confirm further descending movement is the price’s rebounding from the channel’s upside border. However, the scenario that implies further decline may be cancelled if the price breaks the upside border of the cloud and fixes above 0.6970. In this case, the pair may continue growing towards 0.7065. After breaking the cloud’s downside border and fixing below 0.6865, the price may continue moving downwards.

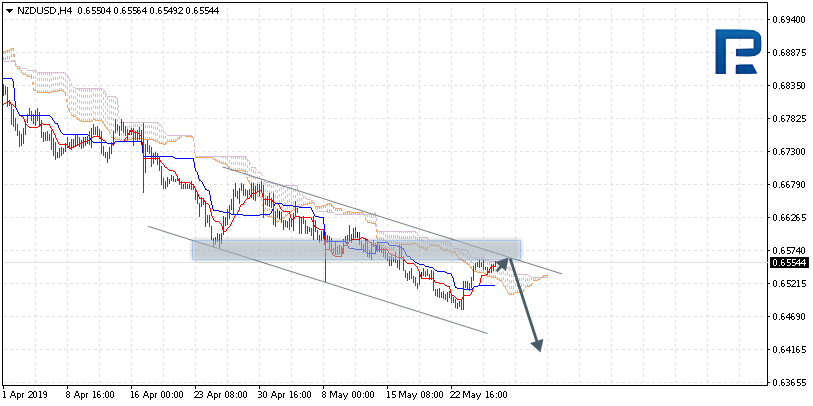
NZDUSD, “New Zealand Dollar vs US Dollar”
NZDUSD is trading at 0.6544; the instrument is moving inside Ichimoku Cloud, thus indicating a sideways tendency. The markets could indicate that the price may test the upside border of the cloud at 0.6560 and then resume moving downwards to reach 0.6415. Another signal to confirm further descending movement is the price’s rebounding from the channel’s upside border. However, the scenario that implies further decline may be cancelled if the price breaks the upside border of the cloud and fixes above 0.6585. In this case, the pair may continue growing towards 0.6685. After breaking the cloud’s downside border and fixing below 0.6470, the price may continue moving downwards.
USDCAD, “US Dollar vs Canadian Dollar”
USDCAD is trading at 1.3435; the instrument is moving below Ichimoku Cloud, thus indicating a descending tendency. The markets could indicate that the price may test the downside border of the cloud at 1.3445 and then resume moving downwards to reach 1.3365. Another signal to confirm further descending movement is the price’s rebounding from the resistance level. However, the scenario that implies further decline may be cancelled if the price breaks the upside border of the cloud and fixes above 1.3475. In this case, the pair may continue growing towards 1.3545.

Article By RoboForex.com
Attention!
Forecasts presented in this section only reflect the author’s private opinion and should not be considered as guidance for trading. RoboForex LP bears no responsibility for trading results based on trading recommendations described in these analytical reviews.