The US dollar continued its growth against the basket of major currencies. The dollar index (#DX) closed in the positive zone (+0.20%). Trade disputes between the US and China are still in the focus of attention. The provocation of a trade conflict is “naked economic terrorism,” one of the senior Chinese diplomats said on Thursday, ramping up the rhetoric against the United States. Trade tension between Washington and Beijing sharply increased earlier this month after the Trump administration accused China of “abandoning” its previous promises to make structural changes to its economic practice. Also, as it became known, Beijing intends to use rare-earth metals as a leverage of pressure in the trade war with the United States.
The euro weakened after the publication of weak economic statistics from Germany. Thus, the number of unemployed in Germany increased by 60K in May, while experts expected a decrease by 8K. The unemployment rate also rose to 5.0% from 4.9%.
The Bank of Canada decided on the interest rate. As expected, the regulator left the indicator unchanged at 1.75%. Today we expect data on US GDP.
The “black gold” prices show positive dynamics. At the moment, futures for the WTI crude oil are testing $59.60 per barrel. At 18:00 (GMT+3:00) data on crude oil inventories will be published in the US.
Market Indicators
Yesterday, the main US stock indices closed in the negative zone: #SPY (-0.67%), #DIA (-0.87%), #QQQ (-0.82%).
The 10-year US government bonds yield is recovering. Currently, the indicator is at the level of 2.27-2.28%.
The news feed on 2019.05.30:
– Data on US GDP at 15:30 (GMT+3:00); – Pending home sales in the US at 17:00 (GMT+3:00).
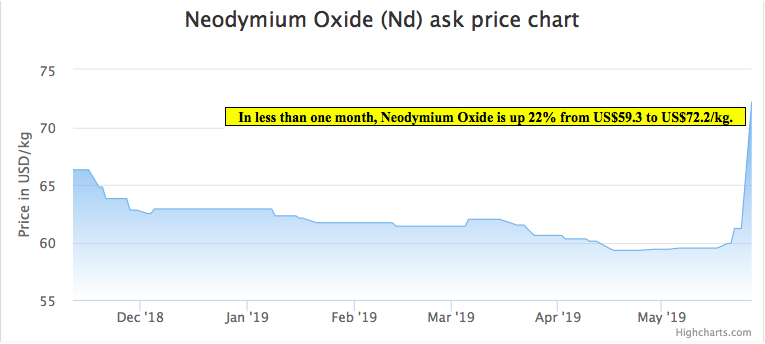
There has been quite a bit of ink spilled lately regarding the Chinese – U.S. stand off and possible implications for Rare Earth Metals. Rick Mills, from Ahead of the Herd, has written the best articles that I’ve read so far. Many Rare Earth Metals companies have seen their share prices increase, some substantially. Yet, we are probably still in the early innings of a long, drawn out game. Of course, no one knows how this will end, but select Rare Earth prices have begun to move higher. For instance, Light Rare Earth Element Neodymiumoxide (“Nd“) is up >22% in just the past few weeks. As of Friday May 24, prices of Praseodymium-Neodymium oxide stood at 330,000-340,000 yuan/tonne, up from 264,000 yuan/tonne the week prior, according to SMM. That’s up 26% in a week.
“Why did the U.S. threaten to raise tariffs on essentially all remaining imports from China, while sparing rare earth metals? Without a reliable domestic supply, the U.S. must rely on China to supply industries of high strategic importance. China can raise prices of rare earth metals exported to the U.S. in response to higher tariffs on Chinese products. The U.S. decision to omit rare earths from the China tariff list shows how much the Country depends on these minerals. In the short term, U.S. users would not be able to find alternatives, so they would have to accept higher prices. China has various tools to influence prices, cutting the number of rare-earth mining licenses, raising market access standards for miners and reducing exports of primary rare-earth products.”
In addition to Rare Earths being in the crosshairs, security of supply of Cobalt is also being discussed by industry participants & Government & Trade officials in the U.S. While less critical then the highest value Rare Earth Metals, lithium & cobalt are important, especially for grid-scale Energy Storage Systems. Last week, execs from cobalt companies with projects in the U.S. & Canada met in Washington D.C. to discuss cobalt’s tortured supply chain. Supply is at grave risk due to ~65% of it coming from a single country in Africa. Politicians talking about Cobalt supply is helpful in framing the Rare Earth Metals situation. Evidence that the trade war is heating up can be seen in higher Rare Earth Metals prices, it’s as simple as that, and we’re seeing higher prices of select metals….
The biggest increases have come from Dysprosium (“Dy”), Nd & Praseodymium (“Pr“), up by 56%, 22% & 22%, respectively, from 2019 lows, as of May 27th. These 3 metals just happen to be 3 of the most critical metals for national defense applications, and are widely used in super magnets and in other crucial high-tech fields. In many uses there are few, if any, substitutes. Rare Earth Metals juniors are catching a bid, Appia Energy, GéoMégA Resources, Rainbow Rare Earths, Greenland Minerals, Northern Minerals & Peak Resources are up an average of 114% from 52-week lows.
Interestingly, 3 of the top 6 performers I mentioned are Australian-listed, which most readers (and me) rarely, if ever, invest in. There are not that many North American-listed REE stocks to choose from. And, many of the U.S & Canadian-list names have projects that require hundreds of millions of US$ in Cap-ex. Others, that were exciting in the last REE bull market, have metals that are no longer as highly prized. In 2010-2011, there might have been 6-8 REEs worth owning. Today, only 3-4 Rare Earth Metals are truly bankable for the long-run.
With that in mind, (wait for it, I have a stock idea to discuss) readers should want to invest in companies with LREE deposits, more specifically with deposits containing as much Pr, Nd & Dy as possible. And, companies that have tight share structures so that if they move, the uptick could be very significant. I also want companies with small market caps. Less money is being deployed into natural resource stocks, it’s a lot easier to move a company with a market cap < C$10M than > C$100M. Finally, a strong management team & Board are paramount.
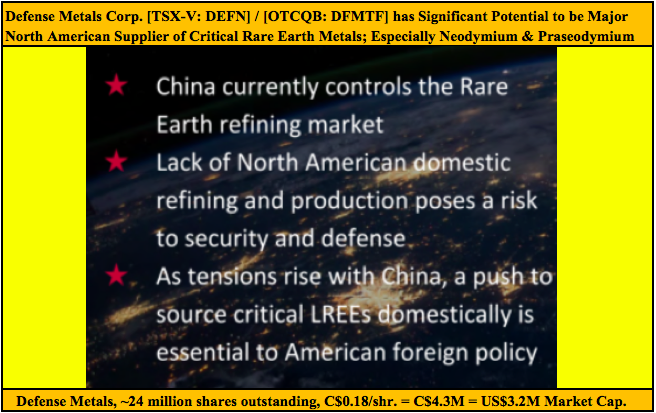
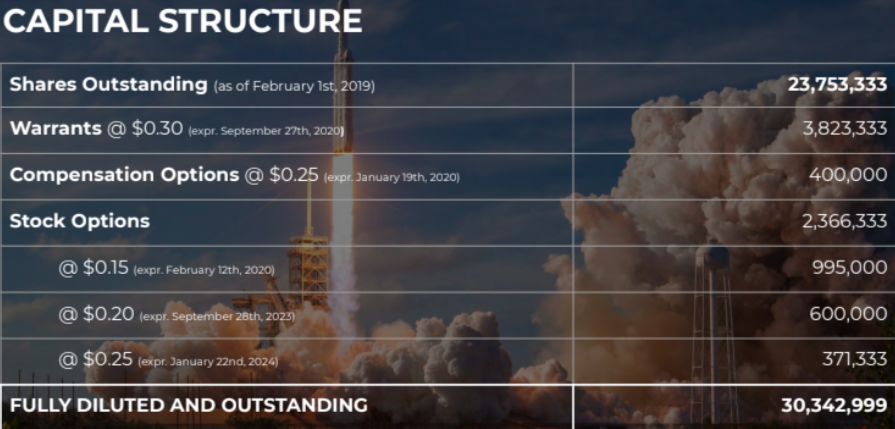
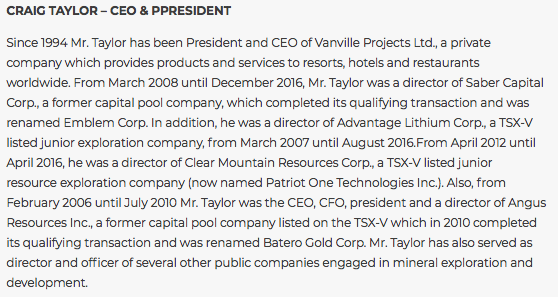
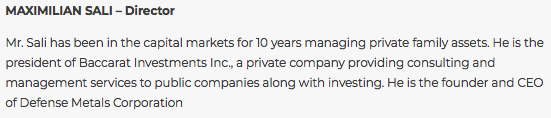
Defense Metals Corp. [TSX-V: DEFN] [OTCQB: DFMTF] has all of the attributes I mentioned and more. Earlier this year, the share price hit C$0.30 on excitement over the uranium spot price climbing above US$29/pound, (the Company has promising Athabasca uranium assets) a great management team and a cheap valuation (only 24 million shares outstanding). Since then, the uranium price has settled to around US$25/pound and Company news flow has been slower than hoped for. SGS Canada is performing a battery of tests and will write a number of important reports, mostly about metallurgy. SGS is working with a 30-tonne bulk sample from Defense Metals’ Wicheeda deposit.
However, the management team, Board & Advisors are as strong as ever, and select Light REE prices are increasing. Increasing prices? That’s strange, Lithium, Cobalt, Vanadium, Gold, Silver, Copper, Zinc, Lead, Uranium — all down over the past month or longer. Marijuana (cannabis) prices are down as well! According to Mr.David Merriman of Roskill, “LREE projects have comparatively greater concentrations of Lanthanum, Cerium, Praseodymium, Neodymium & Samarium, typically forming roughly 75%-99% of contained REEs in a deposit.” Defense Metals has a LREE deposit with all 5 of those metals.
Defense Metals has 2 of just 3 or 4 Rare Earth Metals that are absolutely critical to the global economy, and a few metals that are modestly to moderately important in enabling a growing middle class to continue moving to cities and buying their first smart phones & Electric Vehicles. The concentrations of Nd & Pr might seem low at well under 1%, but those metals trade at about US$70K/t. Compare that to ~US$54K/t for Uranium, ~US$35K/t for Cobalt, ~US$18K/t for Vanadium, ~US$12K/t for Nickel and ~US$6K/t for Copper.
One can’t talk about China and the U.S. without discussing Rare Earth Metals. If one talks about Rare Earth Metals, the ones that come to mind are Nd, Pr & Dy. Earlier this year I asked Mr. Merriman about the dominance of select metals, and of course China,
“China leads in production of both mined rare earth products & refined rare earth compounds, with Chinese production accounting for 86% of global refined production in 2017. Rare earth production outside China is forecast to grow significantly through 2028 as numerous projects in Australia, Russia, the Americas & Africa come online. Demand for rare earth permanent magnets is forecast to show strong growth through 2028, which is expected to further distort rare earth demand ratios with Nd, Pr & Dy forming a greater proportion of total demand.”
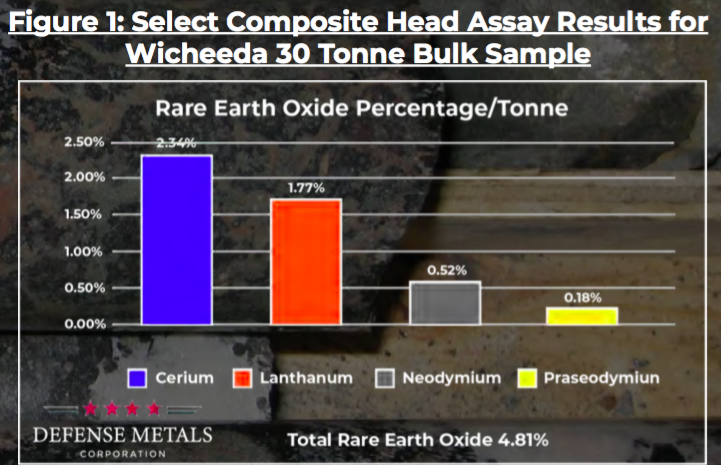
Management expects a lot more news flow in June than in April & May as SGS Canada completes additional metallurgical test work on the 1,780 hectare Wicheeda project bulk sample. The timing could hardly be better. If the Company receives more positive news, a mini-pilot plant will be built to further advance and de-risk a process flow sheet. Select head assay results for the 30-tonne bulk sample included 2.34% Ce oxide,1.77% La oxide, 0.52% Nd oxide & 0.18% Pr oxide, which the Company considers potentially economically significant. Total LREO (Light Rare Earth Oxide) was 4.81%.
From a recent Company press release,
“The results confirm, in conjunction with previous metallurgical head grades returned from smaller drill core samples, the presence of significant Pr values…. The Company considers the results to have potential economic significance to the advancement of the Wicheeda Property given recent indicative LREE oxide prices and their potential impact on Wicheeda, which has been historically viewed as a cerium-lanthanum-neodymium deposit.”
I look forward to news on this exciting LREE Project. Wicheeda could be in small-scale commercial production relatively quickly, if the metallurgy is as good as management believes it might be. A Project with much smaller upfront Cap-ex than many legacy projects around the world that are still on the drawing board. The reports & data from SGS should convey a tremendous amount of information about the potential feasibility of a mining operation. It’s exciting times for REE & LREE juniors, especially so for Defense Metals Corp. [TSX-V: DEFN] [OTCQB: DFMTF] shareholders.
Disclosures: The content of this article is for information only. Readers fully understand and agree that nothing contained herein, written by Peter Epstein of Epstein Research[ER], (together, [ER]) about Defense Metals Corp., including but not limited to, commentary, opinions, views, assumptions, reported facts, calculations, etc. is not to be considered implicit or explicit investment advice. Nothing co-ntained herein is a recommendation or solicitation to buy or sell any security. [ER] is not responsible under any circumstances for investment actions taken by the reader. [ER] has never been, and is not currently, a registered or licensed financial advisor or broker/dealer, investment advisor, stockbroker, trader, money manager, compliance or legal officer, and does not perform market making activities. [ER] is not directly employed by any company, group, organization, party or person. The shares of Defense Metals Corp. are highly speculative, not suitable for all investors. Readers understand and agree that investments in small cap stocks can result in a 100% loss of invested funds. It is assumed and agreed upon by readers that they will consult with their own licensed or registered financial advisors before making any investment decisions.
At the time this article was posted, Peter Epstein owned shares of Defense Metals Corp. and it was an advertiser on [ER].
Readers understand and agree that they must conduct their own due diligence above and beyond reading this article. While the author believes he’s diligent in screening out companies that, for any reasons whatsoever, are unattractive investment opportunities, he cannot guarantee that his efforts will (or have been) successful. [ER] is not responsible for any perceived, or actual, errors including, but not limited to, commentary, opinions, views, assumptions, reported facts & financial calculations, or for the completeness of this article or future content. [ER] is not expected or required to subsequently follow or cover events & news, or write about any particular company or topic. [ER] is not an expert in any company, industry sector or investment topic.
Here we go again.. We’ve been nailing the Precious Metals moves for many months and we’ve heard from many of our followers and members about our research. Some of you might remember our November 24, 2018 prediction that Gold would rally above $1300, then stall and set up a “Momentum Base pattern near April 21~24, 2019″ . We find it incredible that we can make a prediction about Gold nearly 6+ months ahead of the move using our proprietary predictive modeling tools and then sit back and wait for it to happen just as we predicted.
On March 28, 2019, we posted this research article regarding the “Final Buying Opportunity for Gold”. Our researchers believe this current double-bottom setup is the last time you’ll see Gold prices below $1300 for quite some time in the future. Again, we were warning our followers that the opportunity to position their gold trades was setting up and this low price setup may be the last time we see Gold near these lows.
Our current research suggests the bottoming is over and the new price leg should begin to prompt a Gold price rally over the next 5~7+ weeks targeting a level well above $1375 initially.
This Daily Gold chart highlights the price rotation and the Double-Bottom that has currently set up in Gold. Our proprietary Fibonacci price modeling system is suggesting an upside price leg targeting at least $1330 (on this Daily chart) will become the initial upside price leg. Remember, the Daily Fibonacci modeling system is predicting price moves over 10~30+ days.
This Weekly Gold chart is highlighting the same Fibonacci predictive price modeling system on long term data – weekly data. You can see how we’ve highlighted the price rotation peaks and valleys as well as how the Fibonacci modeling system is predicting a broader upside price move with a target near $1425 or higher.
If you pay attention to the MAGENTA price rotations we’ve highlighted throughout the initial upside price move, you’ll see there are a total of FIVE (5) rotations within that first price leg. A perfect 5 wave rotation upward. Then, the following downside price move consisted of a THREE (3) wave downside price move – resulting in a DOUBLE-BOTTOM price formation. Should this next wave, wave C, rally in equal form to Wave A, the upside price target for the move would be $1450. We believe this next price advance will be bigger than Wave A and likely result in a price target range well above $1650.
As we’ve been saying for many months, get ready and here we go. Once the protectionist moves into Cryptos have waned and traders realize the magnitude of this potential precious metals rally (as well as the fact that Cryptos will not provide the same level of protection as precious metals), the hunt for the shiny metals will be on. It would be very wise to stay well ahead of this move and prepare for this upside leg now.
We have been trying to tell you about this move for over 6+ months. We hope you’ve been paying attention and understand that even with a 4% to 8% price risk (or more) in your accumulation of Gold/Miners and precious metals positions, this trade is for the longer-term objective – not the short-term 8 to 12%. This next upside price move could target the $2100 to $2400 level if it extends into a complex advancement wave. That would mean Wave C could end well above $2100 and that Wave E could target the $5000 level or much higher.
We’ll keep you informed of this move, but you better start planning for this upside move before you miss this bottom. And just because we like to hear it – remember, we called this move back in November 2018 – over 6 months ago.
UNIQUE OPPORTUNITY: First, we typically see stocks sell-off and as the old saying goes, “Sell in May and Go Away!” which is what has been happening.
So what does this mean? It means we should start to see money flow into the safe-haven assets like the Utility sector, bonds, and most importantly precious metals. I anticipated this and our XLU utilities ETF taken with members has already hit our first profit target, and our VIX ETF trade also hit out 15% profit target and we the balance of it is still up 25% as of yesterday.
Second, my birthday was this month, and I think its time I open the doors for a once a year opportunity for everyone to get a gift that could have some considerable value in the future.
For May I am going to give away and ship out silver rounds to anyone who buys a 1-year, or 2-year subscription to my Wealth Trading Newsletter. You can upgrade to this longer-term subscription or if you are new, join one of these two plans listed below, and you will receive:
1-Year Subscription Gets One 1oz Silver Round FREE (Could be worth hundreds of dollars)
2-Year Subscription Gets TWO 1oz Silver Rounds FREE (Could be worth a lot in the future)
I only have few silver rounds I’m giving away so upgrade or join now before its too late!
EURUSD has reached another downside target; right now, it is consolidating bear the lows. If later the price breaks this range to the upside, the instrument may be corrected to reach 1.1197; if to the downside – resume trading inside the downtrend with the target at 1.1140.
GBPUSD, “Great Britain Pound vs US Dollar”
GBPUSD is still moving downwards. Today, the pair may reach 1.2604 and then form one more ascending structure towards 1.2677. Later, the market may resume trading inside the downtrend with the target at 1.2545.
USDCHF, “US Dollar vs Swiss Franc”
USDCHF has completed its ascending structure; right now, it is being corrected downwards to reach 1.0053. After that, the instrument may resume trading upwards with the short-term target at 1.0120.
USDJPY, “US Dollar vs Japanese Yen”
USDJPY is still consolidating around 109.65 without any particular direction. If later the price breaks this range to the upside, the instrument may be corrected to reach 109.80; if to the downside – resume trading inside the downtrend with the target at 108.50.
AUDUSD, “Australian Dollar vs US Dollar”
AUDUSD is consolidating below 0.6930. Possibly, the pair may expand the range both downwards and upwards, to 0.6900 and 0.6952 respectively. If later the price breaks this range to the upside, the instrument may continue the correction to reach 0.7000; if to the downside – resume trading inside the downtrend with the target at 0.6800.
USDRUB, “US Dollar vs Russian Ruble”
USDRUB is consolidating around 64.56. Possibly, today the pair may expand the range towards 64.79 and then form a new descending structure to break 64.40. Later, the market may continue trading inside the downtrend with the target at 63.90.
XAUUSD, “Gold vs US Dollar”
Gold has reached another downside target. Today, the pair may be corrected towards 1284.28 and then start a new decline with the short-term target at 1270.47.
BRENT
Brent has broken 69.13 upwards; right now, it is moving upwards with the short-term target at 70.89. Later, the market may start another correction to reach 69.15 and then resume trading upwards with the first target at 71.30.
Attention! Forecasts presented in this section only reflect the author’s private opinion and should not be considered as guidance for trading. RoboForex LP bears no responsibility for trading results based on trading recommendations described in these analytical reviews.
As we can see in the H4 chart, after the price had reached the retracement of 61.8%, there was a convergence on MACD, which made the pair reverse and start a new correction. By now, the correction has already reached the retracement of 23.6%. In case it continues, the price may reach the retracements of 38.2% and 50.0% at 1.2824 and 1.2888 respectively. However, if the pair breaks the local low at 1.2605, the instrument may towards the key low at 1.2397.
In the H1 chart, GBPUSD is forming another pullback to the downside, which may soon be followed by a new rising wave towards the retracement of 38.2% at 1.2824. The support level is the low at 1.2605.
EURJPY, “Euro vs. Japanese Yen”
As we can see in the H4 chart, EURJPY is trading downwards and getting closer to the retracement of 61.8% at 121.60. The next downside target is the retracement of 76.0% at 120.25. The resistance level is the retracement of 38.2% at 123.86.
In the H1 chart, the pair is falling towards the retracement of 61.8% at 121.60. At the same time, there is a convergence on MACD.
Attention! Forecasts presented in this section only reflect the author’s private opinion and should not be considered as guidance for trading. RoboForex LP bears no responsibility for trading results based on trading recommendations described in these analytical reviews.
The worries about the escalation of the US/China trade conflict have lowered the demand on the risky assets. EUR/USD started to descend and updated the local minimums. An additional support to the USD is given by the positive customer trust reports in the US. The investors are waiting for additional drivers. The key levels are 1.11500 and 1.11750, you should open positions from them.
At 10:55 (GMT+3:00) the market participants will be evaluating the labour market report from Germany.
The price fixed below 200 MA which points to the power of the buyers.
The MACD histogram is in the negative zone and keeps falling, which points towards a bearish mood.
The Stochastic Oscillator is in the neutral zone, the %K line is below the %D line which recommends selling EUR/USD.
Trading recommendations
Support levels: 1.11500, 1.11300, 1.11000
Resistance levels: 1.11750, 1.12000, 1.12200
If the price fixes below 1.11500, epxect further descend towards 1.11300-1.11000.
Alternatively, the quotes can grow towards 1.12000-1.12200.
The GBP/USD currency pair
Technical indicators of the currency pair:
Prev Open: 1.26767
Open: 1.26533
% chg. over the last day: -0.15
Day’s range: 1.26420 – 1.26650
52 wk range: 1.2438 – 1.3631
The GBP/USD technical picture remains ambiguous. There is no defined trend. The financial market participants are waiting for more information regarding Brexit. The key support and resistance levels are 1.26400 and 1.26850. GBP can descend further. You should open positions from the key levels.
The Economic News Feed for 29.05.2019 is calm.
The indicators point to the power of the buyers, the price fixed below 50 MA and 200 MA.
The MACD histogram is in the negative zone but above the signal line which gives a weak signal to sell GBP/USD.
The Stochastic Oscillator is in the neutral zone, the %K line is below the %D line which also points to the bearish mood.
Trading recommendations
Support levels: 1.26400, 1.26000
Resistance levels: 1.26850, 1.27100, 1.27450
If the price fixes below 1.26400, expect further descend towards the round 1.26000.
Alternatively, the quotes can correct towards 1.27200-1.27400.
The USD/CAD currency pair
Technical indicators of the currency pair:
Prev Open: 1.34411
Open: 1.34828
% chg. over the last day: +0.33
Day’s range: 1.34822 – 1.35120
52 wk range: 1.2727 – 1.3664
CAD is weakened in comparison to the USD before the Bank of Canada meeting. The regulator is expected to keep the key interest rate of 1.75%. Keep an eye on the rhetorics of its representatives. The USD/CAD quotes are testing the key resistance at 1.35100. The nearest support is 1.34850. Open positions from these levels.
At 17:00 (GMT+3:00) the Bank of Canada will announce its decision on the key interest rate.
The price fixed above 50 MA and 200 MA which points to the power of the buyers.
The MACD histogram is in the positive zone and above the signal line which gives a strong signal to buy USD/CAD.
The Stochastic Oscillator is in the neutral zone, the %K line is above the %D line which points towards the bullish mood.
Trading recommendations
Support levels: 1.34850, 1.34650, 1.33500
Resistance levels: 1.35100, 1.35500
If the price fixes above 1.35100, expect further growth towards 1.35500-1.35700.
Alternatively, the quotes can descend towards 1.34600-1.34400.
The USD/JPY currency pair
Technical indicators of the currency pair:
Prev Open: 109.490
Open: 109.356
% chg. over the last day: -0.15
Day’s range: 109.148 – 109.435
52 wk range: 104.97 – 114.56
USD/JPY is in a bearish mood. The trading instrument is consolidating around 109.150. 109.450 acts as a mirror resistance. The demand for the safe assets remains high due to a trading conflict and ambiguous global economic trends. Keep an eye on the US Treasury bonds’ yield and open positions from the key levels.
The Economic News Feed for 29.05.2019 is calm.
The price fixed below 50 MA and 200 MA which points to the power of the buyers.
The MACD histogram is in the negative zone and below the signal line which points a strong signal to sell USD/JPY.
The Stochastic Oscillator is in the neutral zone, the %K line is crossing the %D line. There are no signals at the moment.
Trading recommendations
Support levels: 109.150, 109.000, 108.600
Resistance levels: 109.450, 109.700, 110.000
If the price fixes below 109.150, expect further descend towards 108.700-108.500.
Alternatively, the quotes can grow towards 109.600-109.800.
Yesterday, the US dollar strengthened against a basket of major currencies. The dollar index (#DX) closed in the positive zone (+0.37%). Demand for risky assets has declined as investors remain cautious due to trade conflict and uncertain growth prospects for the global economy. The financial market participants are still focused on the trade conflict between the United States and China. On Monday, US President Donald Trump said that Washington was not ready to make a deal with Beijing. At the same time, Trump demanded from the Prime Minister of Japan, Shinzo Abe, to stabilize the trade imbalance between their countries.
Optimistic economic data also supported the US currency. CB consumer confidence index was published yesterday, which counted to 134.1 in May and turned out to be higher than the forecasted value of 130.1. Today, investors will be focused on the Bank of Canada interest rate decision. It is expected that the regulator will keep the key marks of monetary policy at the same level. We recommend paying attention to the comments by the Central Bank representatives.
British Prime Minister Theresa May will resign on June 7. The election of a new leader of the Conservative Party will begin next week. Experts believe that Boris Johnson, the leader of the campaign for the Brexit in a referendum in 2016, has the highest chances to become Prime Minister.
The “black gold” prices have been declining. At the moment, futures for the WTI crude oil are testing $58.50 per barrel.
Market Indicators
Yesterday, the main US stock indices closed in the negative zone: #SPY (-0.93%), #DIA (-1.03%), #QQQ (-0.38%).
The 10-year US government bonds yield continues to decline. At the moment, the indicator is at the level of 2.23-2.24%.
The news feed on 2019.05.29:
– Report on the labor market in Germany at 10:55 (GMT+3:00); – Bank of Canada interest rate decision at 17:00 (GMT+3:00).
The afternoon price breakdown in the YM (Down Futures) continues to confirm our recent analysis. We authored a three-part research post near mid-May discussing how the global tensions would likely play out in the global stock markets. We also authored another, more recent, research post about how the US stock markets would likely find weakness as news is digested after the US Memorial Day holiday weekend. If we go far enough back in our research, we can find a very interesting research post from March 31, 2019, where our research team suggested July 2019 would be a key date for a potential market top formation.
Today, we are going to focus on the downside price rotation that is happening in the YM (Dow Futures) and how it points to an extended sideways Pennant/Flag price formation over the next few weeks before a breakdown move may cause havoc in the markets.
This Weekly YM chart highlights our expectations that the US stock market is entering a sideways price pattern formation that will likely result in a Pennant/Flag setup. After the deep downward price rotation in Jan/Feb 2018 and another one over the Oct to Dec 2018 span, this recent upside price move failed to breach our Adaptive Fibonacci bullish price trigger level near $26,990. This failure results in a “failed upside leg” currently – suggesting a new downside price leg will form in an attempt to re-establish price support before any new upside price leg will begin again.
Currently, the Bearish Fibonacci Price trigger level is near $21,415. We do not expect the YM price to fall to this level right away – yet it is a possible target if the markets fail to find any support or the global perspective changes regarding the US stock market. Our expectation is that support near $24,250 to $24,500 will hold up throughout this current rotation – over the next 4 to 10+ weeks.
This Daily YM chart provides a better shorter-term look at price rotation and our Adaptive Fibonacci price modeling system. It is clear that the recent lows near May 13 prompted a “new price low” setup. This is key to understanding the fundamental elements of the Fibonacci Price Theory. This new price low tells us the current trend is Bearish and that until the price is able to breach the $26,800 level, we should consider the trend bias to be moderately bearish. The BLUE downside price target near $24,400 now becomes our support level and the multiple lows near the $25,215 level become our immediate price floor.
This 240-minute YM chart highlights the peak/valley price rotation levels that have supported this downside price move over the past few weeks. Pay very close attention to how these peaks/valleys have all aligned in a downward trend and how our Adaptive Fibonacci price modeling system is suggesting a move toward $24,900 is about to unfold.
Now is the time for traders to prepare for a weakening US stock market price rotation with a very strong potential for a retest of support levels. Our expectations are support will be found near $24,200 (-8.9% from recent highs) or near $21,450 (-19% from recent highs). The key to how this move plays out is if the Pennant/Flag formation we are suggesting will form or not. If it does, we’ll have lots of time to prepare for this downside move. If not, it could be a very fast decline to support levels.
Remember, we’ve been warning about this move for many months. We keep suggesting that 2019 and 2020 are going to be incredible years for members of our Wealth Trading Newsletter. We’ve recently authored multiple articles calling for a July/Aug top in the markets and our research continues to suggest that Gold and Silver are dramatically undervalued right now. It’s almost like the old saying “we told you so” – but we just want everyone to be prepared for what is likely to happen. Read our research posts from earlier this year and please try to understand that our proprietary predictive modeling solutions allow us to see into the future with some extra level of clarity that many people don’t have.
3 DAYS LEFT TO GET YOUR FREE SILVER ROUNDS WITH SUBSCRIPTION!
We continue to see money flow into the safe-haven assets like the Utility sector, bonds, and most importantly precious metals. I anticipated this and our XLU utilities ETF taken with members for 4.4% already, and our VIX ETF trade we closed for a 25% last week.
For May I am going to give away and ship out silver rounds to anyone who buys a 1-year, or 2-year subscription to my Wealth Trading Newsletter. You can upgrade to this longer-term subscription or if you are new, join one of these two plans listed below, and you will receive:
A positive impact of a second Brexit referendum on financial markets would be offset by a win by the UK’s opposition Labour party, warns the CEO of one of the world’s largest independent financial advisory organisations.
The warning by Nigel Green, chief executive of deVere Group, which has $12bn under advisement, comes as Labour’s Jeremy Corbyn has vowed to back a second referendum on any Brexit deal following his party’s disastrous EU election result.
Mr Green affirms: “The uncertainty surrounding Brexit is having a real impact on business in the UK, the EU, and those around the world that trade internationally.
“This uncertainty has created a tangible lack of confidence, resulting in falling investment, spending and recruiting across Britain.
“Following MPs’ abject failure to so far find a way forward through the impasse, the next move has to be to have a second Brexit referendum in order to protect jobs and secure long-term, sustainable economic growth.”
He continues: “A second referendum would likely be welcomed by financial markets for two reasons.
“First, it gives MPs a clear, unequivocal message either way, breaks the grinding deadlock, and reduces ongoing uncertainty.
“And second, it would increase the chances of a softer Brexit, which would have the effect of producing a relief rally in Sterling, UK financial assets, and also a mini spurt in economic activity in Britain, as delayed household and business spending is unleashed.”
Mr Green goes on to add: “A confirmatory vote of this kind will likely prove to be an appealing option for much of the electorate in the UK.
“Therefore, Mr Corbyn’s new approach will in the eyes of many voters make his Labour party more electable in a general election than it has been in a long while. And this prospect will spook financial markets.
“As such, any positive impact of a second Brexit referendum on financial markets would be offset by a win by Jeremy Corbyn’s Labour party.”
Earlier this month, the deVere boss noted: “Since the beginning of the year a large and growing number of clients are telling our advisers that for their wealth they fear the damaging impact of a Jeremy Corbyn-led government more than Brexit.
“High-net-worth individuals in Britain and wealthy international investors with UK assets and business know that they will be hit by Mr Corbyn’s tax hikes on wealth, income and inheritance.
“As such, more and more of them are seeking advice on established, legitimate overseas opportunities to create, build, and importantly, protect their wealth.”
He concludes: “If it had been the government and not Mr Corbyn who shifted stance on a second referendum, the markets could have been expected to react far more favourably.”
About:
deVere Group is one of the world’s largest independent advisors of specialist global financial solutions to international, local mass affluent, and high-net-worth clients. It has a network of more than 70 offices across the world, over 80,000 clients and $12bn under advisement.
As we can see in the H4 chart, EURUSD is trading downwards. After testing the channel’s upside border, the pair formed Shooting Star pattern; right now, it is falling towards 1.1128. Possibly, later the price may break this level and continue its decline to reach the next target at 1.1111. At the same time, one shouldn’t exclude a possibility that leads to a new growth towards 1.1215.
USDJPY, “US Dollar vs. Japanese Yen”
As we can see in the H4 chart, USDJPY is trading upwards. While testing the channel’s downside border, the pair formed Engulfing pattern, which later was followed by several more reversal patterns, thus indicating a strong signal for a rebound from the support level. Right now, it is growing and may reach the next resistance level at 110.23. Later, the price may break it and continue trading towards the channel’s upside border. In case the instrument doesn’t reverse, it may break the support level and continue falling to reach 109.10.
Attention! Forecasts presented in this section only reflect the author’s private opinion and should not be considered as guidance for trading. RoboForex LP bears no responsibility for trading results based on trading recommendations described in these analytical reviews.