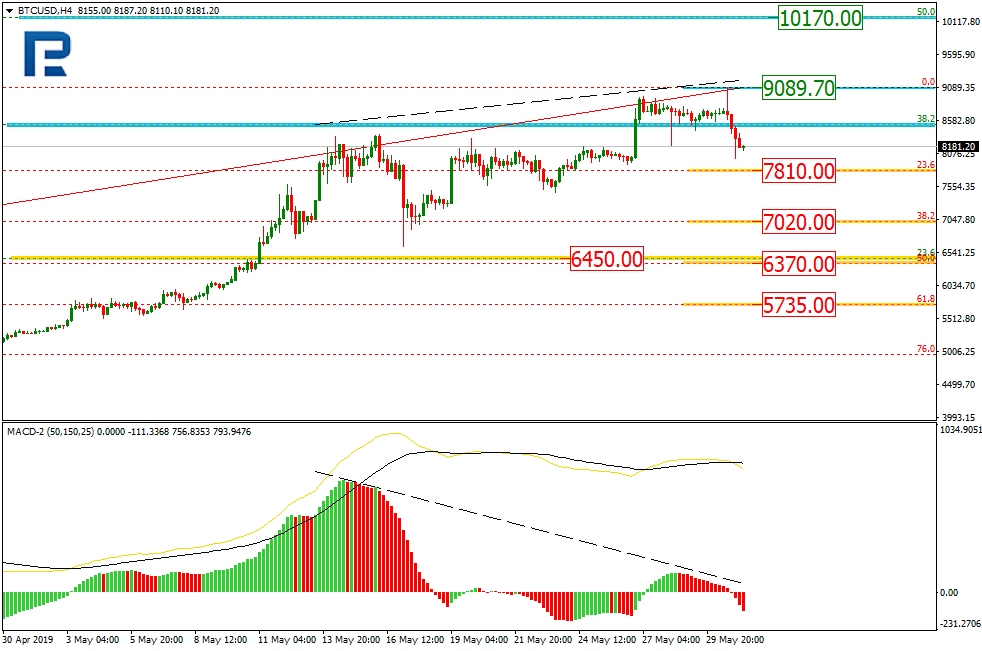
In the H4 chart, after the price had reach the retracement of 38.2%, there was a divergence on MACD, which may indicate a new correction. The key support level is the retracement of 23.6% at 6450.00. After completing the correction and breaking the high at 9089.70, BTCUSD may started a new rising wave to reach the retracement of 50.0% at 10170.00.
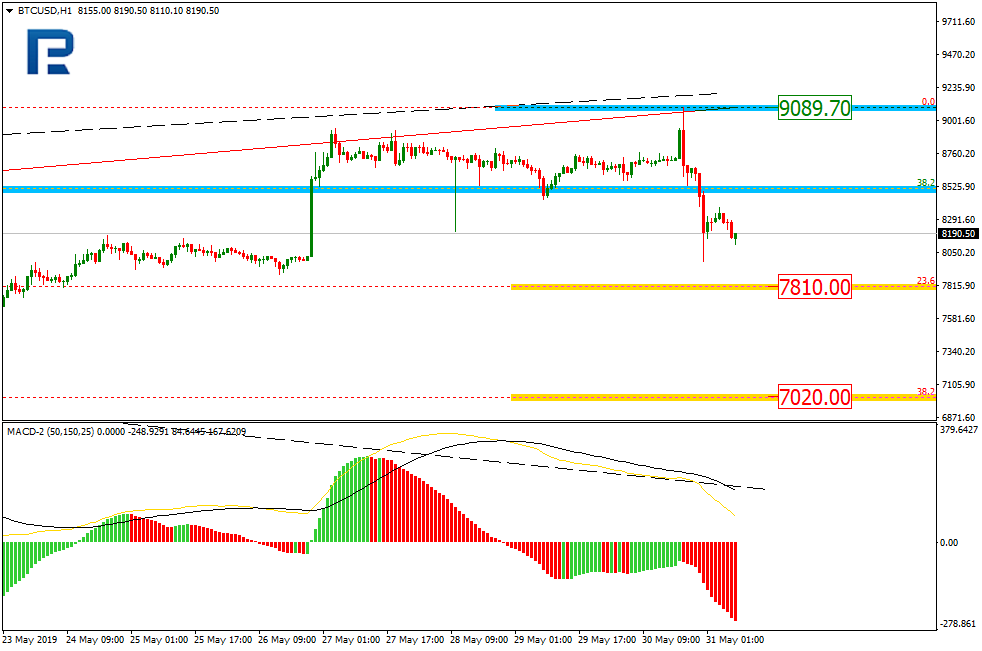
In the H1 chart. BTCUSD is trading downwards to reach the retracement of 23.6% at 7810.00. The next downside targets may be the retracement of 38.2%, 50.0%, and 61.8% at 7020.00, 6370.00, and 5735.00.
ETHUSD, “Ethereum vs. US Dollar”
As we can see in the H4 chart, after ETHUSD had updated the previous high, there was a divergence on MACD, which may indicate a possible pullback or a trend reverse. By now, the price has already reached the retracement of 23.6% and may continue trading downwards. However, the mid-term rising tendency may yet continue. A new ascending impulse may be heading to break the high at 288.82 and reach the retracement of 38.2% at 367.00.
The H1 chart shows the targets of the current descending correction; the closest ones is the retracement of 38.2% at 234.70. The next targets may be the retracements of 50.0%, 61.8%, and 76.0% at 218.07, 201.00, and 180.95 respectively.
Attention! Forecasts presented in this section only reflect the author’s private opinion and should not be considered as guidance for trading. RoboForex LP bears no responsibility for trading results based on trading recommendations described in these analytical reviews.
EUR stabilized after a long fall since the beginning of the week. The quotes are moving sideways and testing the key levels at 1.11200 and 1.11450. Donald Trump earlier announced that on June 10 the US will introduce a 5% fee on all goods imported from Mexico. The increase of tension in the world economy lowers the demand on the risky assets. Further descend of EUR/USD remains possible. Open the positions from the key levels.
The Economic News Feed for 31.05.2019:
– Real Personal Consumption (MoM) (US) – 15:30 (GMT+3:00);
– Michigan Expectations Indices (US) – 17:00 (GMT+3:00);
The price fixed below 50 MA and 200 MA which points to the power of the sellers.
The MACD histogram is in the negative zone but above the signal line which gives a weak signal to sell EUR/USD.
The Stochastic Oscillator is in the neutral zone, the %K line is crossing the %D line. There are no signals at the moment.
Trading recommendations
Support levels: 1.11200, 1.11000
Resistance levels: 1.11450, 1.11600, 1.11800
If the price fixes below 1.11200, expect further descend towards 1.11000-1.10700.
Alternatively, the quotes can grow towards 1.11600-1.11800.
The GBP/USD currency pair
Technical indicators of the currency pair:
Prev Open: 1.26201
Open: 1.26091
% chg. over the last day: -0.16
Day’s range: 1.25988 – 1.26166
52 wk range: 1.2438 – 1.3631
GBP stabilized after a long fall. The GBP/USD quotes are consolidating around 4-month minimums. The support and resistance levels are 1.25850 and 1.26200. The financial market participants are waiting for relevant info regarding Brexit. A technical correction is possible soon. You should open positions from the key levels.
The Economic News Feed for 31.05.2019 is calm.
The price fixed below 50 MA and 200 MA which points to the power of the sellers.
The MACD histogram is in the negative zone but above the signal line which gives a weak signal to buy GBP/USD.
The Stochastic Oscillator is in the neutral zone, the %K line is above the %D line which points to the correction of GBP/USD.
Trading recommendations
Support levels: 1.25850, 1.25500
Resistance levels: 1.26200, 1.26500, 1.26850
If the price fixes above 1.26200, expect further correction towards 1.26500-1.26800.
Alternatively, the quotes can fall towards 1.25600-1.25400.
The USD/CAD currency pair
Technical indicators of the currency pair:
Prev Open: 1.34828
Open: 1.35164
% chg. over the last day: +0.17
Day’s range: 1.34937 – 1.35205
52 wk range: 1.2727 – 1.3664
USD/CAD stabilized after a long rally. The quotes are consolidating around 1.34850 and 1.35200. The Bank of Canada kept the monetary policy at the same levels. We expect important reports from the US. Keep an eye on the oil quotes dynamics and open positions from the key levels.
At 15:30 (GMT+3:00) Canada will publish CFTC CAD speculative net positions.
The indicators do not provide precise signals, the price is testing 50 MA.
The MACD histogram is in the positive zone but started to descend, which gives a weak signal to buy USD/CAD.
The Stochastic Oscillator is in the neutral zone, the %K line has crossed the %D line. There are no signals at the moment.
Trading recommendations
Support levels: 1.34850, 1.34550, 1.34300
Resistance levels: 1.35200, 1.35450
If the price fixes above 1.35200, expect further growth towards 1.35450-1.35700.
Alternatively, the quotes can descend towards 1.34600-1.34400.
The USD/JPY currency pair
Technical indicators of the currency pair:
Prev Open: 109.587
Open: 109.596
% chg. over the last day: +0.02
Day’s range: 108.782 – 109.621
52 wk range: 104.97 – 114.56
USD/JPY started to descend. During the last two days the quotes fell by 75 points. The trading instrument updated the key extremums. The trading conflict escalation introduced new demand for the safe assets. The quotes are testing the support at 108.800 and resistance at 109.150. JPY has prospects for further descend. You should open positions from the key levels.
Keep an eye on the US news feed.
The price fixed below 50 MA and 200 MA which points to the power of the buyers.
The MACD histogram is in the negative zone and below the signal line which gives a strong signal to sell USD/JPY.
The Stochastic Oscillator is in the oversold zone, the %K line is crossing the %D line. There are no signals at the moment.
Trading recommendations
Support levels: 108.800, 108.500
Resistance levels: 109.150, 109.300, 109.600
If the price fixes below 108.800 expect further descend towards 108.500-108.300.
Alternatively, the quotes can recover towards 109.400-109.600.
Yesterday, the US dollar did not change a lot against the basket of major currencies. The dollar index (#DX) closed with a slight increase (+0.02%). Investors’ sentiment has worsened after it became known that the United States would intend to impose 5% duties on all Mexican goods from June 10. “On June 10th, the United States will impose a 5% Tariff on all goods coming into our Country from Mexico, until such time as illegal migrants coming through Mexico, and into our Country, STOP,” Trump tweeted. The president also noted that the size of the tariff would increase until the flow of migrants stopped. Trade tensions with other countries could adversely affect the growth rate of the global economy.
Yesterday, mixed economic data from the US was also published. Thus, GDP growth (q/q) counted to 3.1%, which met the expectations of experts. However, pending home sales index declined by 1.5% in April, although investors forecasted growth by 0.9%.
Today, during the Asian trading session China manufacturing PMI has been published, which has counted to 49.4 in May and has occured to be worse than the expected value of 49.9. We expect important economic statistics from Canada.
The “black gold” prices fell by more than 4% due to trade conflicts. At the moment, futures for the WTI crude oil are testing $56.00 per barrel. At 20:00 (GMT+3:00) a report on Baker Hughes oil rig count will be published.
Market Indicators
Yesterday, the main US stock indices closed in the positive zone: #SPY (+0.27%), #DIA (+0.24%), #QQQ (+0.42%).
The 10-year US government bonds yield fell significantly. Currently, the indicator is at the level of 2.17-2.18%.
The news feed on 2019.05.31:
– Canada GDP data at 15:30 (GMT+3:00); – Core personal consumption expenditures (PCE) price index in the US at 15:30 (GMT+3:00); – Michigan consumer expectations and sentiment at 17:00 (GMT+3:00).
As we move into the weekly close, we should have a deeper look into the USD/JPY.
After 10-year US Treasury yields dropped to their lowest levels since 2017, and the potential of a risk-off hitting Equity markets after the SP500 CFD confirmed its double-top trend with the break below 2,800 points. This leaves the US equity index vulnerable to further losses (technically projected as low as 2,700 points), the focus in the USD/JPY switches to the crucial support region around 108.70/109.00.
While today’s economic numbers are considered to be of lesser objective interest than next week’s juicy economic docket. Disappointing US data could add further fuel to an accelerated unwinding of carry trades and capital backflows into the JPY.
If such a development arrives at the same time as a break below 108.70, a potential projected target on the downside can be found around 107.50. In the coming days, further losses as low as the January Flash Crash lows around 105.00 are a serious option.
Only if we can hold above 108.70/109.00, and go for reconquering 110.70 on a daily close, a stint as low as 105.00, the region around the January Flash Crash lows could be avoided, but seems unlikely.
Source: Admiral Markets MT5 with MT5-SE Add-on USD/JPY Daily chart (between May 2, 2018, to May 30, 2019). Accessed: May 30, 2019, at 10:00pm GMT – Please note: Past performance is not a reliable indicator of future results, or future performance.
In 2014, the value of the USD/JPY increased by 13.7%, in 2015, it increased by 0.5%, in 2016, it fell by 2.8%, in 2017, it fell by 3.6%, in 2018, it fell by 2.7%, meaning that after five years, it was up by 4.1%.
Investing in Forex with Admiral Markets
Admiral Markets offers professional traders the ability to trade with a custom, upgraded version of MetaTrader 5, allowing you to experience trading at a significantly higher, more rewarding level. Experience benefits such as the addition of the Market Heat Map, so you can compare various currency pairs to see which ones might be lucrative investments, access real-time trading data, and so much more. Click the banner below to start your FREE download of MT5 Supreme Edition!
Disclaimer: The given data provides additional information regarding all analysis, estimates, prognosis, forecasts or other similar assessments or information (hereinafter “Analysis”) published on the website of Admiral Markets. Before making any investment decisions please pay close attention to the following:
This is a marketing communication. The analysis is published for informative purposes only and are in no way to be construed as investment advice or recommendation. It has not been prepared in accordance with legal requirements designed to promote the independence of investment research, and that it is not subject to any prohibition on dealing ahead of the dissemination of investment research.
Any investment decision is made by each client alone whereas Admiral Markets shall not be responsible for any loss or damage arising from any such decision, whether or not based on the Analysis.
Each of the Analysis is prepared by an independent analyst (Jens Klatt, Professional Trader and Analyst, hereinafter “Author”) based on the Author’s personal estimations.
To ensure that the interests of the clients would be protected and objectivity of the Analysis would not be damaged Admiral Markets has established relevant internal procedures for prevention and management of conflicts of interest.
Whilst every reasonable effort is taken to ensure that all sources of the Analysis are reliable and that all information is presented, as much as possible, in an understandable, timely, precise and complete manner, Admiral Markets does not guarantee the accuracy or completeness of any information contained within the Analysis. The presented figures refer that refer to any past performance is not a reliable indicator of future results.
The contents of the Analysis should not be construed as an express or implied promise, guarantee or implication by Admiral Markets that the client shall profit from the strategies therein or that losses in connection therewith may or shall be limited.
Any kind of previous or modeled performance of financial instruments indicated within the Publication should not be construed as an express or implied promise, guarantee or implication by Admiral Markets for any future performance. The value of the financial instrument may both increase and decrease and the preservation of the asset value is not guaranteed.
The projections included in the Analysis may be subject to additional fees, taxes or other charges, depending on the subject of the Publication. The price list applicable to the services provided by Admiral Markets is publicly available from the website of Admiral Markets.
Leveraged products (including contracts for difference) are speculative in nature and may result in losses or profit. Before you start trading, you should make sure that you understand all the risks.
I have been pouring over the longer term charts as we’ve started to see Oil and Gold move in directions that would indicate increased fear throughout the global markets while a contraction in economic activity/oil prices appears to be setting up for another big move. The objective is to attempt to identify longer-term volatility expectations and price targets. To accomplish this task, we use our Adaptive Fibonacci predictive modeling utility on 3 Week charts because they provide a unique look at price activity and are a bit more reactive to shorter-term price activity than Monthly price bars.
We found some very interesting components by reviewing these charts of the ES, NQ, YM, and CL. We believe we are setting up a 2~4+ week sideways price rotation in the US stock market as price attempts to consolidate within this range before a broader breakout/breakdown move could happen. Just as we predicted many months ago, the July 2019 price peak we suggested could form appears to be setting up with a sideways pennant/flag formation as investors digest the economic and global trade war news data.
Eventually, the price will make a move in an attempt to break this sideways price channel and our predictive modeling solutions can help us to understand how these price setups will playing out. Let’s get into the charts and research.
As we start to pull apart the data from these charts, we urge you to pay attention to two things – the range of the current Bullish & Bearish Fibonacci Price Trigger levels and current price rotations of price peaks and troughs over the past 40 to 60 bars. It is very important to understand and attempt to use the “new price high” and “new price low” Fibonacci price theory that we keep talking about in our articles.
This first chart is the ES 3-Week chart highlighting the range between the Fibonacci Bullish and Bearish Price Trigger Levels (highlighted in light-CYAN). It is important to understand why the current bearish price trigger level is so far below current price levels. The Adaptive Fibonacci modeling system adjusts trigger levels based on recent price activity and price volatility to attempt to identify when the price is congesting in a sideways price trend or trending upward or downward. When price congests in a sideways form, the Adaptive Fibonacci modeling tool identifies this and determines that price would need to move to new levels in order to qualify for a new bullish or bearish price trigger. In this case, it is suggesting that price would need to fall below $2014 before this 3-Week chart would qualify the move as a “new bearish trend”.
That is a big move from current levels. It totals more than -750 points – a -27.5% price decline.
Currently, as long as the ES price stays above the $2633 level, the Fibonacci predictive modeling system is still suggesting the Bullish trend is intact and should continue.
This NQ 3-Week chart is setup in a similar manner to the ES chart. Although the Fibonacci volatility range on the NQ chart is much more narrow than the ES chart, the Fibonacci modeling system is still suggesting that the current trend is still Bullish and the key levels for the triggers are $6792 for the Bearish Trigger level and $6556 for the Bullish Trigger level.
Because of the narrow volatility range and because the Bearish trigger level is above the Bullish trigger level, we believe a price rotation where the price stays above $6800 is very likely over the next few weeks. Obviously, should price break below the Bearish Trigger level, then we would begin to become concerned that a broader downside trend is being established and start to look at the Fibonacci downside price targets (near $5815 & $3900). Until that happens, expect sideways price rotation with a 250 to 500 point range on average (about 2x the Fibonacci volatility range).
The YM is really the key to understanding just how the markets are going to play out over the next few weeks and months. The extremely large Fibonacci volatility range on the YM chart highlights the potential for the wild sideways price rotation that we are expecting over the next few weeks and months. Remember, our analysis from many months ago suggests a price peak will likely form in July/August 2019 and prompt a broader downside price move after this peak completes. Our expectation that a current sideways price channel is setting up leads us to believe the apex of this sideways price channel may result in a very brief price rally (pushing prices back towards recent highs) before rolling over and starting a new downside price move to coincide with our July/Aug 2019 predictions.
One way or another, it appears the DOW/YM will be leading the way in terms of price volatility and rotation. The wide range between the Bullish and Bearish Fibonacci Price Trigger Levels is suggesting that price volatility is increasing and that the YM would have to move to levels above $29,750 or to levels below $18,875 before establishing any new price trends. The past Fibonacci trigger levels help us to understand key price levels as this future move takes place.
Past Fibonacci Trigger Price levels are $26,025 for a Bearish Price Trigger level and $24,770 for a Bullish Price Trigger Level. This means if the price is below $26,025 – we should expect a bearish price trend to continue and if the price is above $24,770 – we should expect a bullish price trend to continue. Yet, price is current BETWEEN both of these levels, so what should we expect right now? When the price is in between these levels, like now, we typically look for the last price rotation (peak or valley) and for the last level that was crossed (in this case the $26,025 Bearish level) and would conclude:
The trend is currently Bearish and the $26,025 level is key to maintaining this bearish price direction. Should price move back above this level and close above this Bearish Price Trigger Level, then we would consider the trend “moderately bullish” while we wait for a new Price Trigger Level Breach to setup.
Lastly, Crude Oil. We’ve been writing to all of our followers that we felt Oil was setting up for a price rotation many weeks ago. We warned that the $65 price level may be the end of the move and that the $55 to $50 levels are the likely downside targets. The volatility range is somewhat narrow and the last Trigger Level that was breached was the Bearish Trigger Level near $68.75. Therefore, we believe the recent downside price move, below the $60 Bullish Trigger level, results in a new Bearish price trend with immediate targets near or below $50. Ultimately, the $42.40 level may be the longer term downside price target – which would coincide with a broader commodities slowdown and global economic activity contraction.
So here is what you need to know to go into this weekend and for the next 4+ weeks.
Expect the US stock market to trade in a moderately volatile sideways price channel for the next 4+ weeks.
Expect the end of this price channel to result in a “false rally” move that may push prices towards recent highs before faltering and rotating back to the downside.
Expect this END of the sideways price channel to happen sometime near mid-July or early August 2019.
Expect Gold and Oil to continue to react as “fear measures” over the next few weeks/months as global traders reposition their assets throughout this rotation.
Expect a bigger price move near late July through September~October 2019 as this volatility move really begins to take root with equities.
Follow our research and learn how we can help you stay well ahead of these price moves. We’ve just highlighted what is likely to happen over the next 30 to 60 days in this research post. Want to know how we are going to trade these moves? Join our other members to see how we create success and keep our members ahead of these big moves. Also, if you wanted me to ship you free silver rounds with a subscription to this Wealth Trading Newsletter you better join today as this offer expires June 1st.
Brexit Britain has already lost three years – and the nightmare could last well beyond the new Halloween deadline, warns the boss of one of the world’s largest independent financial advisory organizations.
The warning from Nigel Green, the chief executive and founder of deVere Group, comes as news breaks on Thursday that factory shutdowns designed to cope with disruption from a March 29 Brexit that never came, slashed UK car production in April by almost 45 per cent.
It also follows Jeremy Corbyn confirming that Labour will back a referendum on any Brexit deal.
Mr Green says: “Brexit has thrown Britain into a profound existential crisis.
“It has cost Britain three lost years of opportunity. Brexit has almost entirely overtaken the public sphere in Britain. All of Parliament’s time and energy is vested in Brexit. It appears nothing else is getting done. And so much needs to be done.
“Imagine what amazing social and economic progress could have been achieved if the media, political life and the civil service had been dominated by ‘best in class’ individuals and organisations building an inclusive, long-term, sustainable economic growth strategy for the last three years?
“Imagine if these three years had been about retaining existing and welcoming new investment into the UK?
“Imagine if the industries of the future, such as fintech, blockchain and clean energy, had been developed to secure jobs and wealth creators of the next generation?
“Imagine if Britain hadn’t spent three years inflicting reputational damage upon itself on the world stage?
“But instead, the UK has lost three years going around in circles trying to construct a deal that gives us some of what it’s got now.”
He continues: “Brexit Britain has cost billions upon billions of pounds.
“Indeed, it has cost the UK economy a staggering £66bn in just under three years, according to S&P Global Ratings.
“Speaking from experience, the lack of confidence in the UK’s vital financial services sector – which contributes 6.5 per cent to Britain’s GDP – is at an all-time low.
“Following years of uncertainty and a lack of leadership from all parties, many companies across the sector have relocated parts of their business or key staff to places like Paris, Luxembourg, Dublin, Frankfurt and Amsterdam, or setting up legal entities in the EU. Once they’ve gone, they are unlikely to return. And this is just one sector.
“There’s also been the significant drop in the value of the pound. This has contributed to reducing people’s purchasing power. Weaker sterling means imports are more expensive, with rising prices typically being passed on to consumers.
“For the government’s part, the Treasury has allocated £4.2 billion towards government departments for Brexit preparations since 2016; the 2017 general election which was held due to Brexit ramifications cost £269m; and let’s not forget, the £39bn “divorce bill” agreed with the EU.”
Mr Green goes on to add: “The ongoing Brexit nightmare is unlikely to end on Halloween.
“After three years, the uncertainty grows rather than recedes. Who will be the Prime Minister that will take the UK out of the EU? Will there be a second referendum and what would be on the ballot paper? How does the rise and rise of the Brexit Party fragment politics further? Will Britain leave with no deal? What impact would operating on WTO rules mean for the world’s fifth largest economy and its trading partners?”
The deVere CEO concludes: “With so many serious and far-reaching questions hanging ominously unanswered – and more growing each week – Brexit Britain’s Lost Years are not even close to being over.
“The haemorrhaging of opportunity and money will continue far beyond the deadline.
“It is perhaps therefore unsurprising that UK and international investors in UK assets are responding to the uncertainties posed by Brexit by considering removing their wealth from the UK.”
About:
deVere Group is one of the world’s largest independent advisors of specialist global financial solutions to international, local mass affluent, and high-net-worth clients. It has a network of more than 70 offices across the world, over 80,000 clients and $12bn under advisement.
UNIQUE OPPORTUNITY: First, we typically see stocks sell-off and as the old saying goes, “Sell in May and Go Away!” which is what has been happening.
So what does this mean? It means we should start to see money flow into the safe-haven assets like the Utility sector, bonds, and most importantly precious metals. I anticipated this and our XLU utilities ETF taken with members has already hit our first profit target, and our VIX ETF trade also hit out 15% profit target and we the balance of it is still up 25% as of yesterday.
Second, my birthday was this month, and I think its time I open the doors for a once a year opportunity for everyone to get a gift that could have some considerable value in the future.
For May I am going to give away and ship out silver rounds to anyone who buys a 1-year, or 2-year subscription to my Wealth Trading Newsletter. You can upgrade to this longer-term subscription or if you are new, join one of these two plans listed below, and you will receive:
1-Year Subscription Gets One 1oz Silver Round FREE (Could be worth hundreds of dollars)
2-Year Subscription Gets TWO 1oz Silver Rounds FREE (Could be worth a lot in the future)
I only have few silver rounds I’m giving away so upgrade or join now before its too late!
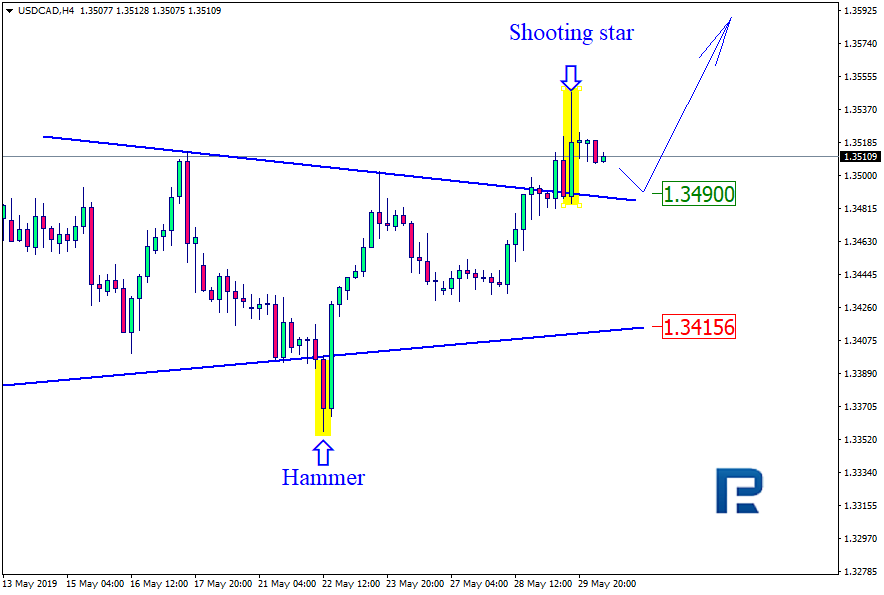
In the H4 chart, USDCAD is trading inside the triangle. After breaking the resistance level, the price formed Shooting Star pattern. Right now, we can see a pullback that is heading towards 1.3490. Later, the market may rebound from this level and resume trading upwards. In this case, the instrument may complete the triangle. If the pair breaks 1.3490, the instrument may fall to reach 1.3415.
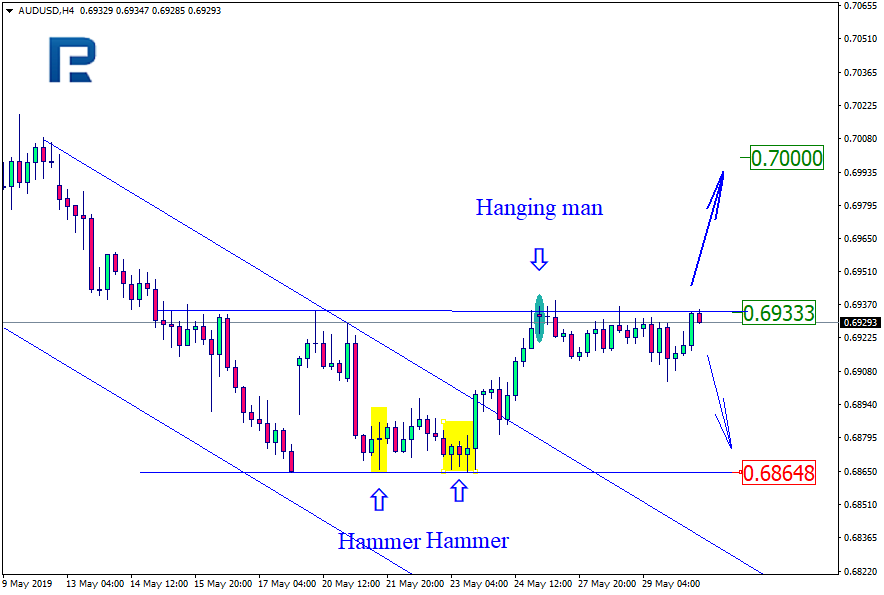
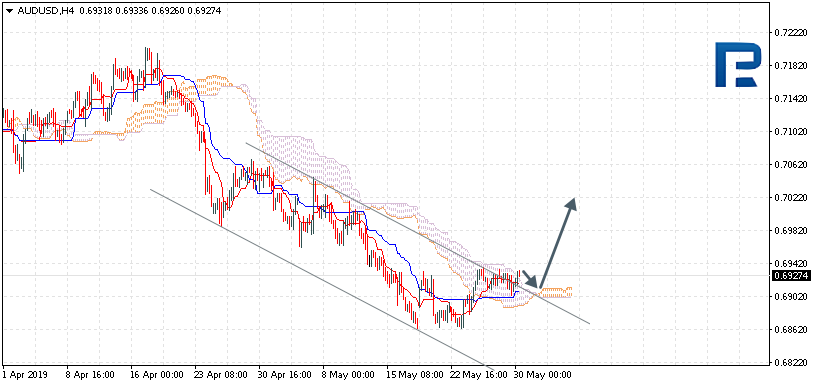
AUDUSD, “Australian Dollar vs US Dollar”
As we can see in the H4 chart, the descending tendency continues. After testing the resistance level, AUDUSD formed Hanging Man and then several more reversal patterns, which may be considered as a strong signal for a reverse. Right now, the pair is moving sideways close to the channel’s upside border; this movement may be considered as a consolidation before rebounding from the resistance level and starting a new decline towards 0.6864. However, we shouldn’t ignore a possibility that the instrument may break this level and resume its growth to reach 0.7000.
Attention! Forecasts presented in this section only reflect the author’s private opinion and should not be considered as guidance for trading. RoboForex LP bears no responsibility for trading results based on trading recommendations described in these analytical reviews.
AUDUSD is trading at 0.6927; the instrument is moving above Ichimoku Cloud, thus indicating an ascending tendency. The markets could indicate that the price may test the upside border of the cloud at 0.6910 and then resume moving upwards to reach 0.7025. Another signal to confirm further ascending movement is the price’s rebounding from the channel’s upside border. However, the scenario that implies further growth may be cancelled if the price breaks the downside border of the cloud and fixes below 0.6865. In this case, the pair may continue falling towards 0.6755.
NZDUSD, “New Zealand Dollar vs US Dollar”
NZDUSD is trading at 0.6520; the instrument is moving inside Ichimoku Cloud, thus indicating a sideways tendency. The markets could indicate that the price may test the upside border of the cloud at 0.6535 and then resume moving downwards to reach 0.6415. Another signal to confirm further descending movement is the price’s rebounding from the Triangle’s upside border. However, the scenario that implies further decline may be cancelled if the price breaks the upside border of the cloud and fixes above 0.6565. In this case, the pair may continue growing towards 0.6655. After breaking the Triangle’s downside border and fixing below 0.6470, the price may continue moving downwards.
USDCAD, “US Dollar vs Canadian Dollar”
USDCAD is trading at 1.3508; the instrument is moving above Ichimoku Cloud, thus indicating an ascending tendency. The markets could indicate that the price may test the upside border of the cloud at 1.3495 and then resume moving upwards to reach 1.3585. Another signal to confirm further ascending movement is the price’s rebounding from the support level. However, the scenario that implies further growth may be cancelled if the price breaks the downside border of the cloud and fixes below 1.3455. In this case, the pair may continue falling towards 1.3375.
Attention! Forecasts presented in this section only reflect the author’s private opinion and should not be considered as guidance for trading. RoboForex LP bears no responsibility for trading results based on trading recommendations described in these analytical reviews.
EUR kept losing positions against the USD. The quotes have set the new local minimums. The pressure on the EUR was caused by the weak labour market report from Germany. The US/China trading conflict remains in the spotlight. Beijing claimed that they are not going to use precious metals in as leverage in the war. Right now the quotes are consolidating between 1.11300 and 1.11500. The trading instrument can descend further. The investors are evaluating the US economic releases. You should open positions from the key levels.
The Economic News Feed for 30.05.2019:
– GDP report (US) – 15:30 (GMT+3:00);
– Jobless Claims (US) – 15:30 (GMT+3:00);
– Unfinished Real Estate Purchases (EU) – 17:00 (GMT+3:00);
The price fixed below 50 MA and 200 MA which points to the power of the sellers.
The MACD histogram is in the negative zone, the %K line is below the %D line which also points to the bearish mood.
The Stochastic Oscillator is in the neutral zone, the %K line is below the %D line which also points to the bearish mood.
Trading recommendations
Support levels: 1.11300, 1.11100
Resistance levels: 1.11500, 1.11750, 1.12000
If the price fixes below 1.11300, expect further descend towards 1.11000-1.10800.
Alternatively, the quotes can grow towards 1.11700-1.11900.
The GBP/USD currency pair
Technical indicators of the currency pair:
Prev Open: 1.26533
Open: 1.26201
% chg. over the last day: -0.19
Day’s range: 1.26111 – 1.26403
52 wk range: 1.2438 – 1.3631
GBP/USD remains in a bearish mood. GBP is under pressure due to the Brexit ambiguousness. GBP/USD quotes are consolidating. The key support and resistance levels are 1.26100 and 1.26500. GBP has prospects for a further descend. The financial market participants are evaluating important economic reports. You should open positions from the key levels.
The Economic News Feed for 30.05.2019 is calm.
The indicators point to the power of the sellers, the price fixed below 50 MA and 200 MA.
The MACD histogram is in the negative zone but above the signal line which gives a weak signal to sell GBP/USD.
The Stochastic Oscillator is in the neutral zone, the %K line is below the %D line which also points to the bearish mood.
Trading recommendations
Support levels: 1.26100, 1.25600
Resistance levels: 1.26500, 1.26850, 1.27100
If the price fixes below 1.26100, expect further descend towards the round 1.25700-1.25500.
Alternatively, the quotes can correct towards 1.26800-1.27000.
USD/CAD stabilized after a long rally. CAD is consolidating. The key support and resistance levels are 1.34850 and 1.35200. The Bank of Canada, as expected, kept the key monetary policy at the same levels. We expect important reports from the US. Keep an eye on the oil quotes dynamics and open positions from the key levels.
at 15:30 (GMT+3:00) Canada will publish a current operation balance report.
The indicators do not provide precise signals, the price is testing 50 MA.
The MACD histogram is in the positive zone but started to descend which gives a weak signal to buy USD/CAD.
The Stochastic Oscillator is in the neutral zone, the %K line is crossing the %D line. There are no signals at the moment.
Trading recommendations
Support levels: 1.34850, 1.34550, 1.34300
Resistance levels: 1.35200, 1.35450
If the price fixes above 1.35200, expect further growth towards 1.35450-1.35700.
Alternatively, the quotes can descend towards 1.34600-1.34400.
The USD/JPY currency pair
Technical indicators of the currency pair:
Prev Open: 109.356
Open: 109.587
% chg. over the last day: +0.17
Day’s range: 109.476 – 109.826
52 wk range: 104.97 – 114.56
USD/JPY started to grow and updated the local maximums. The quotes are consolidating next to 109.800 resistance level. 109.550 acts as a mirror support. The US economic reports are in the spotlight. Keep an eye on the intel regarding Brexit and open positins from the key levels.
The Economic News Feed for 30.05.2019 is calm.
The price fixed between 50 MA and 200 MA. There are no signals at the moment.
The MACD histogram is in the positive zone and above the signal line which gives a strong signal to sell USD/JPY.
The Stochastic Oscillator is near the overbought zone, the %K line is crossing the %D line. There are no signals at the moment.
Trading recommendations
Support levels: 109.550, 109.300, 109.150
Resistance levels: 109.800, 110.000, 110.250
If the price fixes above 109.800, expect further growth towards 110.000-110.250.
Alternatively, the quotes can descend towards 109.350-109.150.