Author Archive for InvestMacro – Page 225

The Analytical Overview of the Main Currency Pairs on 2019.06.06

by JustForex

The EUR/USD currency pair

Technical indicators of the currency pair:
  • Prev Open: 1.12514
  • Open: 1.12209
  • % chg. over the last day: -0.21
  • Day’s range 1.12209 – 1.12359
  • 52 wk range: 1.1111 – 1.2009

EUR/USD recovered a portion of the losses against the other majors. It is supported by the positive business activity reports in the non-indurstrial sector. At the same time, the ADP report on the labour market was remarkably weak. EUR/USD is consolidating, the local support and resistance are 1.12200 and 1.12500. Today the Central Bank of Europe will announce its decision on the key interest rate. It is expected to preserve the monetary policy at the same levels. Keep an eye on the statementes by the FOMC and CBE representatives and open positions from the key levels.

The Economic News Feed for 06.06.2019:

  • – GDP report (EU) – 12:00 (GMT+3:00);
  • – Key Interest Rate Announcement (EU) – 14:45 (GMT+3:00);
  • – Primary Jobless Clains Report (US) – 15:30 (GMT+3:00);
EUR/USD

The indicators do not provide precise signlas, the price fixed between 50 MA and 200 MA.

The MACD histogram is in the negative zone but above the signal line which gives a weak signal to sell EUR/USD.

The Stochastic Oscillator is in the overbought zone, the %K line started to cross the %D line. There are no signals right now.

Trading recommendations
  • Support levels: 1.12200, 1.11900, 1.11600
  • Resistance levels: 1.12500, 1.12750, 1.13000

If the price fixes above 1.12500, expect further growth towards 1.13000.

Alternatively, the quotes can correct further towards 1.11700-1.11500.

The GBP/USD currency pair

Technical indicators of the currency pair:
  • Prev Open: 1.26988
  • Open: 1.26834
  • % chg. over the last day: -0.08
  • Day’s range: 1.26741 – 1.26939
  • 52 wk range: 1.2438 – 1.3631

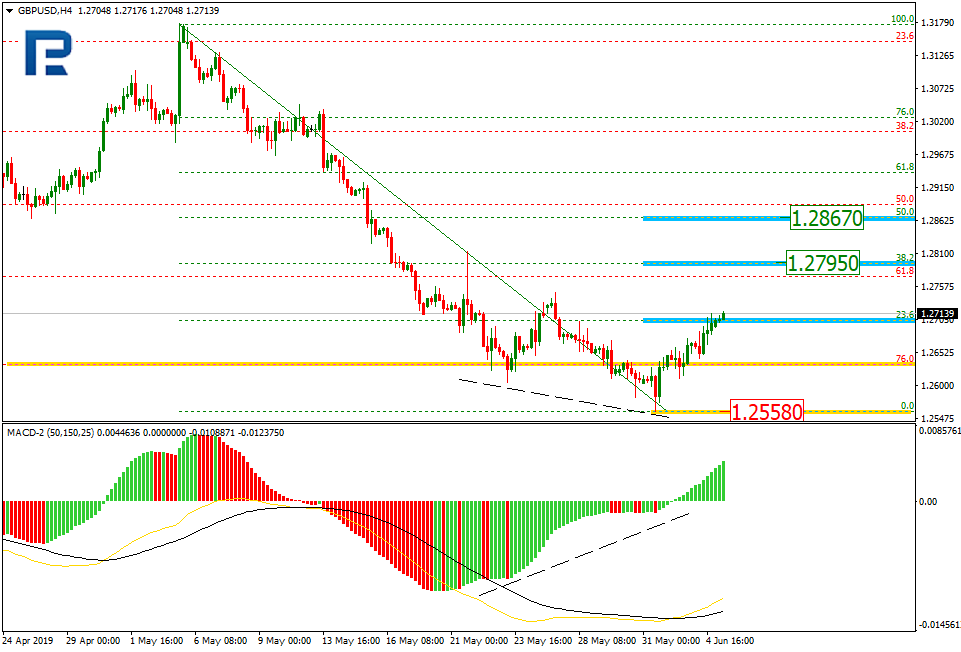
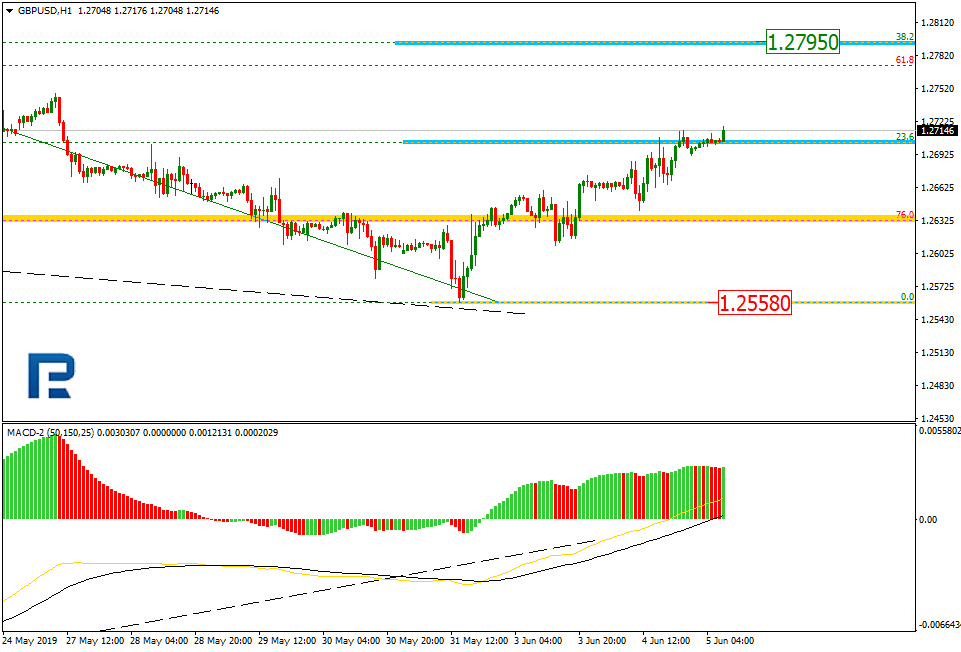
GBP/USD retreated from the local maximums. The demand for the USD recovered after the positive business activity reports. The GBP/USD quotes are consolidating at 1.26750 and 1.27100. The market participants are waiting for relevant data regarding Brexit. Some economists at Reuters expect the GBP to reach a paritet with EUR should the UK leave the EU without an agreement. Open positions from the key levels.

The Economic News Feed for 06.06.2019 is calm.

GBP/USD

The indicators do not provide precise signals, the price fixed between 50 MA and 200 MA.

The MACD histogram is in the negative zone, which points to the bearish mood.

The Stochastic Oscillator is in the neutral zone, the %K line is crossing the %D line. There are no signals at the moment.

Trading recommendations
  • Support levels: 1.26750, 1.26400, 1.26100
  • Resistance levels: 1.27100, 1.27450

If the price fixes above 1.27100, expect further growth towards 1.27400-1.27600.

Alternatively, the qutoes can descend towards 1.26400-1.26200.

The USD/CAD currency pair

Technical indicators of the currency pair:
  • Prev Open: 1.33923
  • Open: 1.34145
  • % chg. over the last day: +0.22
  • Day’s range: 1.34075 – 1.34301
  • 52 wk range: 1.2727 – 1.3664

USD/CAD is in a bullish mood. The trading instrument set the new local maximums. The pressure on the CAD is caused by the agressive sales on the oil market. Right now the quotes are consolidating around 1.34000-1.34300 and have prospects for further correction. Expect important economic reports and open positions from the key levels.

At 17:00 (GMT+3:00) Ivey will publish a business activity index for Canada.

USD/CAD

The price fixed between 50 MA and 200 MA. There are no signals at the moment.

The MACD histogram is in the positive zone but below the signal line which gives a weak signal to buy USD/CAD.

The Stochastic Oscillator is in the oversold zone, the %K line is crossing the %D line. There are no signals at th moment.

Trading recommendations
  • Support levels: 1.34000, 1.33650, 1.33500
  • Resistance levels: 1.34300, 1.34600, 1.34850

If the price fixes above 1.34300 expect further correction towards 1.34600-1.34850.

Alternatively, the quotes can descend towards 1.33700-1.33500.

The USD/JPY currency pair

Technical indicators of the currency pair:
  • Prev Open: 108.136
  • Open: 108.464
  • % chg. over the last day: +0.17
  • Day’s range: 108.070 – 108.464
  • 52 wk range: 104.97 – 114.56

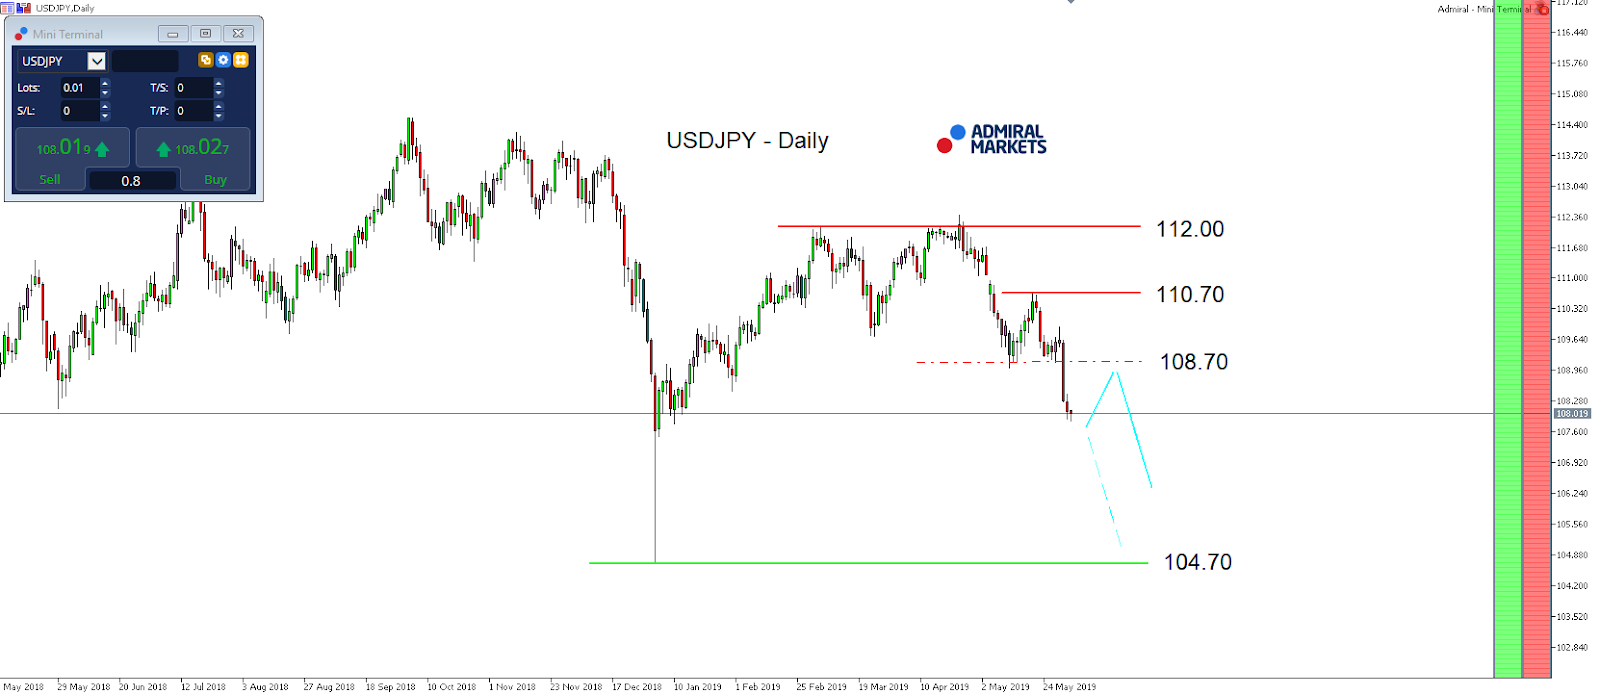
USD/JPY is trading in a flat. There is no single trend. Since the beginning of the month the key levels were 108.000 and 108.450. The demand for the safe assets remain high due to a high tension levels in the world trade. Keep an eye on the US Treasury bonds’ yeild. You should open positions from the key levels.

The Economic News Feed for 06.06.2019 is calm.

USD/JPY

The indicators do not provide precise signlas, the price has crossed 50 MA.

The MACD histogram is close to 0.

The Stochastic Oscillator is in the oversold zone, the %K line iscrossing the %D line. There are no signals.

Trading recommendations
  • Support levels: 108.000, 107.850, 107.500
  • Resistance levels: 108.450, 108.850, 109.200

If the price fixes above the round 108.000, expect further descend towards 107.600.

Alternatively, the quotes recover 108.800-109.000.

by JustForex

The Dollar Index Has Moved Away from Local Lows. Trade Tensions Are still High. We Expect the ECB Meeting

by JustForex

The US dollar is still under pressure against a basket of major currencies. Despite this, the US dollar index (#DX) closed yesterday in the positive zone (+0.26%). Positive statistics on economic activity in the non-manufacturing sector of the US supported the greenback. Meanwhile, the Japanese yen has strengthened against the increasing investor concerns about global trade disputes and the growing demand for safe-haven currencies. As it became known, negotiations between the US and Mexico were not progressive. “Immigration discussions at the White House with representatives of Mexico have ended for the day. Progress is being made, but not nearly enough … Talks with Mexico will resume tomorrow with the understanding that, if no agreement is reached, Tariffs at the 5% level will begin on Monday, with monthly increases as per schedule,” – wrote D. Trump on Twitter.

Yesterday, the Fed’s Beige Book was published, according to which the growth rate of economic activity was generally restrained from April to mid-May in the US. In the previous period, growth rates were assessed as weak. Uncertainty in world trade relations, as well as a lack of skilled staff are the main risks for the economy. Today, the financial market participants are focused on the ECB meeting. It is expected that the regulator will keep the key marks of monetary policy at the same level. We recommend paying attention to the speech by the head of the Central Bank, Mario Draghi.

The “black gold” prices recovered part of the losses after a sharp collapse the day before. At the moment, futures for the WTI crude oil are testing the mark of $52.00 per barrel.

Market Indicators

Yesterday, the aggressive purchases were observed in the US stock market: #SPY (+0.87%), #DIA (+0.82%), #QQQ (+0.74%).

The 10-year US government bonds yield is consolidating. Currently, the indicator is at the level of 2.11-2.12%.

The news feed on 2019.06.06:

– Eurozone GDP at 12:00 (GMT+3:00);
– ECB interest rate decision at 14:45 (GMT+3:00);
– Ivey PMI at 17:00 (GMT+3:00).

We also recommend paying attention to the speeches by the FOMC representatives.

by JustForex

EURUSD: bears gearing towards 1.12

By Alpari

Previous:

On Wednesday the 5th of June, the euro closed the day down against the US dollar. The bulls erased all their gains after having pushed the EURUSD pair up to 1.1306. The euro was sunk by the European Commission launching an infringement procedure against Italy over its level of public debt. EU Commissioner Pierre Moscovici, however, has said that the situation could change based on new data and certain assurances given from Italy. Additional pressure was exerted on the euro by US data.

Figures released in the US were ambiguous, which allowed the euro to rise above 1.13 before dropping. The ADP employment report showed 27k new jobs added in the private sector in May (forecast: 185k, previous reading: 271k). This was significantly lower than expected, but dollar bulls were lifted by services PMI data, which came out at 56.9 points (previous reading: 55.5).

The euro then dropped all the way to 1.1220.

Day’s news (GMT+3):

  • 12:00 Eurozone: GDP (Q1), unemployment change (Q1).
  • 14:45 Eurozone: ECB interest rate decision.
  • 15:30 Eurozone: ECB monetary policy statement and press conference.
  • 15:30 US: nonfarm productivity (Q1), unit labor costs (Q1), initial jobless claims (31 May).
  • 15:40 US: Fed’s Kaplan speech.
  • 17:00 Canada: Ivey PMI (May).
  • 20:00 US: Fed’s Williams speech.

Current situation:

Expectations of a test of 1.13 were met. At the time of writing, the euro is trading at 1.1228. There’s no chart in today’s review because there’s an interest rate decision coming from the ECB later in the day followed by a press conference with Mario Draghi. The bank is expected to announce a package of long-term loans to commercial banks at very low rates. A negative interest rate has not been ruled out.

The EURUSD pair is trading at the 67th degree. There’s a risk of sliding to 1.1200 ahead of today’s press conference. It’s difficult to say where the pair will close the day, because markets behave unpredictably when Draghi is speaking. If we look at the pricing model created over the last two days, we might consider buying from the 90th degree at 1.1200. Considering that the payrolls report comes out tomorrow, however, I think it better to wait on the sidelines until Monday.

By Alpari

Fear Drives Market Expectations

By TheTechnicalTraders.com

The continued upside price move in Gold is a very clear sign that fear is starting to enter the global markets again.  We read an article last night that suggested many professional fund managers are preparing for a bigger downside price move as well as expecting the US Fed to potentially decreased interest rates over the next 12 to 24 months as the expected downside price move takes place.  We understand this concern by many industry professionals and share some of their same concerns, yet we believe these individual are far too early in shifting their stance in the markets right now.

As you may be aware, our research does not show any major downside risks until later in July 2019 or August 2019.  Even then, the price of the Dow Jones Index would have to fall over 18% before the December 2018 lows become threatened.  The current upside price recovery, with the Dow Jones up over 400 pts from the lows on Monday, June 3, suggests the US market and the Capital Shift that has been taking place over the past 24+ months is still rather strong with investor buying dips. We told our followers this bounce was about to happen the day before it bottomed here.

It seems that everyone is trying to pick a top or call the big crash right now.  Back in November 2018, it seemed like every professional trader we knew was advising their client “This is the BIG ONE” and suggesting the US markets could never recover from a deep sell-off like the one we experienced in late 2018.  Yet, here we are, after reaching near all-time highs again, rotating a bit lower and the same voices seem to be stating “This is the BIG ONE” again.

Allow us to help clear up what is likely to happen based on our research and proprietary modeling tools.

This first chart of the VIX (Volatility Index) shows what we believe to be the most likely outcome over the next 30+ days.  After a spike in the VIX in early may which our followers profited over 25% in a few days, we believe a downward pricing channel will set up where the VIX will continue to drift lower – eventually settling back below 14 again for another setup.  It is very likely that this volatility consolidation coincides with a US stock market price recovery over the same span of time.  We’ll get into more detail in the following charts.

Eventually, sometime in mid-July or mid-August, we expect the VIX to spike well above 20 to 22 as a broader US stock market price collapse takes place.

Throughout our expectations, we expect the US Dollar to enter a similar type of price pattern – setting up a Pennant formation after a moderately deep price correction nearing the $95 level.  We believe the US Dollar will continue to move lower, driving precious metals higher, where the $95 support level is the key target.  Once this level is reached, we believe the US Dollar will rotate higher and attempt a move above $97.50 again – possibly attempting new price highs.  These new highs are likely to happen in early to mid July 2019.

Our last chart highlights what we believe will happen in the Dow Jones Index (as a general market example of what will likely happen in the ES, NQ and YM).  As you can see, we believe the downside price swing that has currently taken price nearly -7.25% lower should be very close to completion.  We believe the $24,300 to $24,600 level will act as strong support for this move and prompt another upside price leg over the next 7 to 14 days.  We believe this upside price leg will push the DJI price level back towards the $26,000 level by late July or early August 2019.

We are suggesting that the early move into a protectionist stance by professional traders may be about to experience some extreme pressures.  Should the US/China trade issue or the Mexico trade issue lessen or be resolved over the next 60+ days, the US stock markets could rally towards new highs fairly quickly.  If things stay the same as they are now, we expect price to move exactly as we have highlighted on these charts.

Near the end of July or sometime in August 2019, we expect a bigger top formation to setup where a moderate price collapse may take place.  Everything must setup perfectly for this to happen and we still have 40 to 60+ days of trading before this setup gets closer.  Lots of things can happen over this span of time, so pay attention to our continued research to stay ahead of these moves.

One thing you can do to prepare for any future price volatility or rotation is to accumulate Gold and Silver positions near recent lows. If you like precious metals see my forecasting signals here  This increase in volatility means that precious metals should continue to push higher as fear becomes more rooted across the globe.

We’ve now shown you two different price setups using Fibonacci price theory and the only thing we have to do is wait for a technical price confirmation before finding our entry trade.  We’ll see how this plays out over the next few days and weeks.  Remember, we are not proposing these as “major price bottoms”. They are “upside pullback trades” (bounces) at this point.  A bullish price pullback in a downtrend.

BECOME A TECHNICAL TRADER TODAY AND 
TRADE WHAT MATTERS – PRICE ACTION! 
CLICK HERE

Chris Vermeulen


Forex Technical Analysis & Forecast 05.06.2019 (EURUSD, GBPUSD, USDCHF, USDJPY, AUDUSD, USDRUB, GOLD, BRENT)

Article By RoboForex.com

EURUSD, “Euro vs US Dollar”

EURUSD is consolidating around 1.1246. Today, the pair may form one more ascending structure to reach 1.1268 and then start another decline towards 1.1230. Later, the market may return to 1.1246 and test it from below. If the price breaks this range to the downside, the instrument may resume trading downwards with the target at 1.1212.

EURUSD_Технический анализ
Risk Warning: the result of previous trading operations do not guarantee the same results in the future

GBPUSD, “Great Britain Pound vs US Dollar”

GBPUSD has reached the upside target; right now, it is consolidating at the top. Possibly, the pair may expand the range up to 1.2727 and then start another decline with the target at 1.2633.

GBPUSD_Технический анализ
Risk Warning: the result of previous trading operations do not guarantee the same results in the future

USDCHF, “US Dollar vs Swiss Franc”

USDCHF is consolidating near the lows. Possibly, today the pair may break the range upwards and start a new correction to reach 0.9999. After that, the instrument may resume falling with the target at 0.9955.

USDCHF_Технический анализ
Risk Warning: the result of previous trading operations do not guarantee the same results in the future

USDJPY, “US Dollar vs Japanese Yen”

USDJPY is still consolidating near the lows. Possibly, the pair may form a new descending structure to expand the range down to 107.63. Later, the market may be corrected with the target at 109.25.

USDJPY_Технический анализ
Risk Warning: the result of previous trading operations do not guarantee the same results in the future

AUDUSD, “Australian Dollar vs US Dollar”

AUDUSD has been supported by 0.6955; right now, it is still trading upwards. Possibly, the pair may reach 0.7020. After that, the instrument may start another correction with the target at 0.6940.

AUDUSD_Технический анализ
Risk Warning: the result of previous trading operations do not guarantee the same results in the future

USDRUB, “US Dollar vs Russian Ruble”

USDRUB is still consolidating around 65.20. Possibly, the pair may form a new descending structure towards 64.93. If later the price breaks the range to the upside, the instrument may extend the wave with the target at 66.06; it to the downside – resume trading inside the downtrend towards 64.14.

USDRUB_Технический анализ
Risk Warning: the result of previous trading operations do not guarantee the same results in the future

XAUUSD, “Gold vs US Dollar”

Gold is still consolidating around 1324.00. If later the price breaks the range to the upside, the instrument may resume growing with the target at 1333.00; it to the downside – start a new correction towards 1310.00.

GOLD_Технический анализ
Risk Warning: the result of previous trading operations do not guarantee the same results in the future

BRENT

Brent is still consolidating around 62.22. Possibly, the pair may break 63.40 and then start a new growth with the target at 65.65. After that, the instrument may fall to return to 63.40, thus forming a reversal pattern. However, if the price breaks 65.65 upwards, the instrument may form one more ascending structure with the target at 70.00.

BRENT_Технический анализ
Risk Warning: the result of previous trading operations do not guarantee the same results in the future

Article By RoboForex.com

Attention!
Forecasts presented in this section only reflect the author’s private opinion and should not be considered as guidance for trading. RoboForex LP bears no responsibility for trading results based on trading recommendations described in these analytical reviews.

Fibonacci Retracements Analysis 05.06.2019 (GBPUSD, EURJPY)

Article By RoboForex.com

GBPUSD, “Great Britain Pound vs US Dollar”

As we can see in the H4 chart, after the price had reached the retracement of 76.0%, there was a convergence on MACD, which made the pair start a new short-term correction within the downtrend. By now, the correction has already reached the retracement of 23.6%. In case it continues, the price may reach the retracements of 38.2% and 50.0% at 1.2795 and 1.2867 respectively. The support is the local low at 1.2558.

GBPUSD_H4_Анализ по Фибоначчи
Risk Warning: the result of previous trading operations do not guarantee the same results in the future

The H1 chart shows a stable correctional uptrend towards the retracement of 38.2% at 1.2795.

GBPUSD_H1_Анализ по Фибоначчи
Risk Warning: the result of previous trading operations do not guarantee the same results in the future

EURJPY, “Euro vs. Japanese Yen”

As we can see in the H4 chart, EURJPY is trading downwards and, after breaking the retracement of 61.8%, hasn’t been able to reach 120.25. At the same time, there is a convergence on MACD, which may indicate a new pullback. The resistance level is the retracement of 38.2% at 123.84. After finishing the pullback, the instrument may form a new descending structure to reach the retracement of 76.0% at 120.25 and then the low at 117.96

EURJPY_H4_Анализ по Фибоначчи
Risk Warning: the result of previous trading operations do not guarantee the same results in the future

In the H1 chart, the pair is forming a short-term correction to the upside. Right now, the price is getting closer to the retracement of 38.2% at 121.91. After that, the instrument may reach the retracement of 50.0% at 122.26. The support is the low at 120.78.

EURJPY_H1_Анализ по Фибоначчи

Article By RoboForex.com

Attention!
Forecasts presented in this section only reflect the author’s private opinion and should not be considered as guidance for trading. RoboForex LP bears no responsibility for trading results based on trading recommendations described in these analytical reviews.

The Analytical Overview of the Main Currency Pairs on 2019.06.05

by JustForex

The EUR/USD currency pair

Technical indicators of the currency pair:
  • Prev Open: 1.12407
  • Open: 1.12514
  • % chg. over the last day: +0.12
  • Day’s range: 1.12506 – 1.12656
  • 52 wk range: 1.1111 – 1.2009

USD stabilized around the 7-month minumums against the basket of the world currencies. It is under pressure due to growing prospects that the Federal Reserve will lower the key interest rates this year. The Central Bank representatives are worried about the low inflation as well as a trade conflicts escalating in the world economy. According to the CME Firewatch Tool, 55% of the financial markets expect the Federal reserve to lower the key interest range on the meeting on Jule 31. The quotes are currently moving sideways, the key range being 1.12300-1.12700. The trading instrument can grow further. You should open positions from the key levels.

The Economic News Feed for 05.06.2019:

  • – An array of reports on the economic activity (EU) – 11:00 (GMT+3:00);
  • – Retail Sales Volume (EU) – 12:00 (GMT+3:00);
  • – ADP Nonfarm Employment Change (US) – 15:15 (GMT+3:00);
  • – ISM Non-Manufacturing Business Activity (US) – 17:00 (GMT+3:00);
  • – Beige Book (US) – 21:00 (GMT+3:00);
EUR/USD

The price fixed above 50 MA and 200 MA which points to the power of the buyers.

The MACD histogram is in the positive zone but below the signal line which gives a weak signal to buy EUR/USD.

The Stochastic Oscillator is in the neutral zone, the %K line is crossing the %D line. There are no signals at the moment.

Trading recommendations
  • Support levels: 1.12300, 1.12150, 1.11900
  • Resistance levels: 1.12700, 1.13000

If the price fixes above 1.12700, expect further growth towards 1.13000-1.13200.

Alternatively, the quotes can fall towards 1.12000.

The GBP/USD currency pair

Technical indicators of the currency pair:
  • Prev Open: 1.26639
  • Open: 1.26988
  • % chg. over the last day: +0.30
  • Day’s range: 1.26965 – 1.27193
  • 52 wk range: 1.2438 – 1.3631

GBP/USD is in a bullish mood. GBP set the new local maximums. The demand for the USD fell due to the growing threats of the Federal Reserve to decrease the key rates soon. Right now the quotes are testing the 1.27200. 1.26850 acts as a mirror resistance. The trading instrument can recover further. You should open positions from the key levels.

At 11:30 (GMT+3:00) the UK will publish a business activity index in the Service industry.

GBP/USD

The price fixed above 50 MA and 200 MA which points to the power of the buyers.

The MACD histogram is in the positive zone and keeps rising which gives a strong signal to buy GBP/USD.

The Stochastic Oscillator is in the neutral zone, the %K line is above the %D line which also points to the bullish mood.

Trading recommendations
  • Support levels: 1.26850, 1.26400, 1.26100
  • Resistance levels: 1.27200, 1.27450

If the price fixes above the 1.27200 resistance level, expect further growth towards 1.27450-1.27700.

Alternatively, the quotes can fall towards 1.26500-1.26400.

The USD/CAD currency pair

Technical indicators of the currency pair:
  • Prev Open: 1.34403
  • Open: 1.33923
  • % chg. over the last day: -0.34
  • Day’s range: 1.33739 – 1.33970
  • 52 wk range: 1.2727 – 1.3664

USD/CAD showcases agressive sales. During the last two days the quotes fell by 60 points. CAD reached the key minimums. Right now the local support and resistnance are 1.33750 and 1.34000. The demand for USD lowered. The trading instrument has prospects for a further descend. Keep an eye on the US economic releases and open positions from the key levels.

The Economic News Feed for 05.06.2019 is calm.

USD/CAD

The indicators point to the power of the sellers, the price fixed below 50 MA and 200 MA.

The MACD histogram is in the negative zone and keeps falling which gives a strong signal to sell USD/CAD.

The Stochastic Oscillator is in the neutral zone, the %K line is crossing the %D line. There are no signals at the moment.

Trading recommendations
  • Support levels: 1.33750, 1.33500
  • Resistance levels: 1.34000, 1.34300, 1.34600

If the price fixes below 1.33750, expect further descend towards 1.33500-1.33300.

Alternatively, the quotes can recover towards 1.34300-1.34500.

The USD/JPY currency pair

Technical indicators of the currency pair:
  • Prev Open: 108.054
  • Open: 108.136
  • % chg. over the last day: +0.16
  • Day’s range: 107.971 – 108.271
  • 52 wk range: 104.97 – 114.56

USD/JPY stabilized after a significant fall since the beginning of May. There is no defined trend. The key support and resistance levels are 107.850 and 108.350. JPY has a tendency to grow against the USD. The demand on the safe assets remains high. The investors are watching the key reports from the US. You should open positions from the key levels.

The Economic News Feed for 05.06.2019 is calm.

USD/JPY

The indicators do not provide precise signals, the price has crossed 50 MA.

The MACD histogram is close to 0.

The Stochastic Oscillator is in the neutral zone, the %K line is crossing the %D line. There are no signals at the moment.

Trading recommendations
  • Support levels: 107.850, 107.500
  • Resistance levels: 108.350, 108.850, 109.200

If the price fixes below 107.850, expect further descend towards 107.500-107.300.

Alternatively, the quotes can recover towards 108.600-108.800.

by JustForex

The US Dollar Is Still Under Pressure

by JustForex

The US dollar has reached three-week lows against the basket of major currencies. The dollar index (#DX) closed in the negative zone (-0.06%). Yesterday, Fed Chairman Jerome Powell said that the regulator closely followed the US trade disputes with other countries, and was ready to take appropriate measures to stimulate economic growth in order to maintain a strong labor market and inflation around a target of 2%. Investors took his speech as a signal that the Fed was ready to consider an issue of lowering interest rates, if necessary.

Yesterday, weak economic reports were published in the UK and the Eurozone. Thus, the UK construction PMI fell to 48.6 in May, while experts expected 50.5. Eurozone inflation slowed down to 1.2% in May, although experts forecasted an increase by 1.3%. Today, during the Asian trading session weak data on Australian GDP have been published: the figure has risen in the first quarter only by 0.4% instead of the expected growth by 0.5%.

The “black gold” prices are consolidating. At the moment, futures for the WTI crude oil are testing $52.95 per barrel. At 17:30 (GMT+3:00), a report on the US crude oil inventories will be published.

Market Indicators

Yesterday, aggressive purchases were observed in the US stock market: #SPY (+ 2.17%), #DIA (+ 2.07%), #QQQ (+ 2.82%).

The 10-year US government bonds yield is recovering. At the moment, the indicator is at the level of 2.12-2.13%.

The news feed on 2019.06.05:

– UK services PMI at 11:30 (GMT+3:00);
– ADP nonfarm employment change at 15:15 (GMT+3:00);
– ISM non-manufacturing PMI in the US at 17:00 (GMT+3:00);
– Fed’s Beige Book at 21:00 (GMT+3:00).

by JustForex

EURUSD: pair trading between the 112th and 135th Gann levels

By Alpari

Previous:

On Monday the 3rd of June, the euro gained a hundred pips against the dollar to reach 1.1262. The US trade saga took its toll on global markets. Due to the ongoing economic slowdown, traders and investors are expecting interest rates to be slashed by the US Fed before the year is out.

The greenback came under pressure from the ISM index, which showed a decline in manufacturing activity despite expectations of a rise. The ISM manufacturing index came out at 52.1 points.

Pressure on the dollar further increased following remarks from FOMC member James Bullard, who said that a rate slash may be appropriate sooner rather than later given current trade and inflation risks. Federal Reserve vice chair Richard Clarida also talked about slashing the key rate on Friday.

Day’s news (GMT+3):

  • 12:00 Eurozone: CPI (May), unemployment rate (Apr).
  • 12:30 Australia: RBA’s Governor Lowe speech.
  • 16:45 US: Fed’s Chair Powell speech.
  • 17:00 US: factory orders (Apr).

EURUSD H1Current situation:

Expectations that the Federal Reserve will lower rates by the end of the year have had a negative influence on the dollar. Rather than retreating to the safe havens, traders have been closing their long positions on the dollar. According to the latest data from CME FedWatch, the probability of interest rates being slashed in October is 94.3% and 97% in December.

At the time of writing, the euro is trading at 1.1261. The EURUSD pair is trading between the 112th and 135th degrees. This is a reversal zone, so from here or 1.1275 I expect to see a correction. While the dollar is trading down against the majors, don’t be in a hurry to short the euro against the session trend. There’s a risk of retreating to the U3 line. To sell we need to see a reversal candlestick formation (pin bar, or bearish engulfing).

By Alpari


Will the USD/JPY test 105.00 this week?

By Admiral Markets

Source: Economic Events 05 June 2019 – Admiral Markets’ Forex Calendar

Going hand in hand with the sharp drop in US Treasury yields, which now price in a more than 95% chance of the US central bank FED cutting interest rates at least once by December 2019, the USDJPY followed and dropped below the crucial support region around 108.70.

The drop lower continued into the start of the week with the ISM Manufacturing following the US Services sector’s collapse (and Canada and China’s plunge), printing at a disappointing 52.1 (53.0 expected) and being its weakest since October 2016 (despite a rise in new export orders and employment).

Three of five ISM components declined, including production, inventories and supplier deliveries, and stagflation looms as prices paid rose.

In addition, the headline PMI fell to its lowest level since September 2009 as output growth eased (with output expectations crashing to the joint-lowest since records began) and new orders fell for the first time since August 2009.

What’s especially noteworthy: the lowest ISM index reading during Trump’s presidency was already on shakier ground even before the latest escalation of tariffs between the US and China, which definitely have the potential to pinch margins.

While the USD/JPY didn’t aggressively accelerate on the downside (which indicates that most of the disappointing print was already priced in), the overall mode stays bearish.

If today’s ISM Non-Manufacturing data set disappoints (in our opinion any reading below 55) too, recession fears loom again and USDJPY drops below 107.50, a stint towards 105.00, the flash crash lows from January, could be seen already in the second half of the week.

But even if we get to see a solid print, the current device seems to be ‘Sell the bounce’, especially if a bounce towards 109.00/20 occurs.

The mode stays bearish on a daily time-frame as long as we trade below 110.70.

Source: Admiral Markets MT5 with MT5SE Add-on USDJPY Daily chart (between 07 March 2018 to 04 June 2019). Accessed: 04 June 2019 at 10:00 PM GMT

Please note: Past performance is not a reliable indicator of future results, or future performance.

In 2014, the value of USDJPY increased by 13.7%, in 2015, it increased by 0.5%, in 2016 it fell by 2.8%, in 2017 it fell by 3.6%, in 2018 it fell by 2.7%, meaning that after five years, it was up by 4.1%.

Trade with MetaTrader Supreme Edition

Admiral Markets offers professional traders the ability to significantly enhance their trading experience by boosting the MetaTrader platform with MetaTrader Supreme Edition. Gain access to excellent additional features such as the correlation matrix – which enables you to compare and contrast various currency pairs, together with other fantastic tools, like the Mini Trader window, which allows you to trade in a smaller window while you continue with your day to day things. Get all of this and much more by clicking the banner below and starting your FREE download!

Download MetaTrader 5 Supreme Edition

Disclaimer: The given data provides additional information regarding all analysis, estimates, prognosis, forecasts or other similar assessments or information (hereinafter “Analysis”) published on the website of Admiral Markets. Before making any investment decisions please pay close attention to the following:

  1. This is a marketing communication. The analysis is published for informative purposes only and are in no way to be construed as investment advice or recommendation. It has not been prepared in accordance with legal requirements designed to promote the independence of investment research, and that it is not subject to any prohibition on dealing ahead of the dissemination of investment research.
  2. Any investment decision is made by each client alone whereas Admiral Markets shall not be responsible for any loss or damage arising from any such decision, whether or not based on the Analysis.
  3. Each of the Analysis is prepared by an independent analyst (Jens Klatt, Professional Trader and Analyst, hereinafter “Author”) based on the Author’s personal estimations.
  4. To ensure that the interests of the clients would be protected and objectivity of the Analysis would not be damaged Admiral Markets has established relevant internal procedures for prevention and management of conflicts of interest.
  5. Whilst every reasonable effort is taken to ensure that all sources of the Analysis are reliable and that all information is presented, as much as possible, in an understandable, timely, precise and complete manner, Admiral Markets does not guarantee the accuracy or completeness of any information contained within the Analysis. The presented figures refer that refer to any past performance is not a reliable indicator of future results.
  6. The contents of the Analysis should not be construed as an express or implied promise, guarantee or implication by Admiral Markets that the client shall profit from the strategies therein or that losses in connection therewith may or shall be limited.
  7. Any kind of previous or modeled performance of financial instruments indicated within the Publication should not be construed as an express or implied promise, guarantee or implication by Admiral Markets for any future performance. The value of the financial instrument may both increase and decrease and the preservation of the asset value is not guaranteed.
  8. The projections included in the Analysis may be subject to additional fees, taxes or other charges, depending on the subject of the Publication. The price list applicable to the services provided by Admiral Markets is publicly available from the website of Admiral Markets.
  9. Leveraged products (including contracts for difference) are speculative in nature and may result in losses or profit. Before you start trading, you should make sure that you understand all the risks.