The material refocusing of all markets, not just FX, on Constitution Avenue has been astonishing to see.
The rising risk of recession, global slowdowns and geopolitical fall outs have seen the US ‘recession marker’ in the 3mT bill-US10yr differential flashing red.
Since 1900 when this differential inverts, it has forecasted a US recession in the preceding 18-24 months over 95% of the time. Now I should point out that the US currently has some of the best employment figures since the 60’s and its overall ‘wealth’ metrics are booming.
But, you can’t ignore the ‘sign’.
What this all means is the Fed is (amazingly) ‘in play’ and markets are telling us so.
Pricing clearly shows that in the coming 12 months the market now expects the Federal Reserve to cut the Federal Funds rate at least twice, with a full 25 basis points now expected to come out by no later than September.
What is so interesting about these developments is that although bond markets are pricing a dovish Fed, the USD has not.
Thus, there are 2 scenarios to watch for that should start to weigh on the USD:
First would be the increasing volume of Fed speakers coming out in favour of discussing rate cuts (they don’t necessarily need to act, jawboning will be enough).
Second would be explicit guidance and/or thresholds that would lead to a rate cut. I would suggest keeping a sharp eye on Vice Chair Richard Clarida.
The Fed enters the ‘blackout’ period this week head of next week’s FOMC meeting so these points will have to wait. But, June is a press conference meeting and Chair Powell will thus update the Board’s forecasts in the Summary of Economic Projections so the first chance to review the above scenarios will come from the most senior member of the board.
The FOMOC meeting will also see the Fed releasing its latest dot plots here are the March projections.
If the FOMC projections follow the Fed fund futures (purple line) and suggest that the Fed’s base case is for rate cuts in 2019, this, coupled with Powell’s press conference will trigger USD weakness not seen in months. Pairs will shoot around so be prepared.
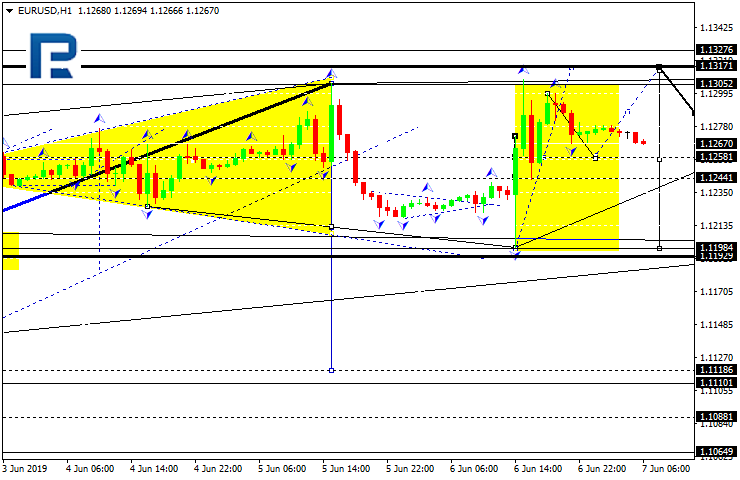
EURUSD has reached 1.1200; right now, it is forming the fifth ascending structure with the target at 1.1317. Possibly, today the pair may fall towards 1.1258 and then resume growing to reach the above-mentioned target. After that, the instrument may form a new descending structure to return to 1.1200.
GBPUSD, “Great Britain Pound vs US Dollar”
GBPUSD is still consolidating around 1.2690. If later the price breaks the range to the downside, the instrument may start another decline to break 1.2644 and then continue trading inside the downtrend with the target at 1.2450.
USDCHF, “US Dollar vs Swiss Franc”
USDCHF is trading upwards. Today, the pair may reach 0.9947. Later, the market may break this level and then continue growing with the short-term target at 1.0016.
USDJPY, “US Dollar vs Japanese Yen”
USDJPY is moving upwards. Possibly, the pair may reach 108.56 and then form a new descending structure towards 108.17. After that, the instrument may start another growth with the target at 109.25.
AUDUSD, “Australian Dollar vs US Dollar”
AUDUSD is moving downwards. Today, the pair may reach 0.6953 and then grow towards 0.6973. If later the price breaks the range to the downside, the instrument may resume trading inside the downtrend with the short-term target at 0.6900.
USDRUB, “US Dollar vs Russian Ruble”
USDRUB is consolidating around 65.10. If later the price breaks the range to the upside, the instrument may continue the correction towards 66.06; if to the downside – resume trading inside the downtrend with the short-term target at 62.77.
XAUUSD, “Gold vs US Dollar”
Gold is still consolidating around 1332.50. According to the main scenario, the pair may break the range downwards and resume falling with the short-term target at 1312.50.
BRENT
Brent is still moving upwards with the first target at 63.53. Later, the market may start a new decline to reach 61.90 and then form one more ascending structure with the short-term target at 65.55.
Attention! Forecasts presented in this section only reflect the author’s private opinion and should not be considered as guidance for trading. RoboForex LP bears no responsibility for trading results based on trading recommendations described in these analytical reviews.
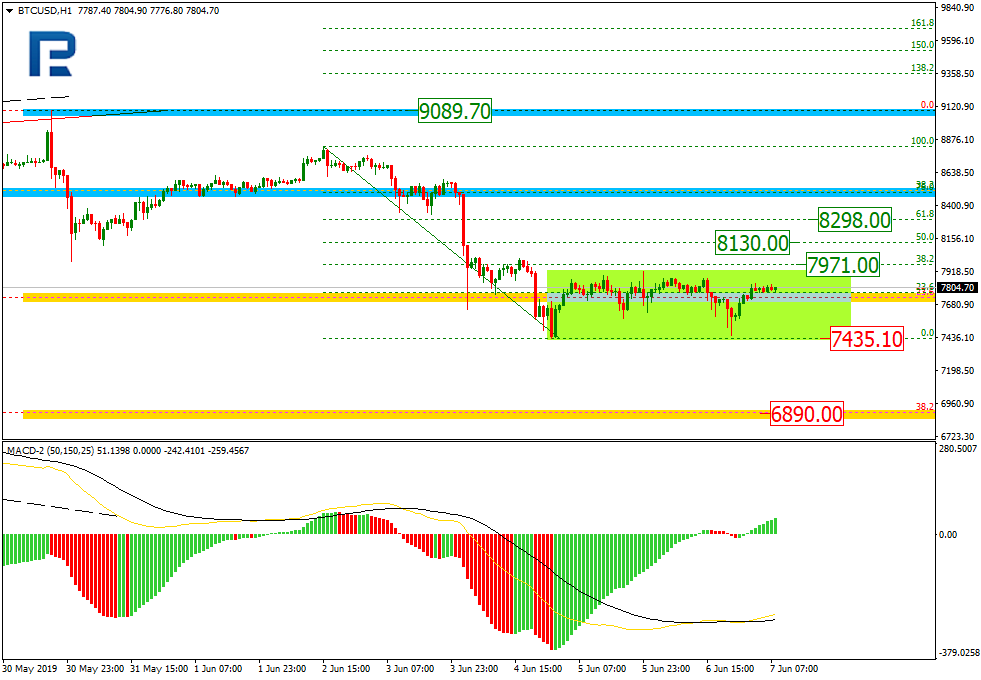
In the H4 chart, after the price had reach the retracement of 38.2%, there was a divergence on MACD, which may the pair start a new decline. By now, the descending correction has already reached the retracement of 23.6%. The next downside targets may be the retracements of 38.2%, 50.0%, and 61.8% 6890.00, 6220.00, and 5534.00 respectively. After completing the pullback, BTCUSD may start a new rising wave to reach the high at 9089.70.
In the H1 chart. BTCUSD is testing the retracement of 23.6%; the pair is trading sideways and this movement may be considered as a short-term ascending correction. The upside targets may be the retracement of 38.2%, 50.0%, and 61.8% at 7971.00, 8130.00, and 8298.00 respectively. If the price breaks the low at 7435.10, it may start a new descending wave.
ETHUSD, “Ethereum vs. US Dollar”
As we can see in the H4 chart, after reaching the retracement of 23.6%, ETHUSD slowed down the correctional downtrend. However, the next downside targets may be the retracements of 38.2%, 50.0%, and 61.8% at 216.90, 194.60, and 172.30 respectively. The resistance is the high at 288.82.
The H1 chart shows a short-term pullback after the pair finished the descending wave. By now, it has already reached retracement of 38.2%. The next targets may be the retracements of 50.0% and 61.8% at 253.80 and 258.70 respectively. If the instrument breaks the support at 233.10, it may continue its mid-term downtrend.
Attention! Forecasts presented in this section only reflect the author’s private opinion and should not be considered as guidance for trading. RoboForex LP bears no responsibility for trading results based on trading recommendations described in these analytical reviews.
EUR/USD shows high trading activity and volatility. The Central Bank of Europe, as expected, kept the monetary policy on the same levels. The regulator increased the forecasted value of the EU GDP growth from 1.1% to 1.2% this year. The Central Bank left out the increase in the key interest rates until the end of the first half of 2020. Mario Draghi earlier mentioned that some of the CBE representatives are ready to review the restoration of the quantitative easing program should the conditions become unfavourable. The local support and resistance levels are 1.12500 and 1.12750. The investors are waiting for the May US labour market report. Keep an eye on the difference between the real and the forecasted values and open positions from the key levels.
At 15:30 the US will publish a labour market report.
The price fixed above 50 MA and 200 MA which points to the power of the buyers.
The MACD histogram is in the positive zone but below the signal line which points towards buying EUR/USD.
The Stochastic Oscillator is in the oversold zone, the %K line. There are no signals at the moment.
Trading recommendations
Support levels: 1.12500, 1.12200, 1.11900
Resistance levels: 1.12750, 1.13000
If the price fixes above 1.12750, expect the growth towards 1.13250-1.13500.
Alternatively, the quotes can descend towards 1.12000-1.11800.
The GBP/USD currency pair
Technical indicators of the currency pair:
Prev Open: 1.26988
Open: 1.26834
% chg. over the last day: -0.08
Day’s range: 1.26741 – 1.26939
52 wk range: 1.2438 – 1.3631
GBP/USD stabilized after a long growth since the beginning of May. The quotes are moving sideways. The investors are waiting for additional drivers. The support and resistance levels are 1.26750 and 1.27100. The market pariticpants are waiting for the US labour market report. Open positions from the key levels.
The Economic News Feed for 07.06.2019 is calm.
The indicators do not provide precise signals, the price crossed 50 MA.
The MACD histogram is close to 0
The Stochastic Oscillator is in the neutral zone, the %K line is above the %D line which points to a bullish mood
Trading recommendations
Support levels: 1.26750, 1.26400, 1.26100
Resistance levels: 1.27100, 1.27450
If the price fixes above 1.27100, expect further growth towards 1.27500-1.27700.
Alternatively, the quotes can descend towards 1.26400-1.26200.
The USD/CAD currency pair
Technical indicators of the currency pair:
Prev Open: 1.34145
Open: 1.33617
% chg. over the last day: -0.45
Day’s range: 1.33459 – 1.33668
52 wk range: 1.2727 – 1.3664
USD/CAD started to descend again. The trading instrument updated the two-month minimums. The price on oil recovered, which gave a boost to CAD. Right now the quotes are near the local support of 1.33450 with 1.33750 acting as a nearest resistance. The quotes can descend further. Keep an eye on the US and Canada labour market reports and open positions from the key levels.
At 15:30 (GMT+3:00) Canada will puiblish a labour market report.
The price fixed below 50 MA and 200 MA which point to the power of the buyers.
The MACD histogram is in the negative zone which points to the bearish mood.
The Stochastic Oscillator is in the neutral zone, the %K line is above the %D line which gives a signal to sell USD/CAD.
Trading recommendations
Support levels: 1.33450, 1.33000
Resistance levels: 1.33750, 1.34000, 1.34300
If the price fixes below 1.33450, expect further descend towards 1.33000.
Alternatively, the quotes can grow towards 1.34000-1.34300.
The USD/JPY currency pair
Technical indicators of the currency pair:
Prev Open: 108.464
Open: 108.399
% chg. over the last day: -0.03
Day’s range: 108.320 – 108.535
52 wk range: 104.97 – 114.56
The USD/JPY quotes are moving sideways, the technical picture is ambiguous. The market participants are waiting for the US labour market report. The quotes are consolidating around 108.200-108.550. The demand on the safe assets remains high. Keep an eye on the US Treasury bonds’ yield and open positions from the key levels.
During the Asian trading session, Japan published weak household expenditure data.
The indicators do not provide precise signals, the price fixed between 50 and 200 MA.
The MACD histogram is in the positive zone, which points to a bullish mood.
The Stochastic Oscillator is in the neutral zone, the %K line is below the %D line which gives a signal to sell USD/JPY.
Trading recommendations
Support levels: 108.200, 107.850, 107.500
Resistance levels: 108.550, 108.850, 109.200
If the price fixes below 108.200, the quotes can descend towards 107.850-107.500.
Alternatively, the quotes can recover towards 109.000-109.200.
The US dollar is declining against a basket of major currencies. The US dollar index closed in the negative zone (-0.26%). Financial market participants follow events concerning the US trade negotiations with China and Mexico. US President Donald Trump threatened China to introduce new duties on goods worth “at least” $300 billion. Also, investors have taken a wait-and-see attitude towards the US labor market report for May, which will be published today at 15:30 (GMT+3:00). These statistics may affect the views of the Fed regarding further monetary policy. We recommend paying attention to the difference between the actual and forecasted values.
Yesterday, the ECB, as expected, kept the key marks of monetary policy at the same level. During the press conference after the meeting, the ECB President Mario Draghi said that the regulator improved the forecasts for economic growth and consumer prices in the Eurozone for 2019. The leadership of the Central Bank expects Eurozone GDP to grow by 1.2% this year, rather than 1.1%, as was previously expected. The inflation forecast was raised to 1.3% from 1.2% in March. Some ECB officials are ready to consider resuming a quantitative easing program in case of adverse conditions.
The “black gold” prices are rising. At the moment, futures for the WTI crude oil are testing a mark of $53.35 per barrel.
Market Indicators
Yesterday, aggressive purchases were observed in the US stock market: #SPY (+0.65%), #DIA (+0.78%), #QQQ (+0.79%).
The 10-year US government bonds yield is consolidating. Currently, the indicator is at the level of 2.11-2.12%.
The news feed on 2019.06.07:
At 15:30 (GMT+3:00) reports on the labor market will be published in the US and Canada.
We asked our researchers a question recently, “Could Gold rally above $3750 before the end of 2019?”. We wanted to see what type of research they would bring to the table that could support a move like this of nearly 200% from current levels. We wanted to hear what they thought it would take for a move like this to happen and if they could support their conclusions with factual conjecture.
Now we ask you to review these findings and ask yourself the same question. What would it take for Gold to rally above $3750 (over 200% from current levels) and why do you believe it is possible?
Our research team came to two primary conclusions in support of a Gold price move above $3750 :
A) The US Presidential election cycle/political environment could prompt a vicious global economic contraction cycle of fear and protectionist consumer and corporate activity that propels the global economy into a deflationary (mini-crisis) event.
B) The global trade wars could complicated item A (the US Presidential election cycle) and create an accelerating component to this global political event. The result is the mini-crisis could turn into “ a bit more” than a mini-crisis if the global trade wars prompt further economic contraction and disrupt global economic activities further.
Our research team suggested the following as key elements to watch out for in terms of “setting up the perfect storm” in the global markets.
A) The US Dollar falls below $94 and continues to push a bit lower. This would show signs that the US Dollar is losing strength around the world
B) The Transportation Index falls below $4350 and begins a bigger breakdown in price trend – targeting the $3000 level. This would indicate that global trade and transportation is collapsing back to 2007-08 levels.
C) Oil collapses below $45 would be a certain sign that global Oil demand has completely collapsed and the sub-$40 level would very quickly come into perspective as a target.
D) Global Financial stability is threatened by Debt/Credit issues while any of the above are taking place. Should any of the A, B or C items begin to take form over the next few weeks or months while some type of extended debt or credit crisis event is unfolding, it would add a tremendous increase of fear into the metals markets.
Our researchers believe the US Dollar is safe above the $91 level throughout the end of 2019 and that any downside risk to the US Dollar would come in brief price rotations as deflationary aspects of the global economy are identified. In other words, at this time, we don’t believe the US Dollar will come under any severe downside pricing pressures throughout the end of 2019. We do believe a downside price move in the US Dollar may be setting up between now and early July 2019, but we strongly believe the $91 to $93 level is strong support for the long term.
The Gold Spot price / the US Dollar price chart highlights the incredible upside price move in Gold after 2001-02. It was almost a perfect storm of events that took place after this time to prompt a move like this to the upside. Not only did we have multiple US based economic crisis events, we also had a series of global economic “shifts” taking place where capital and assets were migrating all across the globe searching for superior returns. Could this happen again?? Of course it could. Although, we believe the next move in precious metals will be met with a completely different set of circumstances – very likely targeting foreign nations and not the US economy.
This SPDR GLD chart shows a moderately safer play for investors and traders. The potential for a 20%+ upside price move over the next 60+ days is quite likely and our belief is that traders should be able to trade GLD throughout many of the upside and downside price rotations over the next few weeks and months. Ultimately, if you are skilled enough to pick proper entries, a decent trader could focus on GLD and pick up 65% to 120% ROI over a 7 to 12 month span of time.
Pay attention to where the opportunities are for your level of skill and capital. As we’ve been saying for many months, 2019 and 2020 will be fantastic years for active traders. Stick with what you can execute and trade well because there will be dozens of trades available to most traders over the next 16+ months.
Overall, our research team believes that precious metals have just begun to move higher on a WAVE C impulse move. We authored a research post suggesting that Gold and Silver were currently 20 to 30% undervalued back in late May 2019. The current upside move in Gold and Silver may be just the beginning of a much bigger move.
Ideally, we believe this initial impulse move will end above $1650. From these current levels, that reflects a 25% to 30% upside move in GLD. If any of the fear-inducing items, listed above, begin to take shape over the next 12+ months, we could certainly see Gold above $2100 before too long. $3750 may seem like “shooting for the stars”, but all it takes is a combination of fear and deflation/inflation to drive investors into a gold-hoarding mode just like we saw after 2003-2004 – and that move prompted a 500% price rally from the $300 base level. That same move today would put the current price of Gold near $7800. It might seem like it could never happen – but it could.
Bottom line, we forecast the markets and share some extreme analysis like this to open your eyes to some potential opportunities. But, you cannot just jump into gold or miners after reading this and think you are set for success. The markets are never that simple. You must actively adjust and trade with the market and our daily video analysis is what will keep you on the right side of the market more times than not. This week, we locked in some profits on our long gold ETF, and gold miners ETF, why? because our analysis says both of these are at resistance and could pullback before heading higher. We don’t buy, hope and hold, we enter positions, lock-in profits, rinse, and repeat over and over again.
Get my daily video analysis and trade alerts today by subscribing to the Wealth Building Newsletter.
In our technical piece for Gold last Monday, we pointed out that, by “[…] reconquering 1,310 USD into the start of the week, further gains up to 1,325 USD are to be expected. Still, we only see this level as a potential stop-over up to the current yearly highs of around 1,347 USD.[…]”
And in fact, the precious metal went to 1,325 USD on Monday, with further gains up to 1,337 USD and trading in striking distance of the current yearly highs around 1,347 USD.
Those, who didn’t trade the direct break above 1,310 are currently waiting for a pullback to happen where today’s NFPs are a potential trigger event.
After the latest economic releases with the ISM Manufacturing and ADP data sets coming in below expectations, and FED chairman Powell opening the door for a potential rate cut on Tuesday, any positive NFP reading today (NFPs > 200k and Average Hourly Earnings (MoM) ≥ 0.3%) leaves Gold vulnerable to a short-term correction.
Even though we do not necessarily see Gold dropping over 1% on a solid NFP reading, a re-test of 1,325 USD or a little lower around 1,310 USD can be seriously considered a potential long-trigger targeting to anticipate a break to new yearly highs and an attack at the strong resistance zone around 1,360/370 USD.
In general, the bullish picture in Gold on a daily time-frame stays active as long as we trade above 1,266 USD:
Source: Admiral Markets MT5 with MT5-SE Add-on Gold Daily chart (between March 7, 2018, to June 6, 2019). Accessed: June 6, 2019, at 10:00pm GMT – Please note: Past performance is not a reliable indicator of future results, or future performance.
In 2014, the value of Gold fell by 1.7%, in 2015, it fell by 10.4%, in 2016, it increased by 8.1%, in 2017, it increased by 13.1%, in 2018, it fell by 1.6%, meaning that after five years, it was up by 6.4%.
Are you ready to start trading Gold with Admiral Markets? Find out how you can get started by clicking the banner below!
Disclaimer: The given data provides additional information regarding all analysis, estimates, prognosis, forecasts or other similar assessments or information (hereinafter “Analysis”) published on the website of Admiral Markets. Before making any investment decisions please pay close attention to the following:
This is a marketing communication. The analysis is published for informative purposes only and are in no way to be construed as investment advice or recommendation. It has not been prepared in accordance with legal requirements designed to promote the independence of investment research, and that it is not subject to any prohibition on dealing ahead of the dissemination of investment research.
Any investment decision is made by each client alone whereas Admiral Markets shall not be responsible for any loss or damage arising from any such decision, whether or not based on the Analysis.
Each of the Analysis is prepared by an independent analyst (Jens Klatt, Professional Trader and Analyst, hereinafter “Author”) based on the Author’s personal estimations.
To ensure that the interests of the clients would be protected and objectivity of the Analysis would not be damaged Admiral Markets has established relevant internal procedures for prevention and management of conflicts of interest.
Whilst every reasonable effort is taken to ensure that all sources of the Analysis are reliable and that all information is presented, as much as possible, in an understandable, timely, precise and complete manner, Admiral Markets does not guarantee the accuracy or completeness of any information contained within the Analysis. The presented figures refer that refer to any past performance is not a reliable indicator of future results.
The contents of the Analysis should not be construed as an express or implied promise, guarantee or implication by Admiral Markets that the client shall profit from the strategies therein or that losses in connection therewith may or shall be limited.
Any kind of previous or modeled performance of financial instruments indicated within the Publication should not be construed as an express or implied promise, guarantee or implication by Admiral Markets for any future performance. The value of the financial instrument may both increase and decrease and the preservation of the asset value is not guaranteed.
The projections included in the Analysis may be subject to additional fees, taxes or other charges, depending on the subject of the Publication. The price list applicable to the services provided by Admiral Markets is publicly available from the website of Admiral Markets.
Leveraged products (including contracts for difference) are speculative in nature and may result in losses or profit. Before you start trading, you should make sure that you understand all the risks.
Expect Boris Johnson, the person most likely to be the next UK Prime Minister, to drive down the pound even further should he win the leadership contest.
This is the stark warning from Nigel Green, the CEO of deVere Group, one of the world’s largest independent financial advisory organizations with $12bn under advisement.
The former London mayor is the odds-on favourite to win the Conservative party leadership contest, securing the support of more than 40 Conservative MPs, putting him far ahead of his rivals.
Mr Green says: “The pound will be delivered another bloody nose should Boris Johnson, the current frontrunner, win the race to be Tory leader and UK Prime Minister.
“Further downward pressure will hit sterling in this scenario due to the increased likelihood that the UK would be taken into a no-deal Brexit by Mr Johnson.
“Frontrunner Boris will be further emboldened in his no-deal Brexit approach should Nigel Farage’s Brexit party win its first parliamentary seat in the Peterborough by-election on Thursday evening.”
Mr Johnson told a conference in Interlaken, Switzerland: “We will leave the EU on 31 October, deal or no deal.” He intimated he could try to renegotiate a better deal with the EU before pushing ahead with a no-deal Brexit if necessary.
Mr Green notes: “Brexit aside, a Johnson victory would almost certainly increase sterling volatility. He is known for his erratic style and has a long history of gaffes and controversies – including his infamous ‘f**k business’ comment. If he takes the UK’s top job, his unscripted comments may result in sharp moves in the pound.”
He continues: “During the past two years, the pound has been battered when it comes to its price against other currencies.
“The significant drop in the value of the pound has contributed to reducing people’s purchasing power and a drop in UK living standards. Weaker sterling means imports are more expensive, with rising prices being passed on to consumers.
“The fall in the pound is good for exports some claim, but it must be remembered that around 50 per cent of UK exports rely on imported components. These will become more expensive as the pound falls in value.
“A low pound is, of course, bad news for British holidaymakers and travellers abroad – with trips to Europe and the U.S. increasingly expensive. Even destinations such as Dubai and China are more expensive as their currencies are pegged to the U.S. dollar.
“Arguably, the key issue for the UK, however, is that one of its biggest and most important sectors, financial services, will suffer from another knock to the pound. It will be hit because it is built on foreign investment that puts its faith in a strong pound.”
Financial services contribute 6.5% towards British GDP and is part of an overall service sector that forms 80% of the country’s economic output.
The deVere CEO concludes: “A weak pound has become the ‘new normal’ over the last three years since the referendum. But should Boris Johnson walk through that famous black door at Downing Street as PM, the pound can be expected to fall further still.”
About:
deVere Group is one of the world’s largest independent advisors of specialist global financial solutions to international, local mass affluent, and high-net-worth clients. It has a network of more than 70 offices across the world, over 80,000 clients and $12bn under advisement.
As we can see in the H4 chart, the ascending tendency continues. The pair has broken the channel’s upside border and formed Shooting Star pattern. Right now, it is trading downwards and may fall to reach 1310.00 unless fundamental background interferes. At the same time, we shouldn’t exclude an opposite scenario, which implies that the price may update the closest highs and continue moving upwards with the target at 1346.00.
NZDUSD, “New Zealand vs. US Dollar”
As we can see in the H4 chart, NZDUSD has been trading downwards for quite a long time. It has formed Shooting Star reversal pattern at 0.6666; right now, it is forming another correctional wave and resting the resistance line of the descending channel. If we assume that the price may rebound, just like it did before, the pair may reverse and resume falling towards its closest target at 0.6565. If this level is broken, the instrument may continue trading downwards. At the same time, one shouldn’t exclude an opposite scenario, according to which the instrument may move upwards without any corrections and update its closest highs.
Attention! Forecasts presented in this section only reflect the author’s private opinion and should not be considered as guidance for trading. RoboForex LP bears no responsibility for trading results based on trading recommendations described in these analytical reviews.
AUDUSD is trading at 0.6970; the instrument is moving above Ichimoku Cloud, thus indicating an ascending tendency. The markets could indicate that the price may test the cloud’s upside border at 0.6945 and then resume moving upwards to reach 0.7060. Another signal to confirm further ascending movement is the price’s rebounding from the support level. However, the scenario that implies further growth may be cancelled if the price breaks the cloud’s downside border and fixes below 0.6905. In this case, the pair may continue falling towards 0.6835.
NZDUSD, “New Zealand Dollar vs US Dollar”
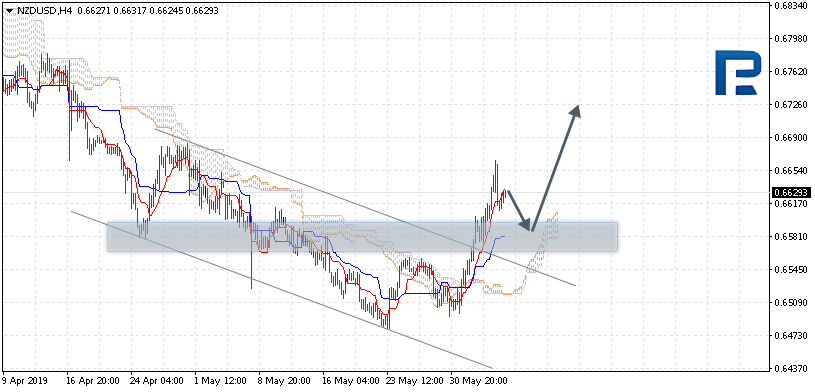
NZDUSD is trading at 0.6629; the instrument is moving above Ichimoku Cloud, thus indicating an ascending tendency. The markets could indicate that the price may test Tenkan-Sen and Kijun-Sen at 0.6595 and then resume moving upwards to reach 0.6725. Another signal to confirm further ascending movement is the price’s rebounding from the support level. However, the scenario that implies further growth may be cancelled if the price breaks the cloud’s downside border and fixes below 0.6500. In this case, the pair may continue falling towards 0.6430.
USDCAD, “US Dollar vs Canadian Dollar”
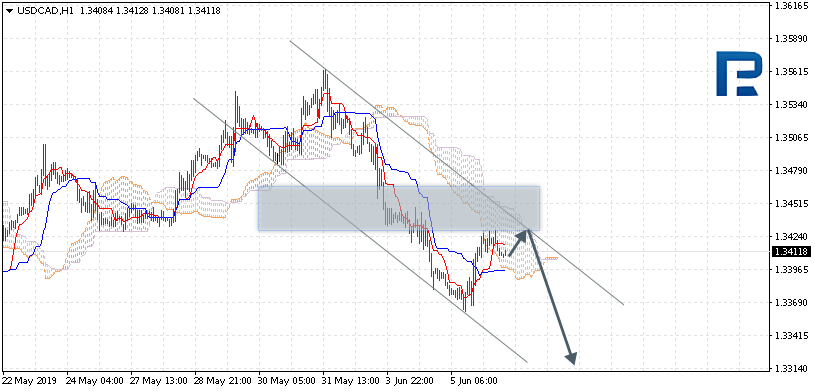
USDCAD is trading at 1.3411; the instrument is moving inside Ichimoku Cloud, thus indicating a sideways tendency. The markets could indicate that the price may test the cloud’s upside border at 1.3425 and then resume moving downwards to reach 1.3315. Another signal to confirm further descending movement is the price’s rebounding from the channel’s upside border. However, the scenario that implies further decline may be cancelled if the price breaks the cloud’s upside border and fixes above 1.3455. In this case, the pair may continue growing towards 1.3525. After breaking the cloud’s downside border and fixing below 1.3375, the price may continue moving downwards.
Attention! Forecasts presented in this section only reflect the author’s private opinion and should not be considered as guidance for trading. RoboForex LP bears no responsibility for trading results based on trading recommendations described in these analytical reviews.