During yesterday’s trading session, the US dollar strengthened slightly against a basket of major currencies. The American currency was supported by the decision of US President Donald Trump not to impose duties on Mexican goods. However, the US dollar is still under pressure due to rising expectations of lowering the interest rates by the Fed at upcoming meetings. The trade conflict between Washington and Beijing is in the spotlight. Yesterday, US President announced that he would increase tariffs on $300 billion worth of Chinese goods if his talks with President of the People’s Republic of China Xi Jinping did not take place in the upcoming G20 summit in Japan. The US dollar index closed yesterday in the positive zone (+0.23%).
The British pound has been declining after the publication of weak economic releases from the UK. GDP (m/m) fell by 0.4%, although experts expected a decline by only 0.1%. The manufacturing output (m/m) fell by 3.9% in April instead of the forecasted decline by 1.1%. Today we expect important statistics from the US and the UK.
The “black gold” prices have been growing after the fall the day before. Currently, futures for the WTI crude oil are testing $53.60 per barrel.
Market Indicators
Yesterday, bullish sentiment was observed in the US stock market: #SPY (+0.46%), #DIA (+0.28%), #QQQ (+1.17%).
The 10-year US government bonds yield rose slightly. Currently, the indicator is at the level of 2.15-2.16%.
The news feed on 2019.06.11:
– Data on the UK labor market at 11:30 (GMT+3:00); – Producer price index in the US at 15:30 (GMT+3:00).
On Monday the 10th of June, trading on the EURUSD pair closed slightly down. Markets were calm, with the pair trading around the LB balance line after the US and Mexico reached an agreement on border policies. If the agreement isn’t adhered to, tariffs will be increased. In such an event, investors will retreat towards safer assets. For now, everything is peaceful on the Forex market.
At the time of writing, the euro is trading at 1.1315. I expect to see a test of 1.1300 today, followed by a rebound from 1.1350. I can’t see the pair going any higher than that due to continued uncertainty over the US-China talks. On Monday, US President Donald Trump threatened an additional 300bn USD worth of tariffs on China if President Xi Jinping doesn’t come to the G20 summit on the 28th and 29th of June.
While speculators are already used to Trump’s aggressive rhetoric, they’re in no hurry to open any positions on riskier assets. There’s no significant news for the euro today. If there’s going to be anything happening today on the major pairs, it will be via the EURGBP cross in response to Brexit developments.
On Monday, the British Pound is slightly falling against the USD. However, in general the currency is looking quite stable.
On June 7th, the British Prime Minister Theresa May resigned from the position of the leader of the Conservative and Unionist Party, but she remains temporarily in charge. The procedure of finding a new head of the Party is starting today and the next leader will be announced before July 28th.
Since there are no emotional responses in the Pound, the above-mentioned news is not actually really new: they had been driving May from the position for a long time despite her attempts to conclude the Brexit agreement with the European Union the way it meant to be in the first place.
The list of successor candidates includes at least 11 people. The most perspective of them is Boris Johnson, a former Secretary of State for Foreign and Commonwealth Affairs, he is a favorite to take May’s chair. Johnson is a vocal opponent of the Brexit and everything May was doing. If Johnson gets the Prime Minister position, the United Kingdom and the Pound may face significant crisis due a complete reversal in priorities. Johnson’s ascension to power may result in a long-term stress for the national currency.
In the H4 chart, after breaking the rising channel, GBPUSD is forming the first wave to the downside with the target at 1.2630. After that, the instrument may be corrected towards 1.2710, where the channel was broken, and then resume trading inside the downtrend to reach 1.2490. From the technical point of view, this scenario is confirmed by Stochastic Oscillator, as its signal line is moving above the “oversold area”. After breaking 50, the instrument may fall faster to reach the target.
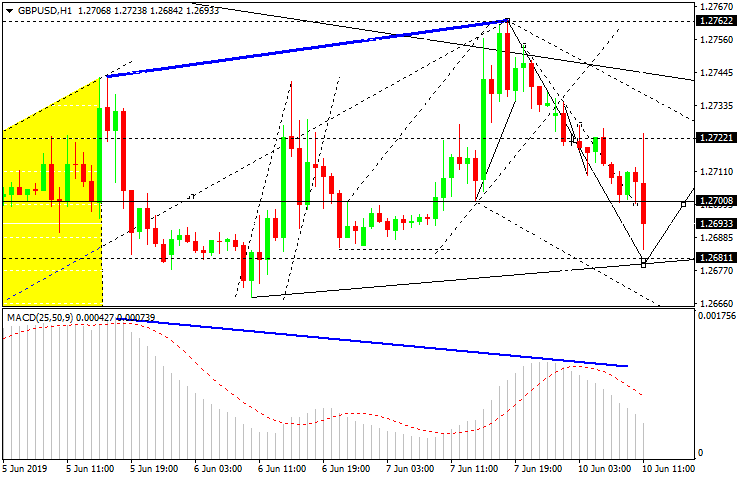
As we can see in the H1 chart, GBPUSD is trading downwards with the first target at 1.2681. Later, the market may start another correction to reach 1.2720 and then resume trading inside the downtrend towards 1.2630. From the technical point of view, this scenario is confirmed by MACD Oscillator, as its signal line is steadily moving downwards. After breaking 0, the downtrend may quicken. Such technical signal of the Oscillator is getting stronger with appearance of a divergence at the top of the bar chart.
Disclaimer
Any predictions contained herein are based on the authors’ particular opinion. This analysis shall not be treated as trading advice. RoboForex shall not be held liable for the results of the trades arising from relying upon trading recommendations and reviews contained herein.
EURUSD is moving downwards with the target at 1.1282. Possibly, today the pair may reach it and then form one more ascending structure towards 1.1315. Later, the market may start another decline to break 1.1282 and then continue trading inside the downtrend with the target at 1.1250.
GBPUSD, “Great Britain Pound vs US Dollar”
GBPUSD is forming the first descending impulse with the target at 1.2681. After that, the instrument may start a new correction towards 1.2722 and then resume falling with the target at 1.2644.
USDCHF, “US Dollar vs Swiss Franc”
USDCHF is trading upwards. Today, the pair may reach 0.9957. Later, the market may break this level and then continue growing with the short-term target at 1.0056.
USDJPY, “US Dollar vs Japanese Yen”
USDJPY is moving upwards; right now, it is forming the third correctional wave with the target at 109/18. After that, the instrument may form a new descending structure towards 108.53 and then start another growth with the target at 109.25.
AUDUSD, “Australian Dollar vs US Dollar”
AUDUSD is moving downwards. Today, the pair may reach 0.6962. If later the price breaks this level, the instrument may continue trading inside the downtrend with the first target at 0.6905.
USDRUB, “US Dollar vs Russian Ruble”
USDRUB has broken 64.92 and may continue falling to reach the target of the third wave at 64.51. Later, the market may start another correction towards 64.90 and then form a new descending structure; with the first target at 64.20.
XAUUSD, “Gold vs US Dollar”
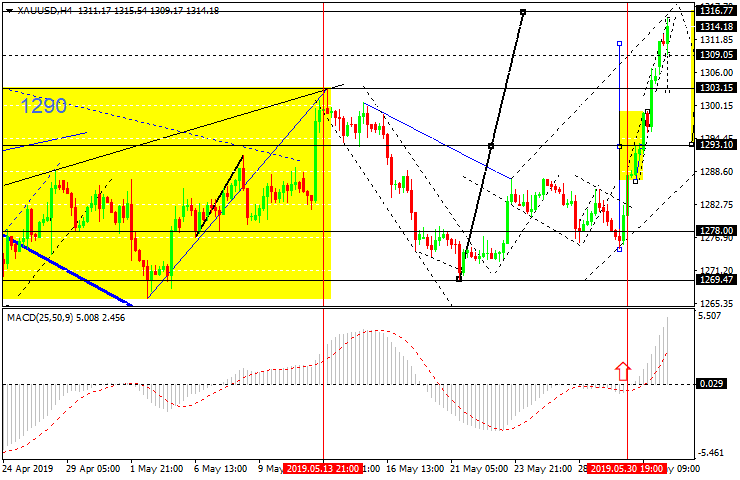
Gold is moving downwards. Possibly, the pair may break 1326.75 and then continue falling with the short-term target at 1309.00. After that, the instrument may continue growing to test 1326.70 from below and then form a new descending structure towards 1305.00.
BRENT
Brent is moving upwards with the target at 65.65. Later, the market may be corrected to reach 63.33 and then form one more ascending structure with the first target at 66.16.
Attention! Forecasts presented in this section only reflect the author’s private opinion and should not be considered as guidance for trading. RoboForex LP bears no responsibility for trading results based on trading recommendations described in these analytical reviews.
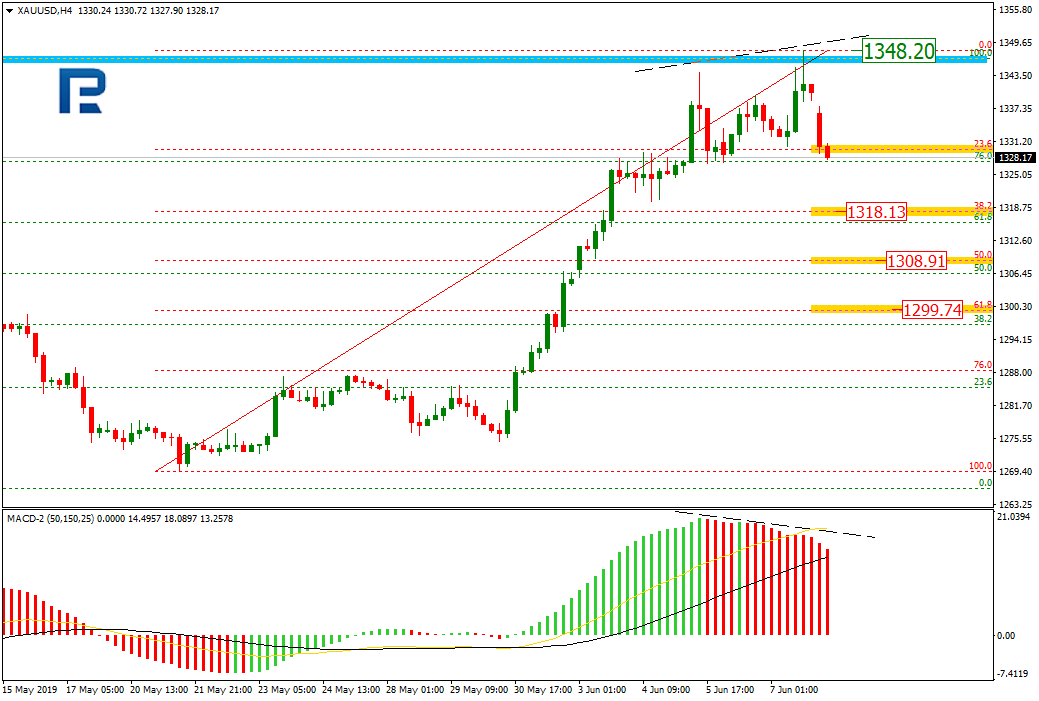
As we can see in the H4 chart, XAUUSD has broken the previous significant high and may continue the ascending tendency in the shirt-term. Right now, the pair is being corrected after the divergent and has already reached 23.6%. The next targets may be the retracements of 38.2%, 50.05%, and 61.8% at 1318.13, 1308.91, and 1299.74 respectively. The resistance is at 1348.20.
The H1 chart shows more detailed structure of the current descending tendency. The closest downside target is the retracement of 38.2% at 1318.13.
USDCHF, “US Dollar vs Swiss Franc”
In the H4 chart, USDCHF is steadily trading inside the long-term downtrend. By now, the pair has almost reached the retracement of 38.2%. The next downside target may be the retracement of 50.0% at 0.9712. The current movement may be considered as a short-term correction. The resistance is at 0.9989.
As we can see in the H1 chart, the pullback has reached the retracement of 38.2%. The next upside targets may be the retracements of 50.0% and 61.8% at 0.9976 and 1.0005 respectively. if the instrument breaks the low at 0.9854, the downtrend will continue.
Attention! Forecasts presented in this section only reflect the author’s private opinion and should not be considered as guidance for trading. RoboForex LP bears no responsibility for trading results based on trading recommendations described in these analytical reviews.
On Friday, June 7, USD kept losing positions against the majors. USD published a weak labour market report for May. The non-agrarian industry created 75K new jobs, which is below the market expectations of 185K. The average hourly wage grew by 0.2% in comparison to the forecasted 0.3%. The unemployment level is without changes at 3.6%. The quotes are consolidating around 1.13000-1.13450. The trading instrument can grow further. Open positions from the key levels.
At 17:00 (GMT+3:00) the US will publish a JOLTS report.
The price fixed above 50 MA and 200 MA which points to the power of the buyers.
The MACD histogram is in the positive zone but below the signal line which gives a weak signal to buy EUR/USD.
The Stochastic Oscillator is in the oversold zone, the %K line is crossing the %D line. There are no signals at the moment.
Trading recommendations
Support levels: 1.13000, 1.12500, 1.12200
Resistance levels: 1.13450, 1.14000
If the price fixes above 1.13450, expect further growth towards 1.13700-1.14000.
Alternatively, the quotes can descend towards 1.12600-1.12400.
The GBP/USD currency pair
Technical indicators of the currency pair:
Prev Open: 1.26876
Open: 1.27264
% chg. over the last day: +0.28
Day’s range: 1.27012 – 1.27359
52 wk range: 1.2438 – 1.3631
GBP/USD shows an ambiguous technical picture. There is no defined trend. Right now GBP is consolidating, the investors are waiting for important economic reports from the UK. The local support and resistance levels are 1.26850 and 1.27250. You should open positions from the key levels.
The Economic News Feed for 10.06.2019:
– GDP Report (UK) – 11:30 (GMT+3:00);
– Industrial Production Volume (UK) – 11:30 (GMT+3:00);
The indicators do not provide precise signals, the price has crossed 50 MA.
The MACD histogram is close to 0.
The Stochastic Oscillator is near the oversold zone, the %K line is crossing the %D line. There are no signals at the moment.
Trading recommendations
Support levels: 1.26850, 1.26400, 1.26100
Resistance levels: 1.27250, 1.27600
If the price fixes above 1.27250, expect further growth towards 1.27600-1.27800.
Alternatively, the quotes can descend towards 1.26500-1.26300.
The USD/CAD currency pair
Technical indicators of the currency pair:
Prev Open: 1.33617
Open: 1.32395
% chg. over the last day: -0.71
Day’s range: 1.32395 – 1.32768
52 wk range: 1.2727 – 1.3664
USD/CAD remains in the bearish mood. Friday was marked by agressive sales. The quotes updated the key minimums. The demand for CAD grew after a positive labour market report from Canada. An additional support is granted by the recovering oil quotes. The USD/CAD is consolidating around 1.32400-1.32900 and can descend further. You should open positions from the key levels.
At 15:30 (GMT+3:00) Canada will publish the construction permission report.
The price fixed below 50 MA and 200 MA which points to the power of the sellers.
The MACD histogram is in the negative zone but above the signal line which points towards selling USD/CAD.
The Stochastic Oscillator is in the neutral zone, the %K line is below %D which points to the bearish mood.
Trading recommendations
Support levels: 1.32400, 1.32000
Resistance levels: 1.32900, 1.33450, 1.33650
If the price fixes below 1.32400, expect further descend towards 1.32000.
Alternatively, the quotes can correct towards 1.33300-1.33500.
The USD/JPY currency pair
Technical indicators of the currency pair:
Prev Open: 108.399
Open: 108.465
% chg. over the last day: -0.21
Day’s range: 108.366 – 108.675
52 wk range: 104.97 – 114.56
The USD/JPY keeps trading in the long flat. There is no defined trend. The key instrument tests the local resistance at 108.650 with 108.300 acting as the nearest support. The quotes can recover further. Keep an eye on the US Treasury bonds’ yield and open positions from the key levels.
During the Asian trading session, Japan published a positive GDP report.
The indicators do not provide precise signals, the price crossed 200 MA.
The MACD histogram is in the positive zone which points to the bullish mood.
The Stochastic Oscillator is in the oversold zone, the %K line is above the %D line which gives a weak signal to buy USD/JPY.
Trading recommendations
Support levels: 108.300, 108.000, 107.850
Resistance levels: 108.650, 108.900, 109.200
If the price fixes above 108.650, expect further growth towards 108.900-109.200.
Alternatively, the qutoes can descend towards 108.000.
Today, we want to focus on the USD/CAD, and the impact that last Friday’s US and Canadian employment numbers had on the currency pair.
The NFPs came in significantly below expectations, at just 75,000 points against the 175,000 expected, with Average Hourly Earnings also disappointing MoM with just 0.2% against the expected 0.3%.
On the other hand, the Canadian Employment data came in strong, with a net change in employment of 27,700 versus an 5,000 estimate, while the unemployment rate came in at 5.4% versus the 5.7% expected.
As a result, the USD/CAD dropped significantly below the long term trendline and attacking the crucial support region around 1.3280. A break below would clearly identify the attempt to break above 1.3500/3550 as a fake-out, and activate as a first target 1.3170 on the downside.
A potential driver lower could come from solid housing numbers from Canada, while any disappoint in JOLTs Jobs openings could trigger further US recession fears among market participants:
Source: Admiral Markets MT5 with MT5-SE Add-on USD/CAD Daily chart (between March 9, 2018, to June 7, 2019). Accessed: June 7, 2019, at 10:00pm GMT – Please note: Past performance is not a reliable indicator of future results, or future performance.
In 2014, the value of the USD/CAD increased by 9.4%, in 2015, it increased by 19.1%, in 2016, it fell by 2.9%, in 2017, it fell by 6.4%, in 2018, it increased by 8.4%, meaning that after five years, it was up by 28.4%.
Investing in Forex with Admiral Markets
Admiral Markets offers professional traders the ability to trade with a custom, upgraded version of MetaTrader 5, allowing you to experience trading at a significantly higher, more rewarding level. Experience benefits such as the addition of the Market Heat Map, so you can compare various currency pairs to see which ones might be lucrative investments, access real-time trading data, and so much more. Click the banner below to start your FREE download of MT5 Supreme Edition!
Disclaimer: The given data provides additional information regarding all analysis, estimates, prognosis, forecasts or other similar assessments or information (hereinafter “Analysis”) published on the website of Admiral Markets. Before making any investment decisions please pay close attention to the following:
This is a marketing communication. The analysis is published for informative purposes only and are in no way to be construed as investment advice or recommendation. It has not been prepared in accordance with legal requirements designed to promote the independence of investment research, and that it is not subject to any prohibition on dealing ahead of the dissemination of investment research.
Any investment decision is made by each client alone whereas Admiral Markets shall not be responsible for any loss or damage arising from any such decision, whether or not based on the Analysis.
Each of the Analysis is prepared by an independent analyst (Jens Klatt, Professional Trader and Analyst, hereinafter “Author”) based on the Author’s personal estimations.
To ensure that the interests of the clients would be protected and objectivity of the Analysis would not be damaged Admiral Markets has established relevant internal procedures for prevention and management of conflicts of interest.
Whilst every reasonable effort is taken to ensure that all sources of the Analysis are reliable and that all information is presented, as much as possible, in an understandable, timely, precise and complete manner, Admiral Markets does not guarantee the accuracy or completeness of any information contained within the Analysis. The presented figures refer that refer to any past performance is not a reliable indicator of future results.
The contents of the Analysis should not be construed as an express or implied promise, guarantee or implication by Admiral Markets that the client shall profit from the strategies therein or that losses in connection therewith may or shall be limited.
Any kind of previous or modeled performance of financial instruments indicated within the Publication should not be construed as an express or implied promise, guarantee or implication by Admiral Markets for any future performance. The value of the financial instrument may both increase and decrease and the preservation of the asset value is not guaranteed.
The projections included in the Analysis may be subject to additional fees, taxes or other charges, depending on the subject of the Publication. The price list applicable to the services provided by Admiral Markets is publicly available from the website of Admiral Markets.
Leveraged products (including contracts for difference) are speculative in nature and may result in losses or profit. Before you start trading, you should make sure that you understand all the risks.
On Friday, the US dollar fell against a basket of major currencies due to a weak report on the US labor market for May. The number of people employed in the nonfarm sector was only 75K, while experts expected an increase by 185K. Average hourly wages increased by 0.2% instead of 0.3%. The unemployment rate remained at the same level of 3.6%. These statistics have strengthened forecasts that the Fed may reduce interest rates at upcoming meetings. The US dollar index closed in the negative zone (-0.52%).
Meanwhile, the Mexican peso rose sharply against the dollar after the US and Mexico concluded a migration agreement at the end of last week, preventing a tariff war and improving investors’ sentiment. The agreement will speed up the program known as the Migration Protection Protocols, which came into force in December. This program sends migrants who seek asylum in the United States to wait in Mexico while their cases are being considered. The agreement will mean that the United States immediately expand the implementation of the MPP across the entire 2,000-mile (3,220 km) southern border.
The “black gold” prices have been growing. At the moment, futures for the WTI crude oil are testing the mark of $54.20 per barrel.
Market Indicators
On Friday, aggressive purchases were observed in the US stock market: #SPY (+1.00%), #DIA (+0.98%), #QQQ (+1.93%).
The 10-year US government bonds yield rose slightly. At the moment, the indicator is at the level of 2.12-2.13%.
The news feed on 2019.06.10:
– Data on UK GDP at 11:30 (GMT+3:00); – Manufacturing production in the UK at 11:30 (GMT+3:00); – JOLTS job openings in the US at 17:00 (GMT+3:00).
Closing out the first week in June 2019, the US stock market rallied hard from recent lows and prompted many traders/investors to rethink their future plans. At the same time, Gold and Silver began a decent price rally of their own while Oil found support just above $50. It certainly has been an interesting week for traders. One that was full of incredible opportunity as many symbols rotated 6 to 12% or more over the past 10+ days.
The fact that Oil is finding support above $50 while Gold and Silver continue to rally suggests that fear may be entering the metals market while Oil may have found a temporary price bottom near $50 to $51. Weakness in the US Dollar is also helping both Oil and Metals to push higher. Our recent research suggests that the US Dollar will find support near $95 indicates the US Dollar may fall a bit further – pushing Oil and Metals a bit higher.
The strength in the US stock market near the end of the week suggests fear of any US collapse or future economic concerns appears to be abated. It is very unlikely the US major indexes would rally as they have on any extreme fear of any major US calamity or economic concerns. A slightly weakening US Dollar and moderately strong US economic data continues to suggest the US stock market may continue to be the repository of funds for foreign investors for many years to come – or until something dramatic changes in the US.
It is rather simple to understand the capital process that is at work in the global economy at the moment; until foreign market valuations and expectations appear to be opportunistic for future returns, the US Dollar and the US stock market are the most likely targets for foreign investment and safety. Weakening currencies, weakening global economies and weakening commodity prices will push capital away from foreign markets and into safety. Safety will be found in the US markets, precious metals and possibly Crypto currencies. Anything that avoids deflationary risks and credit/debt risks.
This YM Weekly chart highlighting our Fibonacci price modeling system shows how dramatic the upside price reversal was by the end of last week. The closing candles created an Engulfing Bullish candlestick pattern which is typically quite bullish. The fact that price closed above the GREEN Fibonacci trigger level is further indication that a renewed price rally may begin soon. Support near $24,000 appears to be quite strong and any further downside price risk must first break this level. As long as support holds and price continues an upside bias, there is a very strong potential for a move to above $28,000 in the works.
This NQ chart highlights a similar price pattern and suggests the NQ needs to climb above $7600 before a true rally can begin. Ultimately, the upside targets for this move are near $8500 or higher based on current price rotation. Support near $6800 is critical – so price must stay above this level for any future rally to continue.
We authored a VIX/Volatility article just a few days ago that highlighted our believe that the VIX would trade lower, within a sideways price channel till near the end of July or August 2019 – then begin another VIX Spike move upward. This coincides with the current research we are seeing where the US stock market will likely continue to push higher, very possibly setting new all-time highs again, before any real risk of any downside price collapse happens.
Follow our research and don’t miss these opportunities. We’ve been warning our followers for months that 2019 and 2020 are going to be incredible years for skilled traders. These recent 10 to 20% moves in Gold, Silver, Oil and many ETFs are just the beginning. Our research team and trading team are ready to help you find and execute for better success.
On Friday the 7th of June, trading on the euro closed up. The single currency rose to 1.1348 in light of a broadly weaker greenback following the US jobs report.
75k new jobs were added to the US economy outside the agricultural sector, against an expected 185k, showing a steep decline in job growth in May. The readings for the previous two months were revised downwards by 75k. The unemployment rate came out at 3.6% as predicted, while the workforce participation rate remained unchanged at 62.8%. Average hourly earnings rose by less than expected. Overall, the report has increased expectations of a rate slash by the Federal Reserve.
Day’s news (GMT+3):
11:30 UK: GDP (Apr), industrial production (Apr), manufacturing production (Apr), trade balance (Apr).
15:15 Canada: housing starts (May).
15:30 Canada: building permits (May).
16:00 UK: NIESR GDP estimate (May).
17:00 US: JOLTS job openings (Apr).
Current situation:
Following the ECB meeting and payrolls report, the euro has significantly improved its position against the dollar. At the time of writing, the EURUSD pair is trading at 1.1304. The economic calendar is empty today as far as the euro is concerned. As such, I expect to see a decline to 1.1275 without any pullbacks.
The current rebound has come to about 45 degree, which intersects the trend line. This is a significant support level, so we can expect an upwards rebound here. At least this is what classical technical analysis tells us. After a recovery to 1.1320, I expect to see a breakout of the trend line and a subsequent drop to 1.1290.
 Current situation: