We have been pouring over the data and currently believe our earlier prediction of a July/August 2019 market top should be revised to an Aug/Sept 2019 expected market top pattern. The following research posts we authored recently suggested a top may form in July/Aug 2019 and believe this critical top formation would form at new all-time highs. We still believe this is possible regarding the price predictions, yet we believe the price top will now form near the end of August or early September after an extended Pennant/Flag formation is completed.
Please review the following research posts by our team…
June 5, 2019: Fear Drives market Expectations: HERE
May 14, 2019: Trade Issues Will Drive Market Trends, Part II: HERE
March 31, 2019: Proprietary Cycles Predict July Turning Point For Stock Market:HERE
Using our proprietary price modeling tools and systems, believe the critical price peak in the US stock market will now happen between August 26 and September 20 (see the chart below). A number of key factors are lining up to extend this topping pattern into August/September and the key component is the formation of the Pennant/Flag formation and the fact that this price pattern must complete before a breakout/breakdown move is possible.
An upside price bias will continue throughout the formation of the Pennant/Flag formation leading to a moderate price breakout where the S&P will briefly break through the $3000 price level, then stall – forming the Top pattern/rotation we are expecting.
A continued Capital Shift will drive prices higher over the next 45 to 60+ days where foreign capital will continue to chase the strong US Dollar and the strength of the US stock market. The true critical price move, where our analysis will become even more important, happens after September 1, 2019 – where the Pennant Apex and a critical inflection point are set.
On June 5, 2019, we posted this VIX chart in the article listed above. The US stock market will rotate higher in an upward price bias over the next 45+ days. This will project the Pennant/Flag formation and set up the critical top pattern that we are expecting in late August or early September. When you look at this chart of the VIX, below, consider that the upside price move in the VIX may be delayed by about 10 to 15 days based on our newest analysis. We still believe the VIX expansion will happen as we are suggesting, we are altering the timeline of these predictions to support our newest research.
As we move closer to these critical dates, we’ll keep you informed of our expectations and what new information our predictive modeling systems are suggesting. In the meantime, get ready to play some moderate price swings. Don’t get caught on the short side of this move just yet. We have no real confirmation that a large downside move will take place over the next 60+ days and these early shorts are going to feel a lot of pressure over the next 45 to 60+ days if the market moves higher.
This is one scenario of how the stock market may play out, we have a few others we are following with subscribers to our Wealth Building Newsletter with much more detail. Each day we share a pre-market video and show you where all the major markets are headed for the day, week and month ahead. The analysis is done on the futures market but we focus on trading ETFs for the indexes and commodities.
Many don’t even consider Iran to be at the forefront of cryptocurrency adaptation, but in fact, it is the country that many believe, will be the first to introduce a nationalized cryptocurrency.
Yes, the middle eastern state is very friendly to the blockchain technology and even provides subsidies on electricity for using it as a mining source for cryptocurrencies.
When the crypto winter back in 2018 hit, nearly every large crypto mining company had to reduce its operations, lay off hundreds of staff and delay all of their expansion plans simply due to the price drops.
Iran was barely scratched however, the local crypto mining companies continued operations like anything had even happened. Many were curious as to what these companies were doing differently from others that generated them so many profits even during a recession of the crypto market.
The Iran energy subsidies
Iran is actually quite famous in the region for its subsidies on energy consumption. The state spends around $2 billion each year on energy so that the population has to dish out only a small fraction of the actual cost.
Electricity being the primary cost of operating a crypto mining company is actually a key player here. If the company does not have anything to worry about besides payrolls and maintenance, then it has a much larger margin for making profits.
Furthermore, the Iranian authorities were quite forgiving towards the mining companies, going as far as recognizing the industry as a legitimate part of the economy and providing all the benefits that regular corporations could use within the country.
However, that may soon change due to shifts in the political spectrum of the region. Tensions are beginning to rise between traditional financial companies and crypto mining firms due to the inequality in payments and the energy subsidies from Iran are also in danger from the US sanctions.
Future looks grim
Despite the fact that institutional interest in cryptocurrencies has been growing worldwide, there are very few partnerships being signed in Iran as we speak. Most of the countries that are leading the blockchain B2B agreements are in the West like the European Union and the United States of America.
Iran is quickly falling behind the scalability of the blockchain, but it also looks like they’re about to throw another wrench in the industry’s gears.
Many thought that this was a personal vendetta against profitable companies, but in reality, it is a desperate measure to keep the country’s economy afloat in the long term.
The United States sanctions have hit hard against the Iranian economy and are bringing it down as we speak. The government simply cannot afford to continue its features any longer and needs to find ways to cut costs no matter how damaging they may be in the long long-term. The mid and short term economic stability is much more pressing for the authorities.
However, this could be the perfect time to implement an amendment like this, because the crypto market is back up again. The energy costs aren’t going to be as damaging to the companies anymore and they can also stay afloat while paying the full price for energy consumption.
Was it a personal vendetta though?
Despite the fact that the authorities try to avoid blaming US sanctions, many citizens and foreign experts already understand that it’s indeed the case. However, this may not be the only reason crypto mining companies may take a hit to their profitability.
You see, these companies have been enjoying relatively free operational procedures, without the government interfering in their inner circles too much. However, the Central Bank of Iran has already proposed that maybe it’s time to introduce a regulation on these companies and tax them accordingly.
The compiling costs in taxes, energy consumption and employee wages could finally bring down these behemoths, but that still remains to be seen.
Iran is still in the midst of discussing a national cryptocurrency in the future, which will be used as an alternative to their current rial.
This is obviously being done to safeguard the economy in the case of even harder US sanctions which have already done a number on rial’s exchange rate to the US Dollar.
Should the authorities go ahead with the national cryptocurrency idea, they will definitely need the help and guidance of their local crypto mining companies. Whether or not they get that guidance depends solely on what type of regulation they introduce.
Last week, from a fundamental point of view, was super interesting for EURUSD. We had new policy insights from ECB and FED. I think that till now, everything was already repeatedly commented and analysed in all media by many experts. In this piece, we will focus mostly on the technical analysis. Yes, fundamentals can show you the way but at the end of the day, what counts is what traders will do with that information. In the case of the EURUSD, the final outcome was simple: buy.
Over the course of April and May, EURUSD created a large double bottom formation. The first bottom was created at the end of April and the second one at the end of May. On Thursday, thanks to the ECB and Mario Draghi, the price went significantly higher, breaking the neckline of this reversal pattern (yellow, around 1.126). Along with the neckline, the price broke the major downwards trend line (black), which was connecting lower highs since September 2019. Closing the day above those two was a clear signal to go long.
Today, traders are witnessing a bearish correction. This kind of movement can be perceived as normal and should not worry euro bulls. As long as the price is above the yellow line, the sentiment is positive and we should see a further rise. Positive sentiment will be denied if the price closes the day below the black line, which for now, is not very likely to happen.
The end of May and beginning of June were excellent for gold bulls. Everything went smoothly and according to the technical plan. At Alpari, we were signaling the possibility of a significant upswing from the 23rd of May. Apart from the price action factors, there was a bit of luck here. Help came from the fundamental side of the market – from the White House. Markets were shocked by the proposal of new tariffs targeting Mexico. The combination of Mexico, China, and Iran put the market firmly in risk off mode, so a situation where gold was poised for gains.
Technically, rises were supported by the fact that gold managed to defend the long-term up trendline (orange) and bounced from the 38.2% Fibonacci, which for the past few weeks was a crucial support. All that was happening inside of the wedge, which is a trend continuation pattern and was promoting a breakout to the upside. The decisive bullish attack happened on the last day of May and the first trading day of June brought us a continuation of the golden optimism.
Everybody was wondering if buyers will have enough power to beat the tops from February and set new long-term lows. The answer to that question came on Friday and was positive. Monday brings us an agreement with Mexico, and along with it a correction on gold. This correction could easily turn into a reversal. Everything is in bullish hands now. If the current drop is only meant to be a correction, we should see a rise sometime soon. Staying below the recent top for longer will be a definite negative sign and the bulls should avoid this situation at all costs.
Project 2049, Armitage, Budget Ploys and Taiwan Nexus
By Dan Steinbock
In the Shangri-La Summit, the Trump administration introduced a new, muscular Indo-Pacific strategy. It is fueled by private interests of corporations, defense contractors and foreign governments – not by the interests of the United States, China or emerging Asia.
Recently, the Pentagon and State Department informally notified Congress of a potential $2 billion deal with Taiwan, which includes the first-time sale of one of the US Army’s top tanks, drawing protests from China.
In the Shangri-La Dialogue, which took place only days before, Acting Defense Secretary Patrick Shanahan pledged the United States would no longer “tiptoe” around Chinese behavior in Asia and warned about the new US “toolkit of coercion.”
Here’s the real key to the new Indo-Pacific stance, however: While emphasizing US commitment to the region, Shanahan urged US allies and partners to increase defense spending. What the Trump administration calls “burden sharing” is predicated on the idea that Asian economies should increasingly “buy American” military hardware from Pentagon contractors, even if it would split the region and undermine the promise of the Asian Century.
How did private military interests capture Pentagon’s Indo-Pacific policy?
Project 2049, Armitage and China as a budget ploy
Secretary Shanahan got his post only last January. That’s when Jim Mattis left the job over policy differences with President Trump. Shanahan is the public face of the “new” US Indo-Pacific strategy, but not necessarily its architect.
The credit should go to Steve Bannon, President Trump’s former chief strategist and American far-right’s leading spokesman who predicted in 2016 that the United States and China will fight a war within the next 10 years. To ensure the path to war before he was forced out from the White House, Bannon was able to have his candidate, Randall Schriver, appointed as Pentagon’s top chief for Asia. Now Schriver serves as Assistant Secretary of Defense for Indo-Pacific Security Affairs.
For years, Schriver has been known as a “critic of China and a friend of Taiwan.” In the early 2000s, the military veteran worked on the Bush-Cheney campaign in the Asia policy team, until Deputy Secretary of State Richard Armitage hired him as his chief of staff. Armitage’s distinguished career has been overshadowed by moral lapses – from allegations of heroin dealing in Vietnam and regime change in Iraq in the ‘90s to the Plame Affair and pushing arms sales in Taiwan against US government-designated buys.
When the two launched their Project 2049 Institute in 2008, Armitage became its chairman and his protégé Schriver its president. For a decade, the Institute pushed hard for a tougher diplomatic approach against China and increased military sales to Asian countries, particularly Taiwan. This stance led to President-elect Trump’s controversial call to President Tsai in December, which bolstered her lingering ratings ahead of the 2020 election, fostering a tougher line against China.
China as a budget ploy
After the 2018 National Defense Strategy defined China as a “strategic competitor,” Schriver introduced in May Pentagon’s 2019 China Military Power Report, which deemed that China has embarked on a 30-year program to eclipse the United States as the preeminent military power in the Indo-Pacific region. Based on unspecified observations, the Report misunderstood – or purposefully misrepresented – China’s stated goal of becoming a world-class military by 2049 as the fulfillment of the neoconservative fear that China sought to overthrow the US in the global arena.
Consummate military veterans were quick to call the bluff. Col. Lawrence Wilkerson, former chief of staff of Secretary of State Colin Powell, called the Report an exercise in “hypocrisy.” “This is all about money,” said Wilkerson. “This is a budget ploy.” Wilkerson also warned that the Trump administration’s combative attitude toward China increases the potential for a seemingly “inevitable” fight.
Nevertheless, the budget ploy means great business to Pentagon’s contractors, which have thrived during the Trump era. That’s also why Taiwan’s national security chief David Lee met White House national security adviser John Bolton in May, marking the first meeting in more than four decades between senior US and Taiwanese security officials.
If Pentagon’s report on China’s military expansion is hypocrisy and the new Indo-Pacific strategy is all about money, well, let’s follow the money.
The Indo-Pacific money machine
In today’s Pentagon, a revolving door stands too often between the Department of Defense and its contractors. Even Secretary Shanahan is a case in point. Prior to government, he served more than 30 years at Boeing, the largest US military exporter. After Trump selected him to drive the massive rearmament, he was targeted by Pentagon’s Office of Inspector General in March, due to allegations he improperly advocated on behalf of Boeing against Lockheed Martin. Month later, he was cleared of the allegations; by the very same Pentagon (the assumption being that the DoD can police itself).
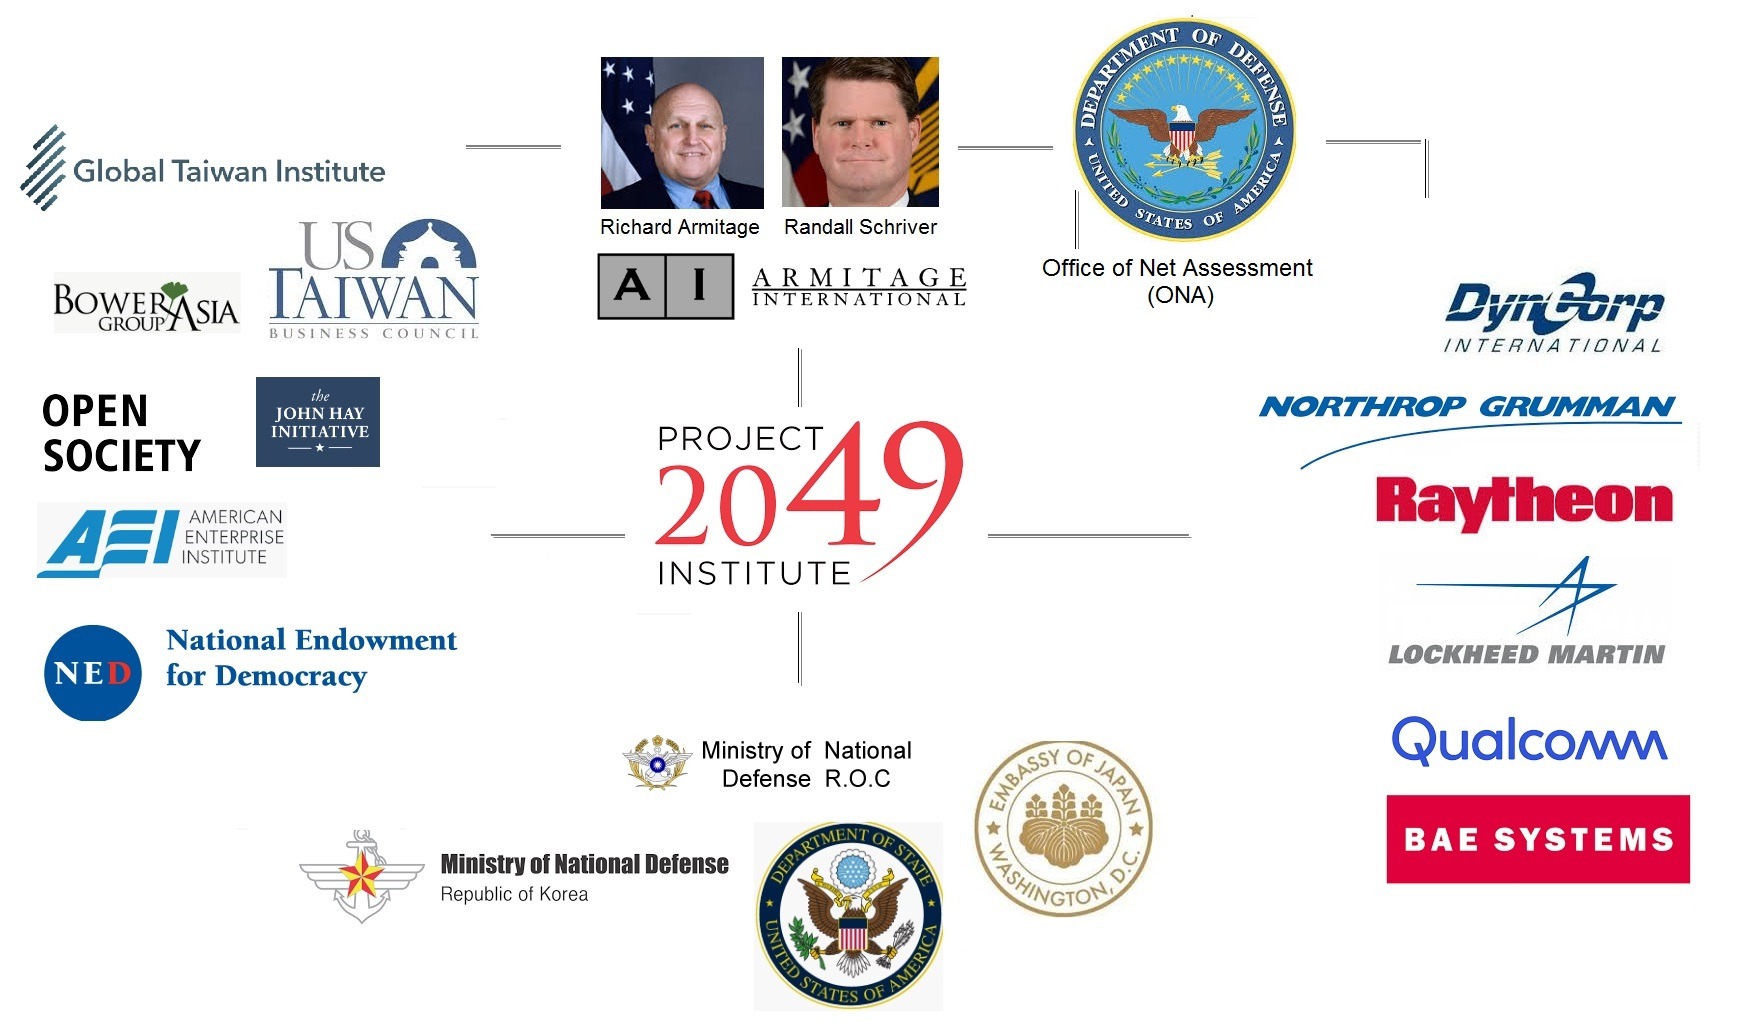
Yet, the debacle is minor relative to the Project 2049 Institute, whose contributors’ comprise leading US defense contractors (BAE, Lockheed, Northrop), US government agencies (US State Department; the Office of Net Assessment, Pentagon’s in-house think-tank), quasi-governmental organizations that play a role in hybrid warfare and regime change (Soros’s Open Society, National Endowment for Democracy, RAND), foreign government agencies and quasi-independent think-tanks, most of which represent defense hawks in Taiwan and Japan (see Figure 1).
More importantly, when Richard Armitage and Randall Schriver launched the Project 2049 Institute, they did not create a lobbying firm, as many have done, but a consulting company. A lobbyist is constrained by significant disclosure requirements, a consultant is not. The arrangement resulted in an odd parallel structure, which led Schriver – and several of his colleagues – to serve as partner at Armitage International, even as he split half his work time as president of Project 2049. In Pentagon, Schriver has been issued a nominal ethics waiver, but not with appropriate scope and coverage, as investigative journalists have shown.
Indeed, Project 2049 does not seem to be the independent “nonprofit research organization” it purports to be. Rather, the shrewd arrangements ensure minimal public disclosure and maximum cash flow from private-sector clients (Figure 2).
Figure 2 Project 2049 and Armitage: A Simplified Influence Chart
Cashing on the US-Taiwan Nexus
Taiwan has long played a central role to Armitage and Schriver whose ties with the country go back to early ‘90s. Through Bannon, Schriver gained access to the Trump White House (Armitage supported Hillary Clinton’s 2016 campaign). By summer 2018, Schriver declared Taiwan a partner of US Indo-Pacific strategy. It was an effort to redefine the US One-China policy as de facto Dual-China policy.
Soon thereafter Armitage, Institute Executive Director Mark Stokes and retired Adm. Scott H. Swift, ex-commander of the US Pacific Fleet, led the Project 2049 delegation to the office of Taiwanese President Tsai, who “took the opportunity to thank Armitage and Swift, for their long-standing support for Taiwan.”
This support has operated on many levels. Before Project 2049, Mark Stokes, himself a retired Lieutenant Colonel, served as VP and Taiwan country manager for Raytheon International, a major defense contractor, and has served on the board of Global Taiwan Institute, which has a “passion for closer US-Taiwan ties.”
Before Pentagon, Schriver himself was on board of US-Taiwan Business Council. These ties have a critical role, as the US-Huawei conflict is spreading to semiconductors in which Pentagon would prefer to insulate China from Taiwanese capabilities. The Council also hosts annual US-Taiwan defense industry conferences, whose past speakers include funders of Project 2049, and controversial lobbyists, such as Orion Strategies.
The Council’s president is Rupert Hammond-Chambers who is also a board member of Project 2049. In addition to US-Taiwan Business Council and Project 2049, he is managing director of Taiwan for Bower Group Asia and responsible for the Group’s Asia defense and security practice. Bower Group, in turn, is involved with several, presumably independent ASEAN think-tanks and the US-based Center for Strategic and International Studies (CSIS), in which Schriver remains a senior policy adviser. It has also been associated with the CSIS-linked Asia Maritime Transparency Initiative (AMTI), as well as US-ASEAN Business Council.
Dan Blumenthal is still another Project 2049 board member. He is Asia chief at American Enterprise Institute (AEI), whose luminaries orchestrated the invasion of Iraq and the subsequent, disastrous occupation. Blumenthal is also a member of the secretive John Hay Initiative (JHI), a “volunteer network of over 250 foreign policy, defense, and intelligence experts who advise elected officials and candidates for public office.”
The JHI was named according to John Hay, who in the 1890s developed the “Open Door Policy” that permitted America to preserve its “anti-colonial” image, even as it benefited from China’s colonial plunder. Schriver’s Indo-Pacific strategy seems to be following in the footprints.
———————–
In the Project 2049 Institute, Schriver and his colleagues have urged America to prepare against Chinese territorial incursions. In Armitage International, they have served clients that are willing to pay for preparing against such incursions. And in Pentagon, Schriver presumably “oversees” such activities.
It’s a shrewd arrangement that allows companies – domestic, foreign, military, NGOs, you take your pick – to advance policy positions as lobbyists might. And it takes place at the highest levels of US government, under the guise of neutral advisories.
It would also seem to penalize the sovereign interests of the United States, China and the rest of Asia. And it has potential to turn into a tragic catastrophe.
About the Author:
Dr. Dan Steinbock is the founder of Difference Group and has served at the India, China and America Institute (US), Shanghai Institute for International Studies (China) and the EU Center (Singapore). For more, see http://www.differencegroup.net/
A version of the commentary was published by China-US Focus on June 8, 2019
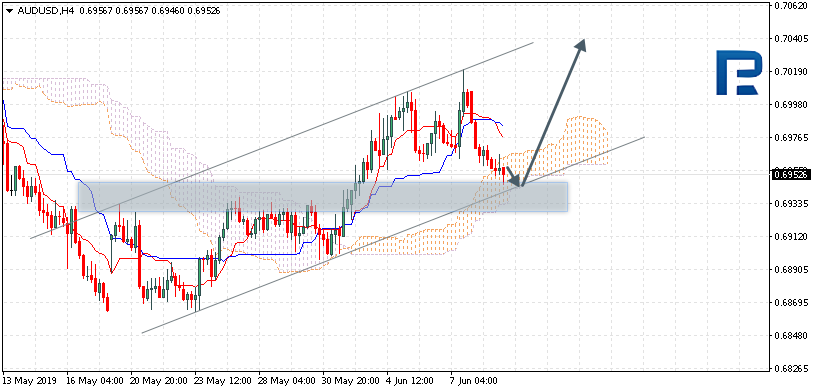
AUDUSD is trading at 0.6952; the instrument is moving inside Ichimoku Cloud, thus indicating a sideways tendency. The markets could indicate that the price may test the cloud’s downside border at 0.6945 and then resume moving upwards to reach 0.7040. Another signal to confirm further ascending movement is the price’s rebounding from the channel’s downside border. However, the scenario that implies further growth may be cancelled if the price breaks the cloud’s downside border and fixes below 0.6925. In this case, the pair may continue falling towards 0.6875. After breaking the cloud’s upside border and fixing above 0.6985, the price may continue moving upwards.
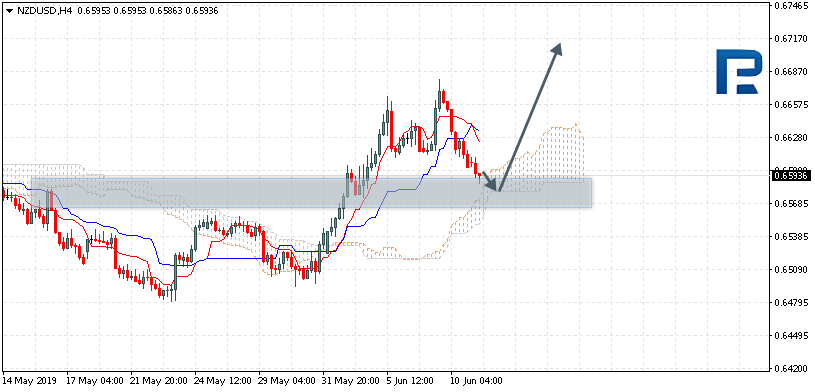
NZDUSD, “New Zealand Dollar vs US Dollar”
NZDUSD is trading at 0.6593; the instrument is moving above Ichimoku Cloud, thus indicating an ascending tendency. The markets could indicate that the price may test the cloud’s downside border at 0.6585 and then resume moving upwards to reach 0.6720. Another signal to confirm further ascending movement is the price’s rebounding from the support level. However, the scenario that implies further growth may be cancelled if the price breaks the cloud’s downside border and fixes below 0.6555. In this case, the pair may continue falling towards 0.6465.
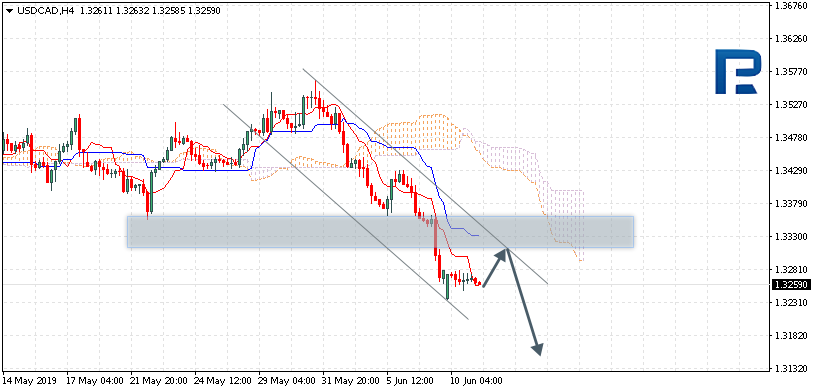
USDCAD, “US Dollar vs Canadian Dollar”
USDCAD is trading at 1.3259; the instrument is moving below Ichimoku Cloud, thus indicating a descending tendency. The markets could indicate that the price may test Tenkan-Sen and Kijun-Sen at 1.3315 and then resume moving downwards to reach 1.3175. Another signal to confirm further descending movement is the price’s rebounding from the channel’s upside border. However, the scenario that implies further decline may be cancelled if the price breaks the cloud’s upside border and fixes above 1.3415. In this case, the pair may continue growing towards 1.3500.
Attention! Forecasts presented in this section only reflect the author’s private opinion and should not be considered as guidance for trading. RoboForex LP bears no responsibility for trading results based on trading recommendations described in these analytical reviews.
After an incredible rally in Natural Gas that our researchers called perfectly in November 2018, another opportunity for an upside price move appears to be setting up for later this year. We believe the current price lows, near $2.30, are setting up for a bounce and then will drop and form a basing pattern near $2.00 before rocketing higher. It is this last move to the downside which will set up the incredibly deep price base and oversold conditions for the upside price move in late August/September 2019.
We’re issuing this research post to alert all of our followers to our research and to allow for proper price rotation for this base to set up and conclude before jumping into any false triggers that may occur on the Daily or Weekly charts.
Start by taking a look at this Monthly NG chart showing how extended high price peaks are usually followed by extended price declines. It is very unlikely that any upside price move will begin before late August or early September 2019.
In fact, our data mining utilities confirm this by suggesting that June, July, and August are all typically lower price months by a factor of 1.5:1 and 2:1 mostly over the past 24 years. September is the first monthly data point to break this cycle with a positive historical price bias of nearly 9:1.
Therefore, the closer we get to September 2019, the more likely we are going to see a basing in price near $2.00 (or below) and traders would be wise to prepare for this move before it happens.
Our Weekly Fibonacci price modeling system is suggesting a moderate move upward of about $0.25 is likely over the next few weeks before price may rotate lower, again, and attempt to fall below the $2.25 level as it continues to rotate towards the ultimate base.
Our researchers believe the ultimate price base will be near $2.00 (roughly between $1.85 and $2.15) as our Weekly Fibonacci modeling tool is suggesting. After price establishes the new price peak in late June, we’ll have more data to compare for the proper location of the ultimate price base.
This Daily chart highlights our expectations for NG over the next few weeks – fairly strong potential for a move higher, above $2.50, where the price will stall and reverse back to the downside. Ultimately, this peak will turn out to be nothing more than required price rotation to support the ultimate base pattern setup later in August or September 2019.
Don’t get too excited about Natural Gas just yet. The setup and future trade are in the process of creating a deep price base that will likely end near late August or early September 2019. We believe September 2019 will be the breakout month for NG as a price advance really takes hold. If historical data is any guide, the 9:1 upside bias of September following the 1.4:1 downside bias of August suggests that the September upside price move could push NG prices well above $3.50 or $4.00 very quickly.
If you wanna become a technical trader with use and trade ETFs then be sure to join our Wealth Building Newsletter today and get our daily video analysis and swing trade alerts. In the past 17 months, our newsletter trade signals have generated 91% ROI for its subscribers, be sure to join before the markets start making new big moves and profit with us!
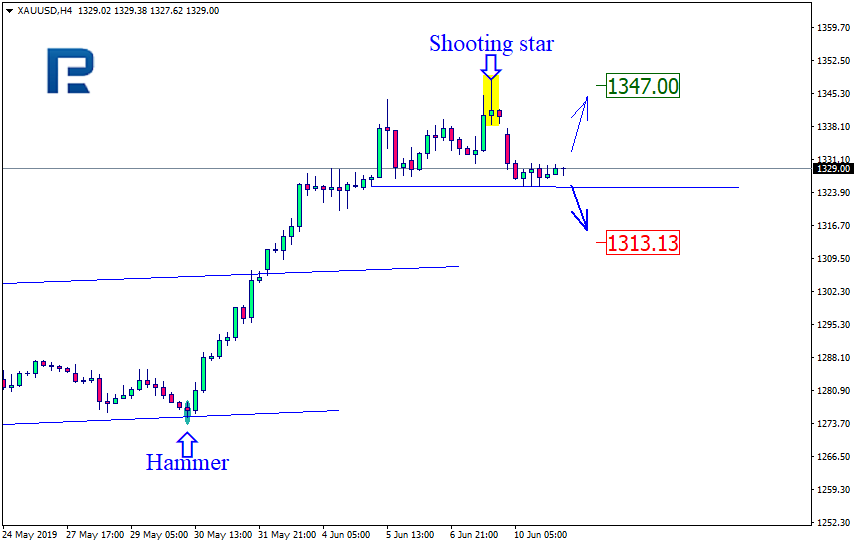
As we can see in the H4 chart, the ascending tendency continues. The pair has broken the channel’s upside border and formed Shooting Star pattern. Right now, it is trading downwards and testing the support level. If the pair breaks it, the instrument may fall to reach the next target at 1313.13. At the same time, we shouldn’t exclude an opposite scenario, which implies that the price may rebound and resume moving upwards with the target at 1347.00.
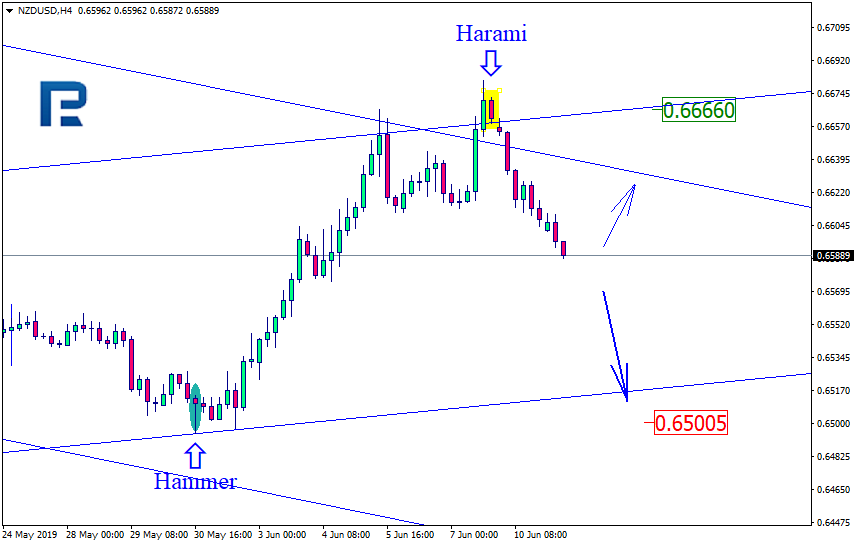
NZDUSD, “New Zealand vs. US Dollar”
As we can see in the H4 chart, NZDUSD has been trading downwards for quite a long time. It has formed Shooting Star reversal pattern at 0.6666; right now, it is forming another correctional wave and testing the resistance line of the descending channel. Possibly, the price may reverse and resume falling towards its closest target at 0.6500 to continue forming the descending channel. At the same time, one shouldn’t exclude an opposite scenario, according to which the instrument may move upwards without any corrections and update its closest highs.
Attention! Forecasts presented in this section only reflect the author’s private opinion and should not be considered as guidance for trading. RoboForex LP bears no responsibility for trading results based on trading recommendations described in these analytical reviews.
Generally, people think of debt as something to avoid. Debt usually means “bad” and no debt means you are better off financially. So the idea of using debt to build wealth can seem a bit dubious. Can you really build wealth using debt?
In order to answer this question, we first need to know that there are two kinds of debt. There is good debt and bad debt. And though the thought of debt being “good” seems counter-intuitive, the fact remains that some debt is actually good.
Good debt is a debt that will increase your finances over time. So something like a small business loan is good debt because you use the money you borrowed to build up your business, thus, bulking up your finances in the long run. Good debt also has a smaller interest. So while you are expanding your business with your small business loan, you aren’t paying an exorbitant amount in interests. This type of debt also allows you ample time to pay back your debt.
Bad debt is the exact opposite. This kind of debt has astonishingly high-interest rates and usually involves some form of collateral. There is also a very short turnaround time for you to pay your debt, plus interest, back. Some examples of bad debt are credit card debts, car title loans, and payday loans. A loan of $100 will have you paying back nearly the same amount in interests alone. Bad debt will sink you financially faster than a boat riddled with holes.
So now that you know the two types of debt, you can probably guess which one can be used to build wealth. The question now is “how”.
A good way is the example stated above. Use debt to expand your business. If you do not have a business, use debt to invest. It could be in property or in various investment funds. Whatever you decide to invest in, it is important to know your risk tolerance and how much you are willing to invest.
The principle of leverage can help you out as well. Say for example you are investing 100 dollars of your own with an expected return rate of 10%. This will earn you a return of $10. If you borrowed money with an interest rate of less than 10%, you can add to your initial $100 investment and still earn from it despite having to pay off the debt you used to invest. You can diversify your financial portfolio using this strategy as well; borrow to invest in different institutions and different kinds of investments.
There are a few to consider when using debt to invest. Think of your tolerance for debt. Can you realistically pay off your monthly payments? Can you pay off that debt within the time frame or do you need more time? Consider your cash flow as well. You need to make sure that you have enough income to pay off your debt.
So the answer to the question can debt be used to build wealth is yes, you can. You just need to choose the right kind of debt, invest in the right things, and keep in mind your debt tolerance.
EUR/USD stabilized after a long rally since the beginning of the month. Right now the quotes are consolidating. The local support and resistance are 1.12900 and 1.13250. USD remains under pressure due to the growth of expectations for the Federal Reserveto decrease the rates on the next meeting. The investors keep watching the trade conflict between the US and China. Yesterday Donald Trump claimed that is willing to introduce additional fees on wares worth more than 300 billion USD if the trade will won’t be signed on the G20 summit in Japan. You should open positions from the key levels.
At 15:30 (GMT+3:00) the US will publish the Manufacturer Price Index.
The indicators do not provide precise signlas, the price is consolidating next to 50 MA which acts as a strong dynamic support.
The MACD histogram is close to 0.
The Stochastic Oscillator is in the neutral zone, the %K line is crossing the %D line. There are no signals at the moment.
Trading recommendations
Support levels: 1.12900, 1.12500, 1.12200
Resistance levels: 1.13250, 1.13450, 1.14000
If the price fixes above 1.13250, expect further growth toward 1.13600-1.13800.
Alternatively, the quotes can descend towards 1.12600-1.12400.
The GBP/USD currency pair
Technical indicators of the currency pair:
Prev Open: 1.27264
Open: 1.26838
% chg. over the last day: -0.25
Day’s range: 1.26770 – 1.26926
52 wk range: 1.2438 – 1.3631
GBP/USD is in the bearish mood. The trading instrument updated the local minimums. The demand for GBP is weakened after the release of the weak GDP reports in the Manufacturing Industry in the UK. The quotes are consolidating, the key range is 1.26550-1.27700. GBP can descend further. Open positions from the key levels and track relevant info regarding Brexit.
At 11:30 (GMT+3:00) the UK will publish a labour market report.
The indicators do not provide precise signals, the price fixed between 50 MA and 200 MA.
The MACD histogram is in the negative zone but above the signal line whcih gives a weak signal to sell GBP/USD.
The Stochastic Oscillator is in the neutral zone, the %K line is crossing the %D line. There are no signals at the moment.
Trading recommendations
Support levels: 1.26550, 1.26100, 1.25800
Resistance levels: 1.27000, 1.27350, 1.27600
If the price fixes below 1.26550, expect further descend towards 1.26200-1.26000.
Alternatively, the quotes can grow towards 1.27350-1.27600.
The USD/CAD currency pair
Technical indicators of the currency pair:
Prev Open: 1.32395
Open: 1.32684
% chg. over the last day: +0.22
Day’s range: 1.32590 – 1.32722
52 wk range: 1.2727 – 1.3664
USD/CAD stabilized after a long descend and is consolidating around 1.32400-1.32900. The quotes can descend further. Keep an eye on the oil quotes dynamics and open positions from the key levels.
The Economic News Feed for 11.06.2019 is calm.
The price fixed below 50 MA and 200 MA which points to the power of th sellers.
The MACD histogram is in the negative zone but above the signal line which gives a weak signal to sell USD/CAD.
The Stochastic Oscillator is in the neutral zone, the %K line is below the %D line which points to the bearish mood.
Trading recommendations
Support levels: 1.32400, 1.32000
Resistance levels: 1.32900, 1.33450, 1.33650
If the price fixes below 1.32400, expect further descend towards 1.32000.
Alternatively, the quotes can correct towards 1.33300-1.33500.
The USD/JPY currency pair
Technical indicators of the currency pair:
Prev Open: 108.465
Open: 108.427
% chg. over the last day: -0.08
Day’s range: 108.349 – 108.642
52 wk range: 104.97 – 114.56
USD/JPY remains ambiguous. The trading instrument is moving in a flat, the key support and resistance levels are 108.350 and 108.700. The demand on the safe assets remains relatively high due to a high-stress situation in the world economy. Keep an eye on the US Treasury bonds’ yield and open positions from the key levels.
The Economic News Feed for 11.06.2019 is calm.
The indicators do not provide precise signals, 50 MA is crossing 200 MA.
The MACD histogram is in the positive zone which points to the bullish mood.
The Stochastic Oscillator is in the overbought zone, the %K line is crossing the %D line. There are no signals at the moment.
Trading recommendations
Support levels: 108.350, 108.100, 107.850
Resistance levels: 108.700, 108.900, 109.200
If the price fixes above 108.700, expect the quotes to grow towards 109.000-109.300.
Alternatively, the quotes can fall twoards 108.100-107.850.