Last week was a great week for trading as we locked in profits on a trade and raised our stops to protect the rest of our open positions. Take a look at how my trading system identifies trends, trades, and targets in the chart below.
If you want to become profitable technical traders join my educational trading newsletter and trade alerts complete with entry, targets and stop pricing.
Today we closed two winning trades at the open, and entered a NEW trade this morning markets are getting very tradable again. So ride my coattails as I navigate these financial market and build wealth while others lose nearly everything they own during the next set of crisis’.
Soon I will be adding this trading system chart in the member’s area where it updates through the day for you to follow alone and trade with me. I should mention that the newsletter pricing will be going up soon. If you subscribe before the price increase you are grandfathered in at the old/lower rate.
In part I of this research post, we highlighted how the shifting landscape of the US real estate market may be setting up an incredible trading opportunity for technical traders. It is our belief that the continued capital shift which has been driving foreign investment into US assets, real estate, and other investments may be shifting away from US real estate as tell-tale signs of stress are starting to show. Foreclosures and price drops are one of the first signs that stress exists in the markets and we believe the real estate segment could be setting up for an incredible trade opportunity.
SRS, the Proshares Ultrashort Real Estate EFT has recently completed a unique “washout low” price bottom that we believe may become an incredible trading opportunity for technical traders. If the US Fed pushes the market into a panic mode, sellers will become even more desperate to offload their homes and buyers will become even more discerning in terms of selecting what and when to buy.
Our opinion is that the recent “washout low” price bottom in SRS is very likely to be a unique “scouting party” low/bottom that may set up a very big move to the upside over the next 4 to 12+ months. If our research is correct, the continued forward navigation for the US Fed, global central banks and the average consumers buying and selling homes is about to become very volatile.
If SRS moves above the $25.50 level, our first upside Fibonacci price target and clears the $24.25 previous peak set in April 2019, it would be a very clear indication that a risk trade in Real Estate is back in play. Ideally, price holding above the $21.65 level would provide a very clear level of support negating any future price weakness below $21.50.
This weekly SRS chart highlights what we believe to be the optimal BUY ZONE and the upside price targets near $28 to $29. Since the bottom in 2009-10, after the credit market crisis, we have not seen any substantial risk in the Real Estate market for over 8+ years. Now, though, it is our opinion that this risk trade is very real and that technical trader should be aware of this potential move and what it means to protect assets and wealth.
If our research proves to be accurate and any future move by the US Fed will prompt a “rush to the exits” by home sellers, then there is really only one course of action left for us to consider. Either the Fed will reduce rates, buying some at-risk sellers a bit of time before a rush to sell overwhelms the markets and prices begin a fast decline in an attempt to secure quick buyers; or the Fed will leave rates at current levels where at-risk sellers will continue to attempt to offload their homes to any willing buyers before declining prices and panicked sellers start the “race to the bottom” in terms of pricing.
CONCLUDING THOUGHTS:
Real Estate has already run through the price advance cycle and the price maturity cycle. There is really only one cycle left to unfold at this point – the “price revaluation cycle”. This is where the opportunity lies with our suggested SRS trade setup.
We believe this bottom in SRS will result in a few more weeks of trading near price support (above $20 and below $22.50) where traders will be able to acquire their positions. The bigger move will happen as risk becomes more evident – very similar to what has recently happened in Gold. Once that risk is visible to traders/investors, the upside potentials ($28+ to $42+) won’t seem so illogical any longer.
I can tell you that huge moves are about to start unfolding not only in real estate, but metals, stocks, and currencies. Some of these super cycles are going to last years. Brad Matheny goes into great detail with his simple to understand charts and guide about this. His financial market research is one of a kind and a real eye-opener. PDF guide: 2020 Cycles – The Greatest Opportunity Of Your Lifetime
As a technical analysis and trader since 1997, I have been through a few bull/bear market cycles. I believe I have a good pulse on the market and timing key turning points for both short-term swing trading and long-term investment capital. The opportunities are massive/life-changing if handled properly.
I urge you to visit my Wealth Building Newsletter and if you like what I offer, join me with the 1 or 2-year subscription to lock in the lowest rate possible, get a FREE BAR OF GOLD and ride my coattails as I navigate these financial market and build wealth while others lose nearly everything they own during the next set of crisis’.
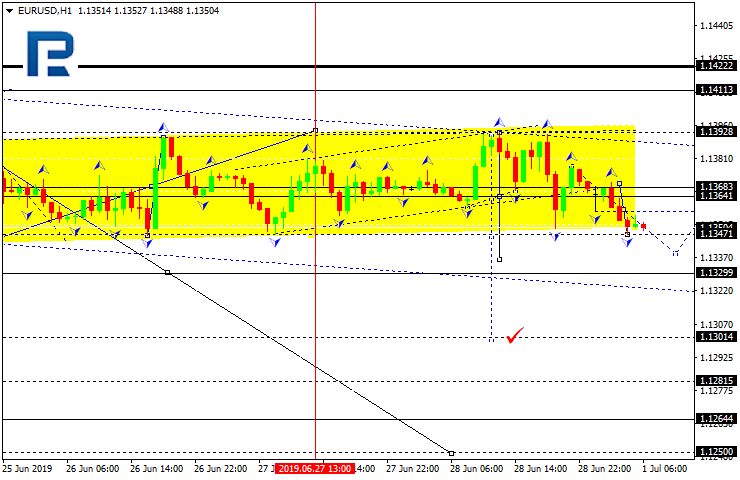
EURUSD has completed another descending structure towards the downside border of the consolidation range; right now, it is still trading downwards. Possibly, the pair may form a new consolidation range to break 1.1353. The short-term downside target is at 1.1313.
GBPUSD, “Great Britain Pound vs US Dollar”
GBPUSD has almost completed the correction. By now, it has finished another descending impulse; at the moment, it is consolidating above 1.2688. According to the main scenario, the price is expected to continue trading downwards with the short-term target at 1.2648.
USDCHF, “US Dollar vs Swiss Franc”
USDCHF is trading upwards to reach 0.9833. After that, the instrument may start another correction towards 0.9767 and then form one more ascending structure with the target at 0.9877.
USDJPY, “US Dollar vs Japanese Yen”
After reaching the target at 108.40, USDJPY is consolidating. If later the price breaks the range to the downside, the instrument may start a new correction towards 107.55; if to the upside – resume trading upwards with the target at 108.80.
AUDUSD, “Australian Dollar vs US Dollar”
After reaching the target at 0.7020, AUDUSD is forming the first descending impulse; it has broken the ascending wave’s channel. Possibly, the pair may form the descending wave with the first target at 0.6924.
USDRUB, “US Dollar vs Russian Ruble”
USDRUB has completed the correction at 62.95. Possibly, today the pair may grow to reach 63.43 and then fall to return to 62.95, thus forming a new consolidation range. If later the price breaks the range to the upside, the instrument may continue trading upwards to reach 65.00; if to the downside – form a new descending structure with the target at 62.30.
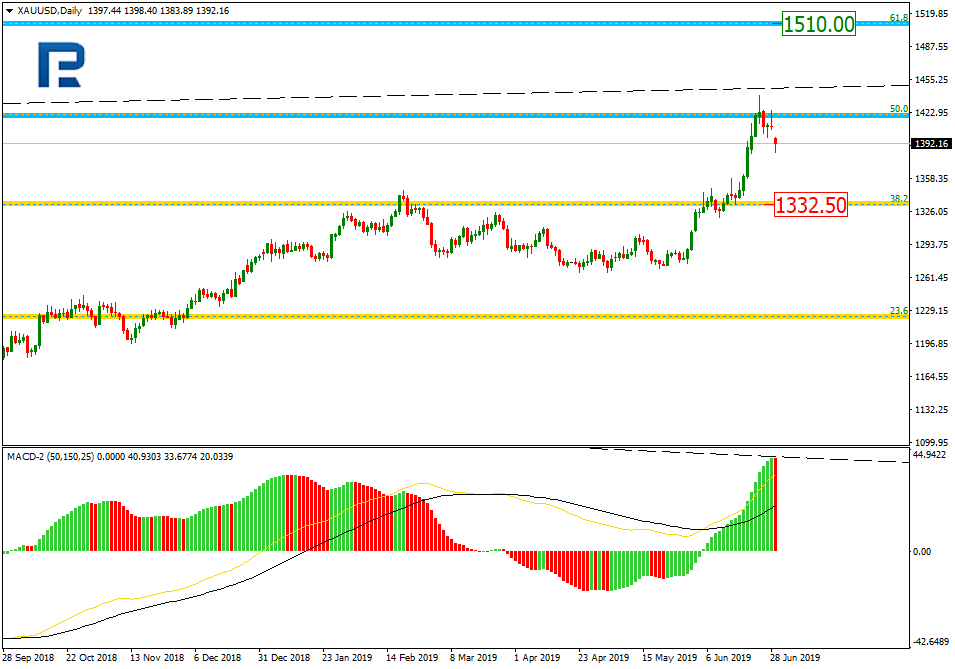
XAUUSD, “Gold vs US Dollar”
Gold has completed the descending structure at 1386.50. Today, the pair may start a new correction to reach 1407.33 at least. Later, the market may continue trading downwards with the short-term target at 1350.50.
BRENT
Brent is trading upwards. Possibly, the pair may reach 67.01 and then start another correction towards 65.35. After that, the instrument may form one more ascending structure with the target at 69.30.
Attention! Forecasts presented in this section only reflect the author’s private opinion and should not be considered as guidance for trading. RoboForex LP bears no responsibility for trading results based on trading recommendations described in these analytical reviews.
As we can see in the daily chart, the divergence made XAUUSD made reverse after reaching long-term 50.0% fibo and start a new decline. The downside target is short-term 38.2% fibo at 1332.50. Right now, it’s too early to think about a reverse. After finishing this descending correction, the price is expected to start another rising wave towards 61.8% fibo at 1510.00.
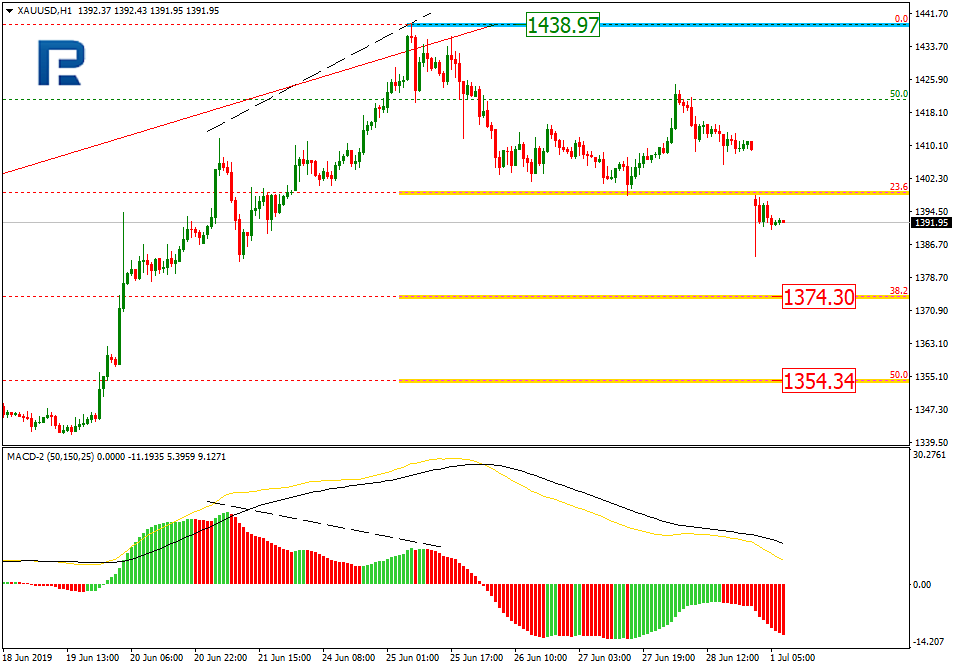
The H1 chart shows more detailed structure of the current correction. After breaking 23.6% fibo, the instrument may fall towards 38.2% and 50.0% fibo at 1374.30 and 1354.34 respectively. The resistance is the high at 1438.97.
USDCHF, “US Dollar vs Swiss Franc”
As we can see in the daily chart, after reaching 50.0% fibo, USDCHF is forming a new pullback. The resistance is at 23.6% fibo at 0.9988. After completing the pullback, the price may fall towards 61.8% fibo at 0.9588.
In the H1 chart, the correctional up trend continues; the pair has already reached 38.2% fibo and may continue growing towards 50.0 and 61.8% fibo at 0.9854 and 0.9892 respectively. The support is the low at 0.9693.
Attention! Forecasts presented in this section only reflect the author’s private opinion and should not be considered as guidance for trading. RoboForex LP bears no responsibility for trading results based on trading recommendations described in these analytical reviews.
The EUR/USD went down and updated the local lows. The key range is 1.13150-1.13550. On Saturday, the leaders of the United States and China were able to negotiate a truce and plan to continue trade negotiations. Keep track of current information on this issue. The key event this week will be the US Labor Market Report for June, which will be published on Friday July 5th. The quotes have the potential for further correction after a protracted rally. We recommend to open positions from key levels.
The Economic News Feed for 01.07.2019:
– The business activity index in the manufacturing sector in Germany (EU) – 10:55 (GMT+3:00);
– Reports on the German labor market (EU) – 10:55 (GMT+3:00);
– The business activity index in the US manufacturing sector from ISM – (EU) – 17:00 (GMT+3:00);
The indicators indicate the power of sellers: the price has fixed below 50 MA and 100 MA.
MACD.
The MACD histogram is in the negative zone and below the signal line, which gives a strong signal to sell EUR/USD.
The Stochastic Oscillator is in the oversold zone, the %K line crossed the %D line. There are no signals at the moment.
Support levels: 1.13150, 1.12700
Resistance levels: 1.13550, 1.13900, 1.14100
If the price consolidates below 1.13150, a further correction of the EUR/USD currency pair is expected towards 1.12800-1.12600.
Alternatively, the quotes can grow towards 1.13800-1.14000.
The GBP/USD currency pair
Technical indicators of the currency pair:
Prev Open: 1.26613
Open: 1.26940
% chg. over the last day: +0.15
Day’s range: 1.26779 – 1.27056
52 wk range: 1.2438 – 1.3631
GBP/USD continues to trade in a flat. There is no defined trend. The key support and resistance levels continue to be 1.26650 and 1.27150. The financial market participants expect additional drivers. Today, the investors will evaluate important economic releases from the UK and the USA. We recommend to open positions from key levels.
At 11:30 (GMT + 3: 00) the business activity index in the UK manufacturing sector will be published.
The indicators do not give accurate signals: the price crossed 50 MA and 100 MA.
The MACD histogram is near the 0 mark.
The Stochastic Oscillator is in the neutral zone, the %K line is below the %D line, indicating a bearish mood.
Trading recommendations
Support levels: 1.26650, 1.26400, 1.26000
Resistance levels: 1.27150, 1.27600, 1.27850
If the price consolidates below 1.26650, the quotes will rise towards 1.26300-1.26000.
Alternatively, the quotes could grow towards 1.27500-1.27700.
The USD/CAD currency pair
Technical indicators of the currency pair:
Prev Open: 1.30942
Open: 1.30843
% chg. over the last day: -0.02
Day’s range: 1.30814 – 1.31080
52 wk range: 1.2727 – 1.3664
The USD/CAD has stabilized after a significant drop in the past two weeks. At the moment, CAD is consolidating near the round 1.31000. The key support and resistance levels are: 1.30600 and 1.31100. The CAD is supported by the positive dynamics of oil prices. However, in the near future we do not exclude technical correction of the trading instrument. Today we recommend you pay attention to the news background from the United States. Positions must be opened from key levels.
Canada’s financial markets are closed due to the holiday.
Indicators do not give accurate signals: the price crossed 50 MA.
The MACD histogram is near the 0 mark.
Stochastic Oscillator is in the neutral zone, the% K line crossed the% D line. There are no signals at the moment.
Trading recommendations
Support levels: 1.30600, 1.30300, 1.30000
Resistance levels: 1.31100, 1.31500, 1.32000
If the price consolidates above the level of 1.31100, the quotes will rise towards 1.31500-1.31800.
Alternatively, the quotes can descend towards 1.30400-1.30200.
The USD/JPY currency pair
Technical indicators of the currency pair:
Prev Open: 107.776
Open: 108.288
% chg. over the last day: +0.46
Day’s range: 108.102 – 108.510
52 wk range: 104.97 – 114.56
On the USD/JPY bullish sentiment continues to prevail. Today, the trading instrument opened with a gap up of more than 35 points. USD / JPY quotes updated local highs. At the moment, the currency pair is testing the resistance level of 108.500. The mark 108.100 is already a “mirror” support. Do not rule out further weakening of the yen against the US dollar. Positions must be opened from key levels.
Pay attention to economic releases from the USA.
The price has fixed above 50 MA and 100 MA, which indicates the strength of buyers.
The MACD histogram is in the positive zone and above the signal line, which gives a strong signal to buy USD / JPY.
The Stochastic Oscillator is in the neutral zone, the% K line is above the% D line, which also indicates bullish moods.
Trading recommendations
Support levels: 108.100, 107.750, 107.500
Resistance levels: 108.500, 108.700, 109.000
If the price consolidates above the mark of 108.500, further growth of the USD / JPY quotes is expected. The potential movement to 108.700-109.000.
Alternatively the quotes can decrease towards 107.750-107.500.
On Friday, the US dollar declined slightly against a basket of major currencies in expectation of a meeting between the US President and the Chinese President at a summit in Japan. The US dollar index (#DX) closed in the negative zone (-0.08%). On Saturday, there was a meeting between Donald Trump and Xi Jinping, which they thought was pretty good. The US President made concessions to China and refused to further duties increase in order to reduce tensions with Beijing. China, in turn, agreed to make new purchases of US agricultural products and return to the negotiating table. We recommend following current information regarding the US-China trade relations.
On Friday, data on the GDP of the UK and Canada were also published. Thus, the UK GDP (q/q) grew by 0.5%, as experts expected. The UK GDP (y/y) grew by 1.8%, which matched the forecasts. Canada GDP (m/m) increased by 0.3%, which turned out to be better than the forecasted growth by 0.1%. This week, economic reports from the United States will be in the focus of attention.
Today, during the Asian trading session, ambiguous data from Japan have been published. Thus, Tankan large manufacturers index (Q2) counted to 7 and was worse than the forecasted value of 9. Meanwhile, Tankan large non-manufacturers index (Q2) counted to 23 instead of the expected value of 20. Also, Chinese Caixin manufacturing PMI was published, which counted to 49.4 and was worse than the expected value of 50.0.
The “black gold” prices have increased by more than 2% in expectation of the OPEC+ deal extension. At the moment, futures for the WTI crude oil are testing the mark of $60.00 per barrel.
Market Indicators
On Friday, the bullish sentiment was observed in the US stock market: #SPY (+0.51%), #DIA (+0.26%), #QQQ (+0.13%).
The 10-year US government bonds yield has been growing. Currently, the indicator is at the level of 2.01-2.02%.
The news feed on 2019.07.01:
– German manufacturing PMI at 10:55 (GMT+3:00); – Report on the labor market in Germany at 10:55 (GMT+3:00); – The index of economic activity in the UK manufacturing sector at 11:30 (GMT+3:00); – ISM manufacturing PMI at 17:00 (GMT+3:00).
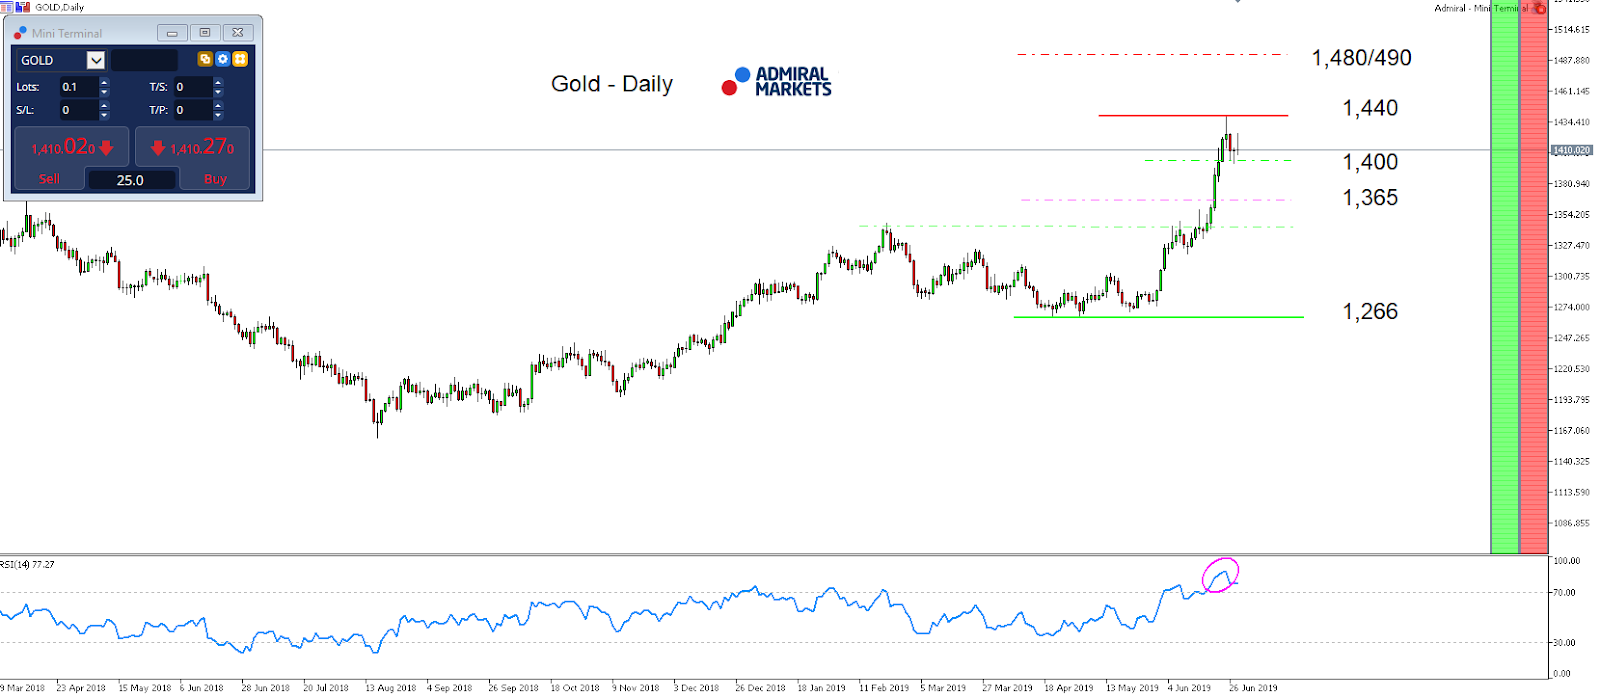
In several of our recent technical pieces, we saw Gold push with serious bullish potential if the multi-year-resistance zone around 1,360/365 USD, initially triggered by the US Federal bank on June 19.
And we weren’t disappointed.
Over the last few days, the precious metal took on serious momentum and hit a first potential target on the upside around 1,440 USD, a potential stop-over up to the long-term target at 1,700 USD.
After Fed chief Bullard mentioned in a Bloomberg interview last Tuesday, that a 50bp rate cut in July would be overdone, Gold started to consolidate but stabilised above 1,400 USD.
Also technically, a corrective move seemed likely with the RSI(14) on a daily-time-frame hitting its highest level since February 2016.
That said, today’s ISM Manufacturing data is very interesting, and should be carefully watched by traders: a data set coming in better than expected could trigger a deeper correction, even though we still consider a dip as low as 1,360/365 very optimistic in the days to come.
On the other hand, and based on our experience, we know Gold tends to be quite trend-stable and even if the mode looks quite extended, Gold could continue to trade even higher without looking back.
This seems especially true if the incoming US data continues to disappoint in the days to come. That said, further gains up to 1,480/490 USD, a high from May 2013, are a serious option, too:
Source: Admiral Markets MT5 with MT5-SE Add-on Gold Daily chart (between March 19, 2018, to June 28, 2019). Accessed: June 28, 2019, at 10:00pm GMT – Please note: Past performance is not a reliable indicator of future results, or future performance.
In 2014, the value of Gold fell by 1.7%, in 2015, it fell by 10.4%, in 2016, it increased by 8.1%, in 2017, it increased by 13.1%, in 2018, it fell by 1.6%, meaning that after five years, it was up by 6.4%.
Investing in Forex with Admiral Markets
Admiral Markets offers professional traders the ability to trade with a custom, upgraded version of MetaTrader 5, allowing you to experience trading at a significantly higher, more rewarding level. Experience benefits such as the addition of the Market Heat Map, so you can compare various currency pairs to see which ones might be lucrative investments, access real-time trading data, and so much more. Click the banner below to start your FREE download of MT5 Supreme Edition!
Disclaimer: The given data provides additional information regarding all analysis, estimates, prognosis, forecasts or other similar assessments or information (hereinafter “Analysis”) published on the website of Admiral Markets. Before making any investment decisions please pay close attention to the following:
This is a marketing communication. The analysis is published for informative purposes only and are in no way to be construed as investment advice or recommendation. It has not been prepared in accordance with legal requirements designed to promote the independence of investment research, and that it is not subject to any prohibition on dealing ahead of the dissemination of investment research.
Any investment decision is made by each client alone whereas Admiral Markets shall not be responsible for any loss or damage arising from any such decision, whether or not based on the Analysis.
Each of the Analysis is prepared by an independent analyst (Jens Klatt, Professional Trader and Analyst, hereinafter “Author”) based on the Author’s personal estimations.
To ensure that the interests of the clients would be protected and objectivity of the Analysis would not be damaged Admiral Markets has established relevant internal procedures for prevention and management of conflicts of interest.
Whilst every reasonable effort is taken to ensure that all sources of the Analysis are reliable and that all information is presented, as much as possible, in an understandable, timely, precise and complete manner, Admiral Markets does not guarantee the accuracy or completeness of any information contained within the Analysis. The presented figures refer that refer to any past performance is not a reliable indicator of future results.
The contents of the Analysis should not be construed as an express or implied promise, guarantee or implication by Admiral Markets that the client shall profit from the strategies therein or that losses in connection therewith may or shall be limited.
Any kind of previous or modeled performance of financial instruments indicated within the Publication should not be construed as an express or implied promise, guarantee or implication by Admiral Markets for any future performance. The value of the financial instrument may both increase and decrease and the preservation of the asset value is not guaranteed.
The projections included in the Analysis may be subject to additional fees, taxes or other charges, depending on the subject of the Publication. The price list applicable to the services provided by Admiral Markets is publicly available from the website of Admiral Markets.
Leveraged products (including contracts for difference) are speculative in nature and may result in losses or profit. Before you start trading, you should make sure that you understand all the risks.
Last week, the British Pound was consolidating against the USD and the American currency had quite significant impact on it. However, it wasn’t all that influenced the Pound – as long as the Brexit matter isn’t settled, it will continue being the key trigger for the British currency.
The “no deal” Brexit scenario is still pretty alarming. The main candidate for the country’s Prime Minister position, Boris Johnson, is a Eurosceptic and if he really takes this job, he will surely try to close the deal without any transitional agreements.
This is the “hardcore” Brexit scenario, which Theresa May and her few supporters were afraid of. If Johnson takes charge of the government, he won’t give the United Kingdom any other options. It would be interesting to see what Johnson is going to do to the gilded Chamber to push his interest and stance, but it’s probably a long way off.
One way or another, the “hardcore” Brexit scenario is the most negative option of the United Kingdom, because the first thing to be hurt will be the country’s economy.
In the H4 chart, GBPUSD is moving downwards and forming the third wave within the downtrend. Possibly, today the pair may fall to break 1.2635 and then continue moving to reach 1.2560. Later, the market may start a new correction towards 1.2635 and then continue trading downwards with the first target at 1.2500. From the technical point of view, this scenario is confirmed by MACD Oscillator, as its signal line is getting closer to 0. After breaking it, the descending tendency may quicken.
As we can see in H1 chart, GBPUSD is moving inside the descending wave towards 1.2645. After that, the instrument may form a new consolidation range. If the price breaks the range to the downside, the market may continue falling with the short-term target at 1.2560. From the technical point of view, this scenario is confirmed by Stochastic Oscillator, as its signal line is falling below 50. This decline may continue down to the “oversold area”. The price’s reversing to leave this area will signal a new correction upwards.
Disclaimer
Any predictions contained herein are based on the authors’ particular opinion. This analysis shall not be treated as trading advice. RoboForex shall not be held liable for the results of the trades arising from relying upon trading recommendations and reviews contained herein.
Trading was mixed on the majors against the US dollar last week. The New Zealand dollar rose by 2.02%, the Australian dollar by 1.141%, the Canadian dollar by 1.01%, and the Swiss franc by 0.02%. Among the losers were the yen (-0.56%), the pound (-0.36%), and the euro (-0.01%).
It was surprising to see such weak fluctuations during the last few working days of the month, the second quarter, and first half of the year. Nobody tried to break through or defend any key levels. This was due to the fact that everybody had their eyes fixed on the meeting between the Chinese and American presidents. Over the course of the last month, the euro gained 1.78% against the dollar, and 1.44% over the last quarter.
The bulls triggered stop levels on short positions above 1.1380 before retreating to the 1.1350 support. The bears did the same thing in today’s Asian session, triggering the stop levels on long positions below 1.1350.
17:00 US: ISM manufacturing PMI (Jun), construction spending (May).
Current situation:
Expectations that stop levels above 1.1380 would be triggered were met in full.
The heads of state of the US and China have reopened trade talks. Washington has suspended the introduction of new trade tariffs. Trading opened down on all the major currencies. Markets have determined that while the trade war has been put on hold, without a preliminary agreement having been reached, the situation could worsen at any moment.
After breaking the 1.1350 support, the pair dropped to the lower line of the channel at 1.1322. Judging by wave structure of the downwards movement from 1.1412, I’m expecting an upwards correction here. The 67th degree is a strong level for us. Since it’s bolstered by the channel from below, following high volatility in the Asian session, markets could take a break here to decide in which direction to proceed. I’m predicting a recovery to 1.1342. Considering that today is Monday and there is a lot of news to come, we could see the formation of a V-model with a target of 1.1370.
A subscriber recently mentioned getting into a real estate ETF so we started going over the data which may suggest the Real Estate sector could become the next big trade over the next 12+ months. The news that the US Fed may decrease rates in an attempt to front-run global economic weakness and real estate market weakness may result in a waterfall event in local and regional real estate markets. This type of event could become a fantastic trading opportunity for technical traders.
Overall, our research has been focused on one of the hottest markets anywhere in the US, California. Los Angeles, Ventura County, Orange County, San Diego, and San Francisco make up the entire massive Southern California real estate market. The California real estate market is a fairly strong indicator for weaker market segments because the number of transactions taking place across the 400+ miles spanning San Francisco to San Diego represent multiple trillions of dollars, vast segments of consumers and types of housing as well as an incredibly diverse economic landscape ranging from coastal regions, farming regions, cities, technology hubs, agriculture and dozens of others (source).
Our concern is that a rate decrease by the US Fed may be interpreted as a “move to attempt to abate fear” instead of a “move to support the markets”. If this decrease in rates does happen and at-risk homeowners fear the Fed is trying to push buttons to adjust the consumer environment toward a “buying bias” and sellers become scared, then the race to sell faster (decreasing prices to attract buyers) may become the norm. In other words, in an effort to support the markets, the Fed could take actions that remove the floor from the markets as sellers attempt to get the best price possible before buyers become aware of the “race to the bottom” in terms of pricing.
At-risk homeowners are under increasing pressures as pricing, income and other expenses seem to have wreaked havoc with what was a traditionally strong real estate market just three years ago. It appears the Fed has raised rates just enough to start to show the cracks in the dam in Orange County and LA County, California. The increasing number of blue dots, as well as the continue “price drops” in these areas, are a very clear sign that the “hot market” is now just “mildly warm and cooling fast”. Prices are past the peak and are already starting to decline fairly rapidly.
Additionally, delinquency levels for commercial and industrial loans are starting to rise dramatically – much like what happened in 2007 – just months before the credit market crash in 2008. Commercial and Industrial loan delinquencies rose sharply from 1.14 in Q2 2007 to 1.45 in Q1 2008 – eventually peaking at 447 in Q3 2009. Currently, Delinquency levels are at 1.17 – up from 0.93 for Q4 2018. If this trend continues past September, we could be looking at a very different real estate economic picture by the end of 2019 or early 2020 (Source).
CONCLUDING THOUGHTS:
Our interpretation of the US housing market is that buyers are becoming more opportunistic as they are watching the markets and watching how sellers are dropping prices in an attempt to attract a sale. Buyers have not seen this type of activity since early 2007-08 or so when sellers were getting desperate to get out of their homes near the top of the market. At the same time, watching how sellers attempt to push their home into the hands of buyers creates a shifting dynamic in the Real Estate market. All the sudden it went from a seller’s market and is now shifting into a buyers market.
The rates of delinquencies, consumer confidence, and levels of disposable income all factor into the market’s reactions to price and sales activity. When buyers believe it is opportunistic to buy, they will move mountains to attempt to acquire a home or an asset. When buyers believe it is not opportunistic to buy an asset, they will likely decide to wait for a more opportunistic time to make their purchase.
In part II of this article, we will share our research that highlights the incredible trade setup related to the Real Estate market and how technical traders can position their portfolios for this move.
I can tell you that huge moves are about to start unfolding not only in real estate, but metals, stocks, and currencies. Some of these super cycles are going to last years. Brad Matheny goes into great detail with his simple to understand charts and guide about this. His financial market research is one of a kind and a real eye-opener. PDF guide: 2020 Cycles – The Greatest Opportunity Of Your Lifetime
As a technical analysis and trader since 1997, I have been through a few bull/bear market cycles. I believe I have a good pulse on the market and timing key turning points for both short-term swing trading and long-term investment capital. The opportunities are massive/life-changing if handled properly.
I urge you to visit my Wealth Building Newsletter and if you like what I offer, join me with the 1 or 2-year subscription to lock in the lowest rate possible, get a FREE BAR OF GOLD and ride my coattails as I navigate these financial market and build wealth while others lose nearly everything they own during the next set of crisis’.