By Dan Steinbock
During the G20 summit, China and US agreed to re-start the trade talks. As the US trade war is slowing China’s growth, the collateral damage is now spreading in the US economy, while undermining global prospects.
Despite the White House’s efforts to lobby other countries against Huawei, President Trump also said that US companies can supply the technology giant, which the US, Department of Commerce blacklisted last month.
After Osaka, the negotiators face challenging obstacles, despite still another temporary timeout. Deep bilateral disagreements prevail about major structural issues.
But what’s the current economic impact of the new trade truce?
Limited short-term impact on China
In China, the most recent US tariff hikes on $200 billion of Chinese US exports is expected to penalize about 0.1% of China’s GDP growth in the coming year. That is enough to create significant concern, but not sufficient to cause substantial damage – yet.
Even if the US would impose 25% tariffs on all goods from China, the largest Chinese companies would likely adjust, thanks to their domestic focus.
As the US-based Standard & Poor’s has stressed, half of the rated Chinese companies are state-owned-enterprises (SOEs), which operate in sectors with limited US exposure.
Moreover, the vital property sector is also reliant on domestic demand.
Nevertheless, the secondary effects of a protracted and broader trade war could prove more challenging over time. In China, such a scenario could mean greater shifts in supply chains, currency volatility, eroding market confidence.
Despite Trump’s bravado, the US economy is far from immune to trade-war damage, however. In fact, the trade wars’ adverse impact is only beginning to bite in the US.
Broader impact on US industries
In the US, the tariff increase from 10% to 25% on $200 billion of Chinese imports could directly penalize some 0.3% from growth in the coming year.
Typically, US companies that garner a significant share of their revenues from China will take the most severe hits. That’s why Trump wants China to buy “tremendous” amounts of farm goods. US farm sector has suffered the most of retaliatory measures, while the White House’s $12 billion bailout package for farmers has failed to soften the blow.
In fact, the Trump administration has worked itself into a double-bind. If it piles up another bailout of $15 to $20 billion, it might prove too little too late in the farm sector, while other industries could demand similar packages.
The damage is spreading to advanced industries, which include semiconductor giants, such as Micron Tech and Texas Instruments (40% to 60% of revenues from China), and other technology conglomerates, including Apple and TTM Technologies (about 20%), and consumer and auto companies, such as NIKE and Cooper-Standard (10% to 20%).
The White House is pressuring US firms to move their supply chains away from China. Reportedly, Apple is considering diversifying15% to 30% of its capacity away from China. Yet such proposed moves would come with a huge cost.
None of the new country destinations can offer a high-level technology and logistics infrastructure that would be comparable to that in China. So the costs of these firms will climb, which will penalize their global competitiveness. Worse, today China is the world’s largest and most rapidly-growing marketplace. If US companies reduce their presence in China, they are taking a cut in their most vital future source of income.
That’s why Trump said in Osaka that US companies can – for “time being” – supply Huawei. These giants, particularly Intel and Alphabet (Google) have lobbied intensively for Huawei, which is their major client and a substantial source of revenues. Moreover, Qualcomm and Broadcom and US semiconductor and technology sector would be hit by the loss of Huawei orders.
Collateral damage in US economy
With continued trade tensions, the damage is spreading in the U.S. economy. As the fiscal stimulus impact is fading, private investment is softening and uncertainty increasing. US economic growth is likely to remain below 2.5% in 2019 and decelerate to 1.8% in 2020.
As the impact of the Trump tax cuts and other one-time benefits will diminish, US economy will be more vulnerable to a recession risk, even a major market correction.
Worse, if the talks fail and the White House will choose to expand tariffs against all Chinese trade, it will be harder for US firms to pass on costs to consumers, which will penalize these companies’ competitiveness.
If US would raise tariffs against all Chinese imports, US growth could plunge below 1 percent in 2020 – at the eve of the midterm election.
Global economic prospects
Global economic integration is typically measured by trade, investment and migration. After a decade of slow recovery, each indicated progress. But since 2018, the Trump administration’s tariff wars have effectively undermined the expected global recovery.
World investment remains sub-optimal. World trade has suffered extraordinary decline. World migration has plunged and the number of globally displaced now exceeds 70 million people – far more than after World War II.
Of course, there is still a chance to salvage the US-China trade talks. That, however, would require a substantial reassessment of the US stance and objectives. China will not sign a trade deal that is predicated on unilateral geopolitical objectives rather than economic realities.
The final outcome cannot be based on coercion. It must rely on a mutual effort at a sustained reconciliation that will reflect both countries’ sovereign interests and the compelling long-term economic realities of the global economy.
About the Author:
Dr. Dan Steinbock is an internationally recognized strategist of the multipolar world and the founder of Difference Group. He has served at India, China and America Institute (US), Shanghai Institutes for International Studies (China) and the EU Center (Singapore). For more, see https://www.differencegroup.net/
The original, shorter commentary was released by China Daily on July 1, 2019
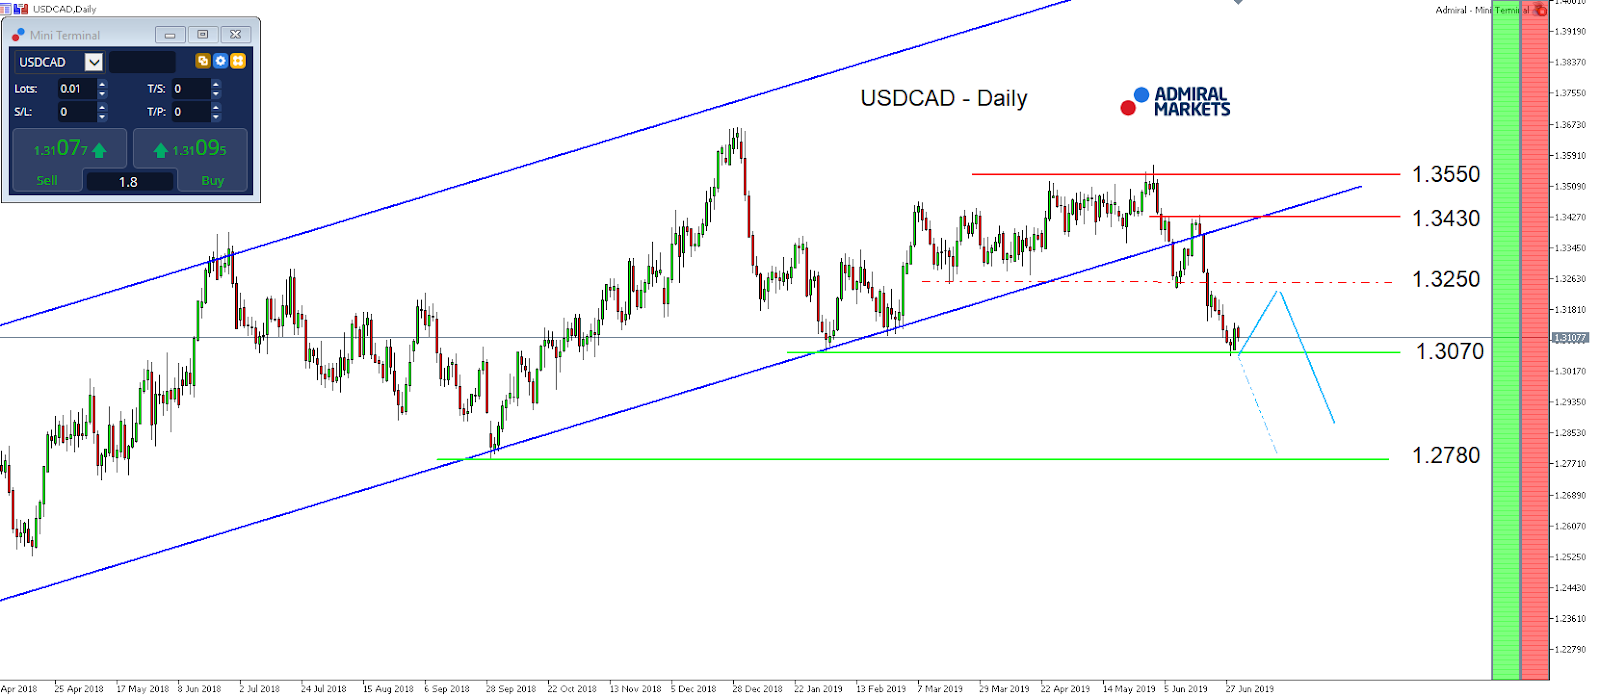
 Current situation:
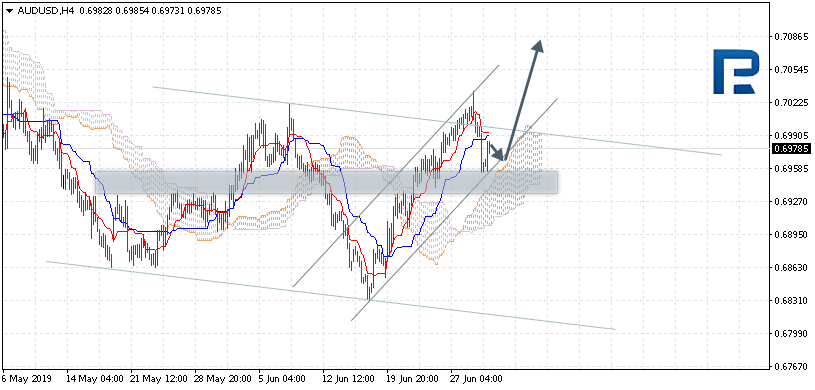